
PENGU
Pudgy Penguins
| تریدر | نوع سیگنال | حد سود/ضرر | زمان انتشار | مشاهده پیام |
|---|---|---|---|---|
 landry_anael1Rank: 14756 | فروش | حد سود: تعیین نشده حد ضرر: تعیین نشده | 11/22/2025 | |
 davidjulien369Rank: 16390 | خرید | حد سود: تعیین نشده حد ضرر: تعیین نشده | 11/23/2025 | |
 CryptojobsRank: 34439 | فروش | حد سود: تعیین نشده حد ضرر: تعیین نشده | 11/22/2025 |
Price Chart of Pudgy Penguins
سود 3 Months :
سیگنالهای Pudgy Penguins
Filter
Sort messages by
Trader Type
Time Frame

Kindlegem
سرمایهگذاری در این میم کوین: ریسک کنید یا از سودهای بزرگ جا بمانید؟

let's hope it's not in for the other thing. I'm pretty bullish on this coin, it's a meme coin so if you're in be sure to size your risk. Based on my analysis, I recommend an 8-14% portfolio position for this coin. This position is calculated matching PENGU's ATR with BTC so PENGU will not destroy your portfolio if we're in for a pounding. With all that said, I believe alts will pump very strongly in this next pump. My targets depend on when BTC reaches $117k so we'll see when we get there.
davidjulien369
تحلیل کامل معامله خرید PENGUSDT: استراتژی نوسانگیری ۲۵ درصدی با ردگیری نقدینگی

Pair: PENGUSDT Direction: Buyside Trade Date: Sat 22nd Nov 25 Time: 5.00 pm Session: NY Session PM Entry: 0.01012 Profit Target: 0.01269 (+25.38%) Stop Level: 0.009922 (–1.88%) RR: 21.39 15-Minute NY PM Session Reversal Model 1️⃣ Market Structure & Liquidity Story A. Prior Trend: Sell-Side Delivery (sweep) PENGUSDT has been in a bearish delivery sequence characterised by: Multiple bearish FVGs in premium zones A macro BOS below 0.009953 Redistribution ranges across London, New York, and Tokyo sessions A clear downward algorithmic draw toward external liquidity. B. Sell-Side Liquidity Pool Formation Multiple lows seemed engineered between: London session lows NY lows at 0.00986 Tokyo lows at 0.00990 These repeated bounces form a liquidity shelf (a perfect target for manipulation). C. Price sharply wicks below: 0.0098 to 0.00979, the 3.30 am low This sweep is validated by: Volume increase, Instant displacement upward Rejection wick reclaiming the range. Removal of weak shorts We assume this to be a manipulative SMC “STOP-RUN” D. Bullish BOS (Break of Structure) After the sweep: A strong displacement breaks the micro bearish structure New York PM high at 0.009935 - broken. The structure flips bullish for the first time in 24 hours Showing a CHoCH → BOS confirmation needed for entry requirement. 2️⃣ Institutional PD Arrays (Entry Model) A. Breaker Block + Demand Zone The entry zone (0.01000–0.01012) is built upon: A breaker block formed after the failed bearish continuation 15M demand anchored to the sweep wick Alignment with the daily open reclaim 🔹 Technical Context Model Type: Manipulation (Sell-Side Sweep) → CHoCH → BOS → Discount Re-entry → Expansion Narrative Sequence: Market builds sell-side liquidity under multi-session lows A sharp stop run / sell-side sweep clears all liquidity at 0.00979 Bullish displacement prints a BOS Price retraces neatly into: Breaker block, Bullish Fair Value Gap, Discount of previous range NY PM session (high-probability expansion) We anticipate the price to expand upward towards: Internal liquidity Premium inefficiencies 0.01269 target (FVG completion) Sentiment: "Fear-driven liquidity purge → bullish accumulation → aggressive expansion." Cycle Position: Micro accumulation inside intraday markdown → transition into buyside delivery.
davidjulien369
بررسی دقیق دو معامله خرید و فروش ارز دیجیتال: استراتژیهای معاملاتی با جزئیات کامل

Trade Journal Entry #2 — Sell-Side Trade Pair: PENGUUSDT.P Date: Fri 21st Nov 25 Time: 11:00 pm Session: Tokyo PM Direction: Sell-Side Timeframe: 15-min 🔹 Trade Details Entry: 0.010486 Profit Target: 0.007730 (+24.57%) Stop Loss: 0.012479 (–3.31%) Risk-Reward Ratio: RR 10.63 15min TF overview 🔹 Technical Context Model: Distribution → Sweep of Buyside Liquidity → Bearish BOS → FVG/OB Stack → Sell-Side Continuation Price swept liquidity above redistribution highs (0.01185 / 0.01195). Final mitigation at inflexion point 0.011631, followed by a strong bearish displacement, which caused major structure breaks at 0.009953. Multiple bearish. FVGs show continuous institutional selling. Internal low at 0.009744, External liquidity at 0.0088726 and Swing low 0.0082786. 🔹 Narrative / Sentiment The market shifted decisively to bearish sentiment following the distribution of premiums. Liquidity was taken from above highs → confirming intent to reprice lower. Tokyo session algorithm favoured sell-side continuation. Sentiment: "Distribution → Stop-Run → Breakdown → Sell-Side Target Delivery." Trade Journal Entry #1 — Buyside Trade (Completed) Pair: PENGUUSDT.P Date: Wed 19th Nov 25 Time: 3:19 pm Session: LND → NY PM Direction: Buyside Timeframe: 15-min 🔹 Trade Details Entry: 0.011728 Profit Target: 0.012234 (+3.96%) Stop Loss: 0.011634 (–1.13%) Risk-Reward Ratio: RR 3.84 Outcome: Target Hit Trade Duration: 3 hrs 45 mins 🔹 Technical Context Model: Accumulation → Sweep of Sell-Side Liquidity → Bullish BOS → Re-entry via Discount FVG. Price swept Tokyo lows beneath the yellow liquidity zone. Observed reaction produced a clean displacement candle breaking upward structure (BOS). A bullish FVG formed and provided the optimal entry on retracement. Observing the bullish OB underpinned the structure along with the daily Open bias, which supported upward continuation. 🔹 Narrative / Sentiment The market was positioned to run buyside liquidity resting above intraday highs. Accumulation beneath the daily open signalled clear bullish intent. The volume expansion confirmed institutional buying. Sentiment: "Accumulation → Intent → Execution → Target Delivery."
Cryptojobs
پنگو (PENGU) در سراشیبی سقوط: تحلیل ریزشی و پیشبینی قیمت تا ۰.۰۰۸۰۰ دلار!
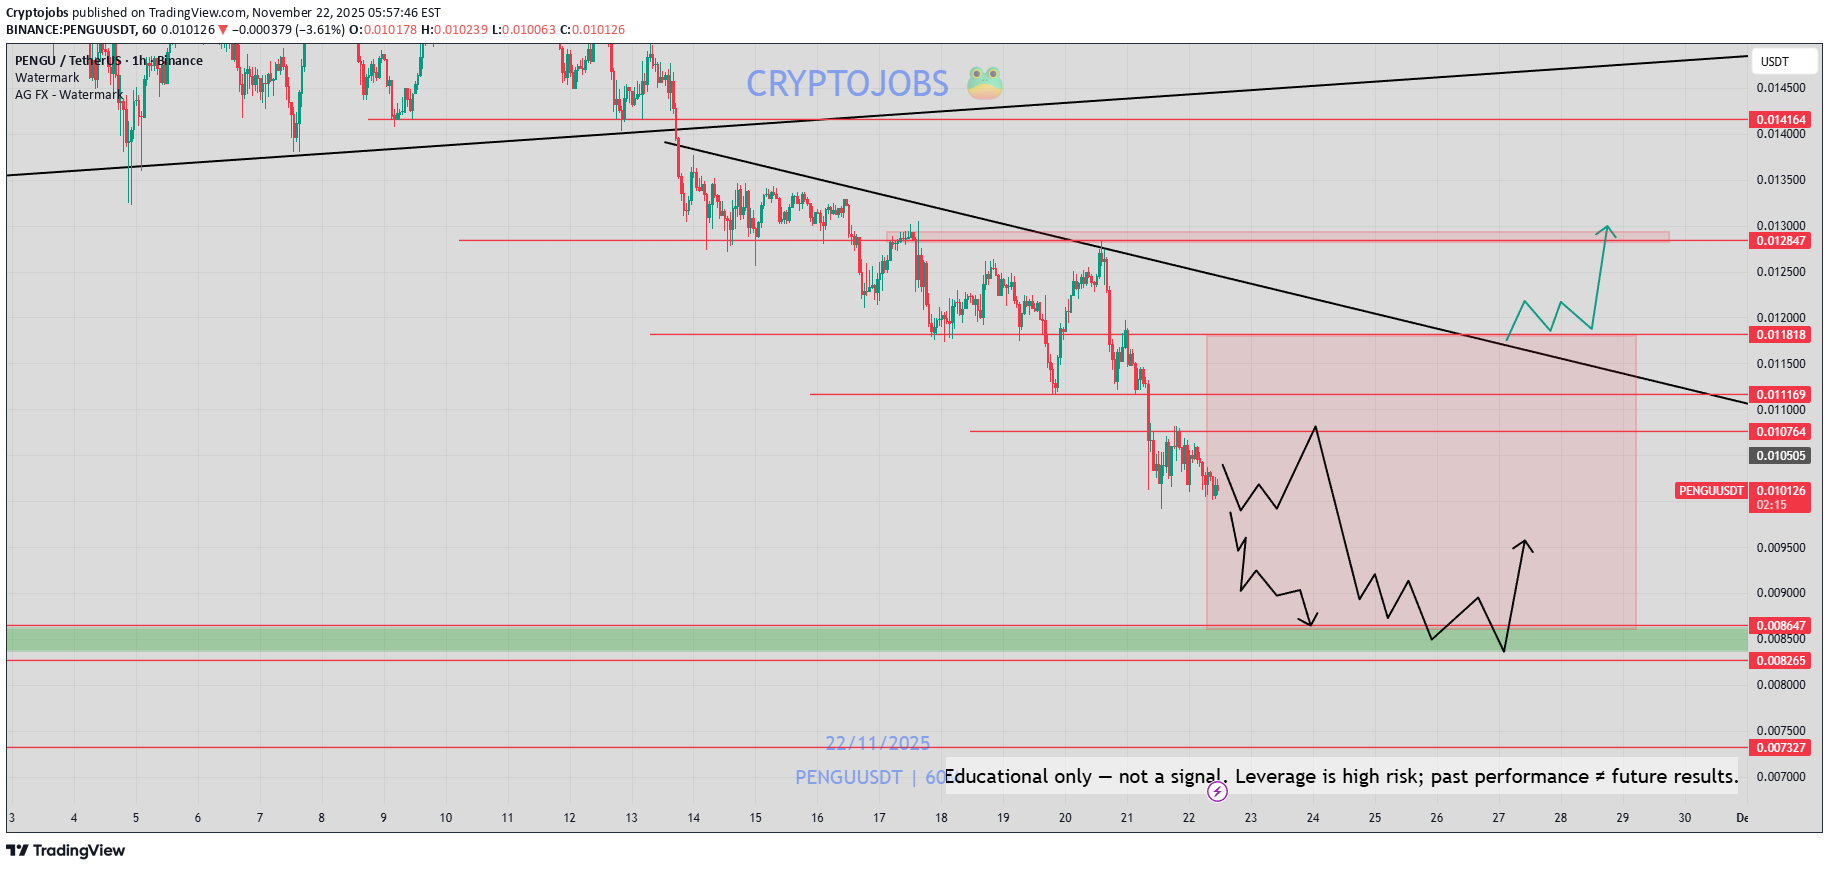
$PENGU - price analysis 🟥 Very bearish trend at the moment & no buy pressure📉 Price will likely continue to fall toward 0.00800$ lower key demand zone! 📉 Possible setup & key levels are in my charts.🐧 Not a financial advice.
landry_anael1
ادامه ریزش پنگوئن: آیا مقاومت ۰.۰۱٠۷ شکسته میشود؟

PENGU has created a range between 0.0101 and 0.0107 and has been staying there for a few hours. The top of the range is serving as resistance and is still not broken so with the bearish pressure we have ssen recently price should just bounce from it and continue down.

میم کوین پرحاشیه: وقتی وارد شدم و دیدم قیمتها کفِ کف است!

a meme coin that was so popular among rich kids perhaps i want to buy and brag it when it goes back to rick kids high price
davidjulien369
تحلیل فروش پنگوئن (PENG): رازهای ترید کوتاه مدت در بازار ارز دیجیتال!

1Hr TF overview PENGUUSDT.P — 1H Sell-Side Setup Breakdown Date: Sun 16th Nov Time: 2.00 am Session: London Session AM Direction: Sell-Side Trade 🔹Market Context & Narrative The price is currently rotating within a multi-session distribution range, with repeated failures to sustain a buyside structure above 0.01330–0.01345. The broader flow is bearish, supported by: A continuous lower-high structure formed during the London to NY sessions. Multiple FVG inefficiencies filled and rejected (clear displacement candles prior) Mid-range liquidity above Friday's 0.01335 area is acting as a consistent inducement. 🔹Smart Money Model Sequence Inducement → FVG → Break of Structure (BOS) → Entry 🔹Sentiment & Narrative Summary The chart shows a clear distribution, with each session presenting lower highs and reinforcing sell-side intent.5min TF overview

ONE1iMPACT
پنگو (PENGU/USDT): در آستانه انفجار یا سقوط؟ راهنمای خرید و فروش حیاتی!

💡 Scenario Mapping 🚀 BULLISH Case: 3D frame : If price holds above $0.012 and reclaims $0.0125: Potential bounce toward the $0.025-0.028 range Accumulation phase begins (blue box scenario) Higher lows formation = trend reversal confirmation ⚡ Trading Gameplan For Long-Term Holders: Wait for confirmation: Break and retest of $0.0013 for long entry Strong Buy: $0.0122 Stop Loss: Below $0.011 Avoid: Trading in current chop zone without clear direction ❌ ____________________ 🧠 The Bottom Line - PENGU is at a crossroads. The chart shows a classic post-parabolic correction approaching historically significant support—typical behavior for meme/community tokens after initial hype. The next few weeks will determine if this is: ✅ A generational buying opportunity (if support holds) ❌ A falling knife (if support breaks) GOOD LUCK --- * DYOR * - MANDATORY

The_Alchemist_Trader_
منطقه حیاتی PENGU: آیا نوسان صعودی در راه است؟
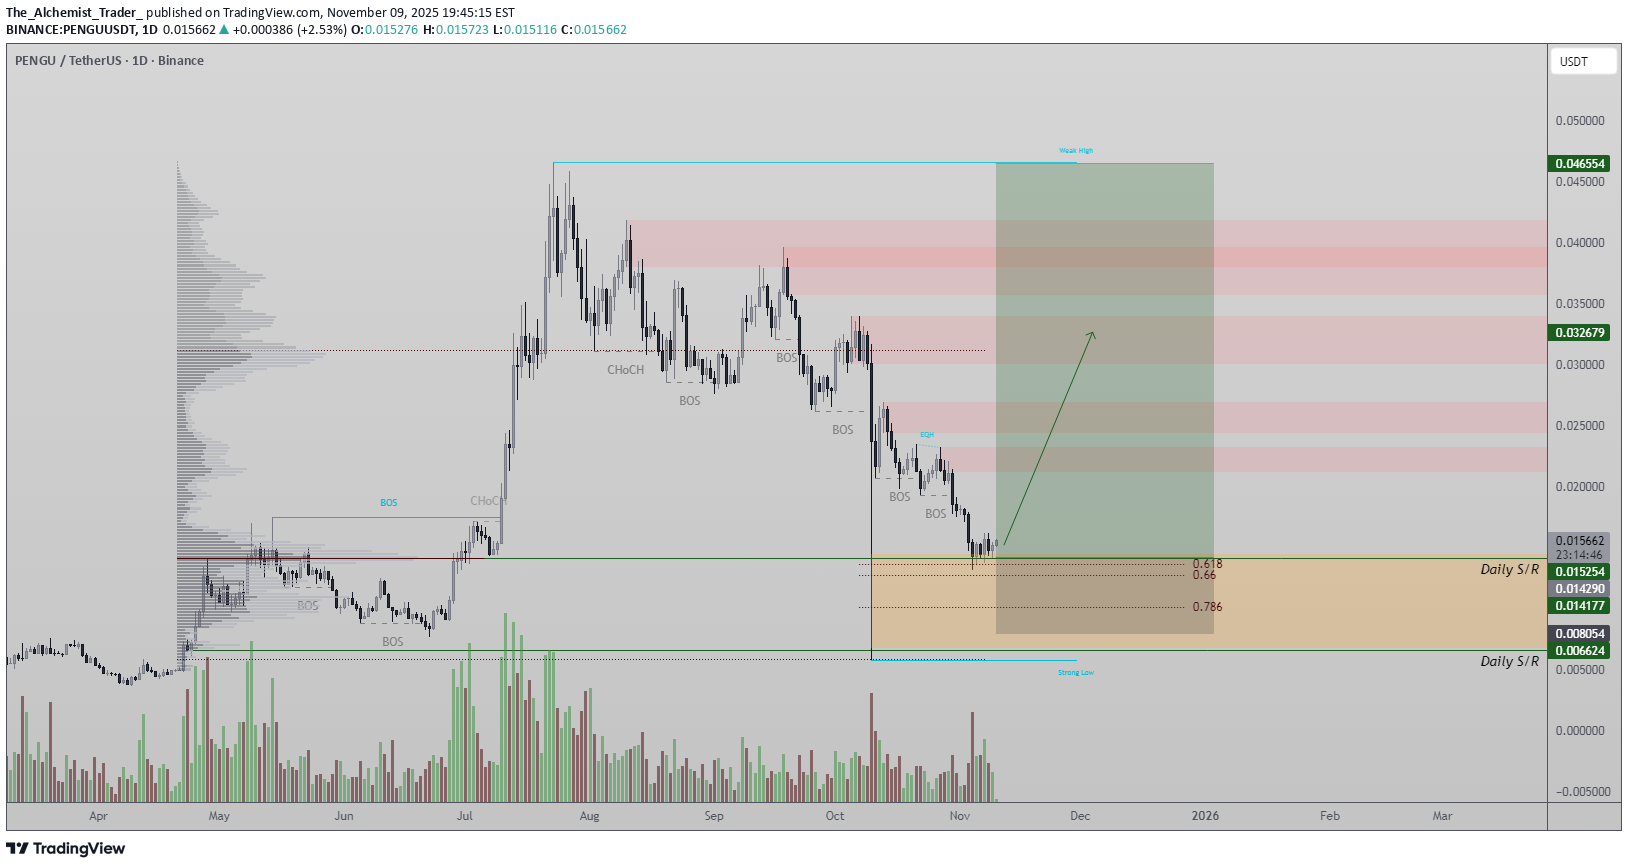
PENGU price action is currently trading at the Point of Control (POC), an area that aligns with both the 0.618 Fibonacci retracement and a previous daily support, forming a high-confluence region on the chart. This zone represents a technically significant area where a potential reversal or relief bounce could emerge if bullish volume begins to increase. - Confluence Zone: The POC, 0.618 Fibonacci, and daily support overlap to form a key inflection point. - Volume Watch: A spike in bullish volume could confirm the start of a reversal from this region. For now, further consolidation around the current level would be constructive, allowing price to form a bottoming structure on lower timeframes. While this has not yet materialized, holding the POC keeps the probability of a short-term bounce alive. PENGU remains in a critical decision area, where either a confirmed reversal or deeper continuation will be determined in the coming sessions.

quantsignals
سیگنال بیت کوین امروز: پیشبینی صعودی با ریسک متوسط (تحلیل فنی در مقابل هوش مصنوعی)
BTC QuantSignals V3 Crypto 2025-11-09 BTC Crypto Signal | 2025-11-09 • Direction: NEUTRAL | Confidence: 68% • Timeframe: 15M • Entry Range: $103500.00 • Target 1: $105586.35 • Stop Loss: $102800.00 • Volume vs Avg: 1.0× • Recent Move: +1.31% • ⚠️ MODERATE RISK WARNING: Consider reducing position size due to moderate confidence level. ⚖️ Compliance: Educational crypto commentary for QS Premium. Not financial advice. 🚀 QS V3 ELITE CRYPTO ANALYSIS Generated: 2025-11-09 07:32:08 UTC Instrument: BTC ($103516.028483) Trend: BULLISH Confidence: 65.0% Timeframe: 15M Model: QS + Katy AI Strictness: MEDIUM 🎯 TRADE RECOMMENDATION Direction: LONG Confidence: 68% Conviction Level: MEDIUM Leverage: 3x 🧠 ANALYSIS SUMMARY Katy AI Signal: Sideways trend with 65% confidence, but current market momentum shows +1.31% bullish move with technical breakout patterns suggesting upward continuation Technical Analysis: Price above key EMA levels, RSI at 58 showing room for upward movement, volume supporting recent bullish breakout from consolidation zone News Sentiment: Neutral impact from recent weekly reports with no major catalysts, allowing technical factors to dominate price action Options Flow: Institutional put/call ratio shows slight bullish bias with increased call buying activity for near-term expirations Risk Level: MODERATE - Katy's sideways prediction creates uncertainty but technical momentum favors longs 💰 TRADE SETUP Entry Price: $103450.00 - $103550.00 Take Profit 1: $105586.35 (2.1% gain) Take Profit 2: $107200.00 (3.6% gain) Stop Loss: $102800.00 (0.7% loss) Position Size: 4% of capital (adjusted for leverage and Katy's reduced confidence) ⚡ COMPETITIVE EDGE Why This Trade: Technical breakout pattern combined with institutional options flow supports upward momentum despite Katy's neutral bias Timing Advantage: Capturing the early stages of a potential Image QS Analyst APP — 7:32 AM bullish continuation move with tight risk management Risk Mitigation: Tight stop loss below recent support with position sizing reflecting Katy's reduced confidence Leverage Strategy: Conservative 3x leverage to account for Katy's sideways prediction while capturing upside potential 🚨 IMPORTANT NOTES ⚠️ MODERATE RISK - Katy AI predicts sideways movement but technical momentum suggests bullish continuation. Reduced position size recommended. ⚠️ KATY CONFLICT EXPLANATION Katy predicted sideways trend with 65% confidence over 120-minute horizon Override justified due to strong technical breakout signals and momentum indicators showing bullish continuation Specific factors: Recent +1.31% move breaking above key resistance, RSI momentum supporting further upside, institutional call buying activity Additional risk: Position requires tighter stop loss and reduced sizing to account for Katy's neutral bias 📊 TRADE DETAILS 📊 🎯 Instrument: BTC 🔀 Direction: LONG 📈 💵 Entry Price: 103500.00 🎯 Profit Target: 105586.35 🛑 Stop Loss: 102800.00 📏 Size: 4.0 📈 Confidence: 68% ⏰ Entry Timing: N/A 🕒 Signal Time: 2025-11-09 10:32:05 EST ⚠️ MODERATE RISK WARNING: Consider reducing position size due to moderate confidence level. --- QS V3 Crypto Strategy System - Professional cryptocurrency trading with Katy AI intelligence and 24/7 market analysis.
Disclaimer
Any content and materials included in Sahmeto's website and official communication channels are a compilation of personal opinions and analyses and are not binding. They do not constitute any recommendation for buying, selling, entering or exiting the stock market and cryptocurrency market. Also, all news and analyses included in the website and channels are merely republished information from official and unofficial domestic and foreign sources, and it is obvious that users of the said content are responsible for following up and ensuring the authenticity and accuracy of the materials. Therefore, while disclaiming responsibility, it is declared that the responsibility for any decision-making, action, and potential profit and loss in the capital market and cryptocurrency market lies with the trader.