
ONE1iMPACT
@t_ONE1iMPACT

What symbols does the trader recommend buying?
Purchase History
پیام های تریدر
Filter
ONE1iMPACT
ETH/USDT Long Setup - Double Target Strategy

Setup Type: Range Breakout | Timeframe: Daily | Bias: Bullish 📈 🎯 Trade Parameters Buy Zone: $2,903 (accumulation range) TP 1: $3,278 (+12.9% from entry) TP 2: $3,911 (+35% from entry) Stop Loss: $2,743.99 (-5.5% risk) _____________________ 📈 Technical Structure Ethereum is forming a classic bottoming pattern after the December correction, consolidating within a defined range that's acting as a strong demand zone. The rectangular base suggests institutional accumulation before the next impulse wave. 🔑 Market Context Price has respected the $2,878-$2,906 support cluster multiple times, showing strong buyer interest. The projected Elliott Wave structure indicates a multi-wave rally targeting previous resistance zones with TP1 at the 0.382 retracement and TP2 at the 0.618 extension level. ⚡ Execution Plan Ladder entries in the buy zone with scale-out strategy: take 50% profits at TP1, move stop to breakeven, and let the remainder run to TP2. The corrective pattern is nearing completion, and volume profile suggests smart money positioning. Risk/Reward: 1:2.4 (TP1) | 1:6.5 (TP2) NOTE : The analysis emphasizes the accumulation phase and multi-target approach, perfect for swing traders looking to capture the next ETH rally.
ONE1iMPACT
سیگنال خرید طلایی ZCash: بازیابی قدرت با سود 48% در تایم فریم روزانه!
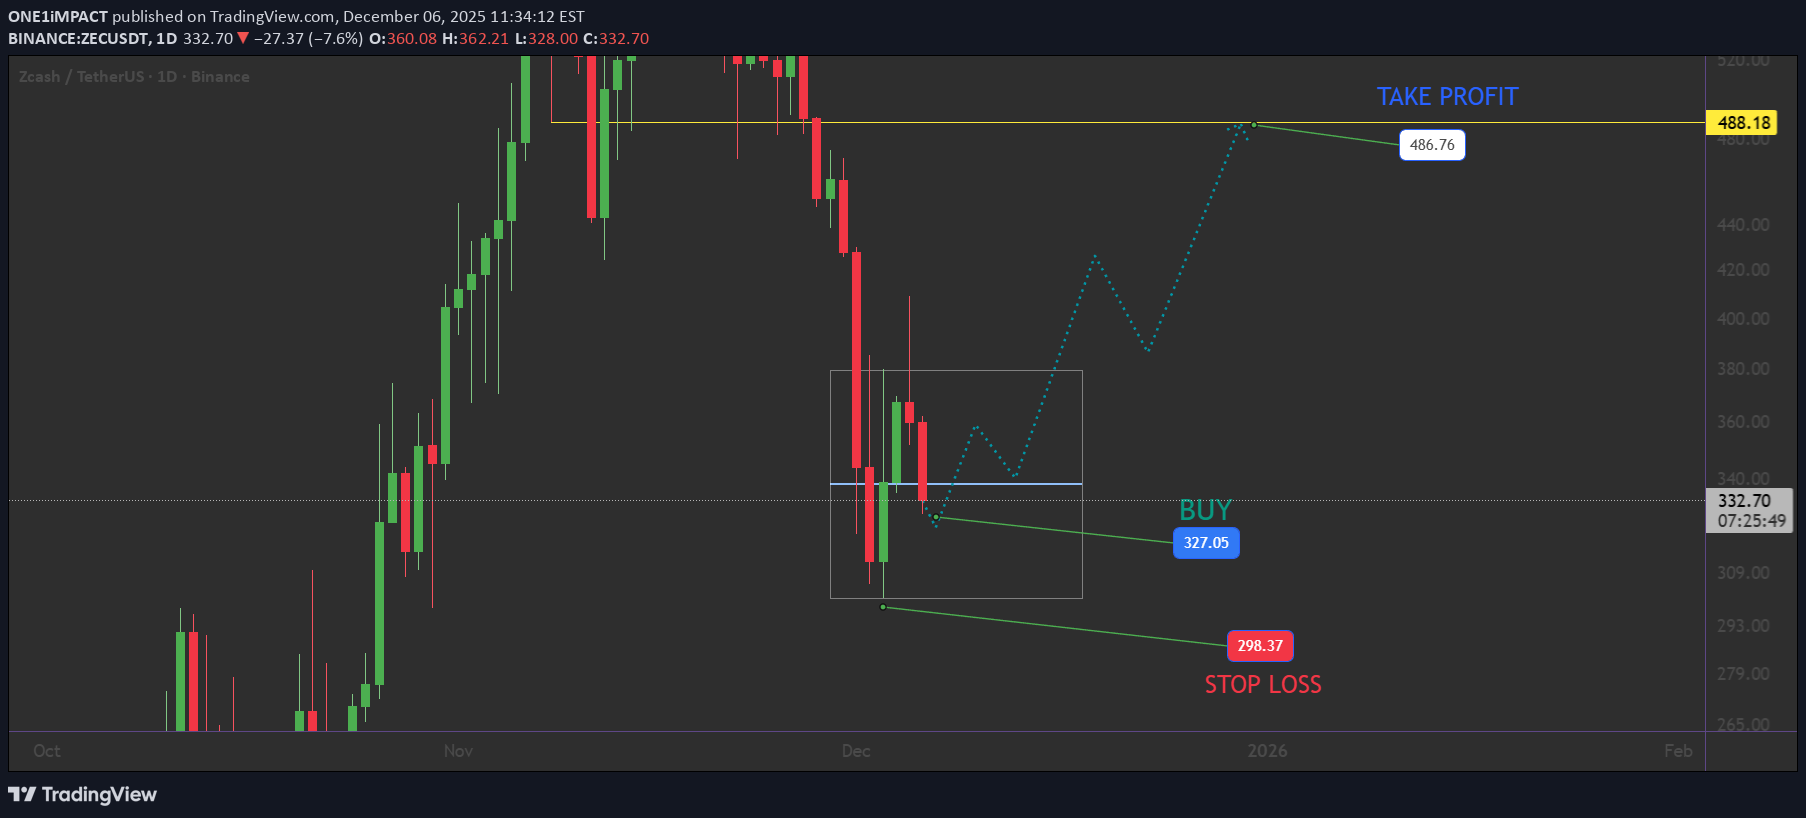
🎯 Trade AWAIT ... Setup Type: Trend Reversal | Timeframe: Daily | Bias: Bullish 🚀 Entry Zone: $327 (BUY) Take Profit: $486 (+48% gain) Stop Loss: $298 (-6% risk) Risk/Reward Ratio: 1:5.5 ✅ _______________________ 📈 Technical Overview ZCash has completed a classic corrective pattern after the November rally, forming a descending channel with strong support around $298-$327. Price action shows decreasing selling pressure with bullish divergence building on lower timeframes. 🔑 Key Insights The projected wave structure suggests a powerful impulse move targeting the $486 zone, coinciding with the 0.618 Fibonacci extension. The rectangular consolidation zone acts as a springboard for the next leg up, with volume declining during the correction—a textbook accumulation phase. ⚡ Strategy Conservative entry at current support with tight stop below recent lows. The asymmetric risk/reward makes this an attractive swing trade opportunity. Watch for volume confirmation on the breakout above $360 for trend validation. FOLLOW FOR MORE ..ORDER DONE AT 327.... NOW WE WAIT CONFIRMATION ABOVE 360 .. THEN WE WILL CHANGE STOP LOSS AT BE..ITS 22% profit now .. change stop loss to BE .and ENJOYUPDATE HEREBRAVO FOR OUR FOLLOWES TAKR PROFIT ITS ARCHIVED NOW MORE THEN 50% profit ..$525 its red zone be careful guys ...
ONE1iMPACT
پنگو (PENGU/USDT): در آستانه انفجار یا سقوط؟ راهنمای خرید و فروش حیاتی!

💡 Scenario Mapping 🚀 BULLISH Case: 3D frame : If price holds above $0.012 and reclaims $0.0125: Potential bounce toward the $0.025-0.028 range Accumulation phase begins (blue box scenario) Higher lows formation = trend reversal confirmation ⚡ Trading Gameplan For Long-Term Holders: Wait for confirmation: Break and retest of $0.0013 for long entry Strong Buy: $0.0122 Stop Loss: Below $0.011 Avoid: Trading in current chop zone without clear direction ❌ ____________________ 🧠 The Bottom Line - PENGU is at a crossroads. The chart shows a classic post-parabolic correction approaching historically significant support—typical behavior for meme/community tokens after initial hype. The next few weeks will determine if this is: ✅ A generational buying opportunity (if support holds) ❌ A falling knife (if support breaks) GOOD LUCK --- * DYOR * - MANDATORY
ONE1iMPACT
پیشبینی تاریخی بیت کوین: راز موج الیوت و مسیر رسیدن به ۱۴۰ هزار دلار تا ۲۰۲۶

📊 Wave Structure Breakdown: The chart reveals a textbook Elliott Wave pattern playing out across 2024-2026, showing us exactly where we are in Bitcoin's macro cycle. LOOK TO MARCH 2025 AND NEXT POINT IS MARCH 2026 🔴 Completed Impulse Wave (1-5) Pink Labels mark the initial five-wave impulse that took BTC from lows to the $130K+ zone: (1) - Initial rally breakout (2) - Healthy correction (yellow support) (3) - Extended impulse (strongest wave) (4) - Consolidation triangle (5) - Final push to cycle high near $140K ______________ target 🔑 Key Levels to Watch Major Resistance: 🔸 $100K - Psychological + structural 🔸 $110K - Wave (3) consolidation zone 🔸 $140K - Wave (5) high / invalidation level _________________ 💡 Trading Strategy For Bulls: Wait for confirmed breakout above $100K with volume. The (B) wave could still pull back before the next leg up. For Bears: Rejection at current levels with break below $90K would confirm (C) wave continuation toward lower targets. For Swing Traders: The triangle scenario (if it plays out) offers multiple touch-point opportunities on both support and resistance. #Bitcoin #BTC #ElliottWave #WaveAnalysis #Crypto #TechnicalAnalysis #LongTermTrading #Crypto2026
ONE1iMPACT
استراتژی معامله بیت کوین: آیا اصلاح به $87,600 میرسد یا خط روند حمایت میکند؟

Current Setup Analysis Price Action: BTC recently tested resistance near $99,275 before entering a corrective phase—a textbook healthy pullback after a strong rally. Key Levels to Watch: 📍 Order Block (OB): ~$99,275 📍 Take Supply (TS): ~$99,000 📍 Primary Target: $87,600 🔹 Trendline Support: Purple ascending trendline acting as dynamic support—critical level for bulls 🔹 Projected Path: Dotted trajectory suggests a wave-like descent toward the $87,600 zone 🔹 Liquidity Sweep: Recent wick below key structure grabbed liquidity before the potential bounce _______________________________ Bullish Scenario: Trendline holds → bounce toward OB Bearish Scenario: Trendline breaks → acceleration to $87,600 target zone Risk Management Note: Wait for confirmation at key levels. False breaks are common during corrections. Let price show its hand before committing. What's your take? Are we headed to $87K first, or will the trendline hold? Drop your thoughts below! 👇 #Bitcoin #BTC #CryptoAnalysis #TechnicalAnalysis #Trading
ONE1iMPACT
BITCOIN: THE PERFECT STORM - MULTIPLE BREAKOUT PATTERNS ALIGNED

⚠️ CRITICAL SUPPORT LEVELS 🛡️ Support 1: $115,000 (-3%) - Triangle support 🛡️ Support 2: $110,000 (-7%) - Channel support 🔴 DANGER ZONE: $105,000 (-11%) - Multiple pattern failure So... Strategy: Quick profits on pattern completion 🎨 Entry: $115k (Triangle breakout confirmation) 📊 Stop Loss: $114k below (Tight risk management) ❌ Target: $125k (+10%) ✅ Time Horizon: 2-3 weeks 📅 Risk/Reward: 1:6 🎯 ________________ NOTE _____________ ⚠️ This is not financial advice. Bitcoin is highly volatile and risky. Only invest what you can afford to lose completely. Always do your own research and manage risk appropriately 🚨
ONE1iMPACT
SOLANA: THE ULTIMATE TECHNICAL CONVERGENCE..
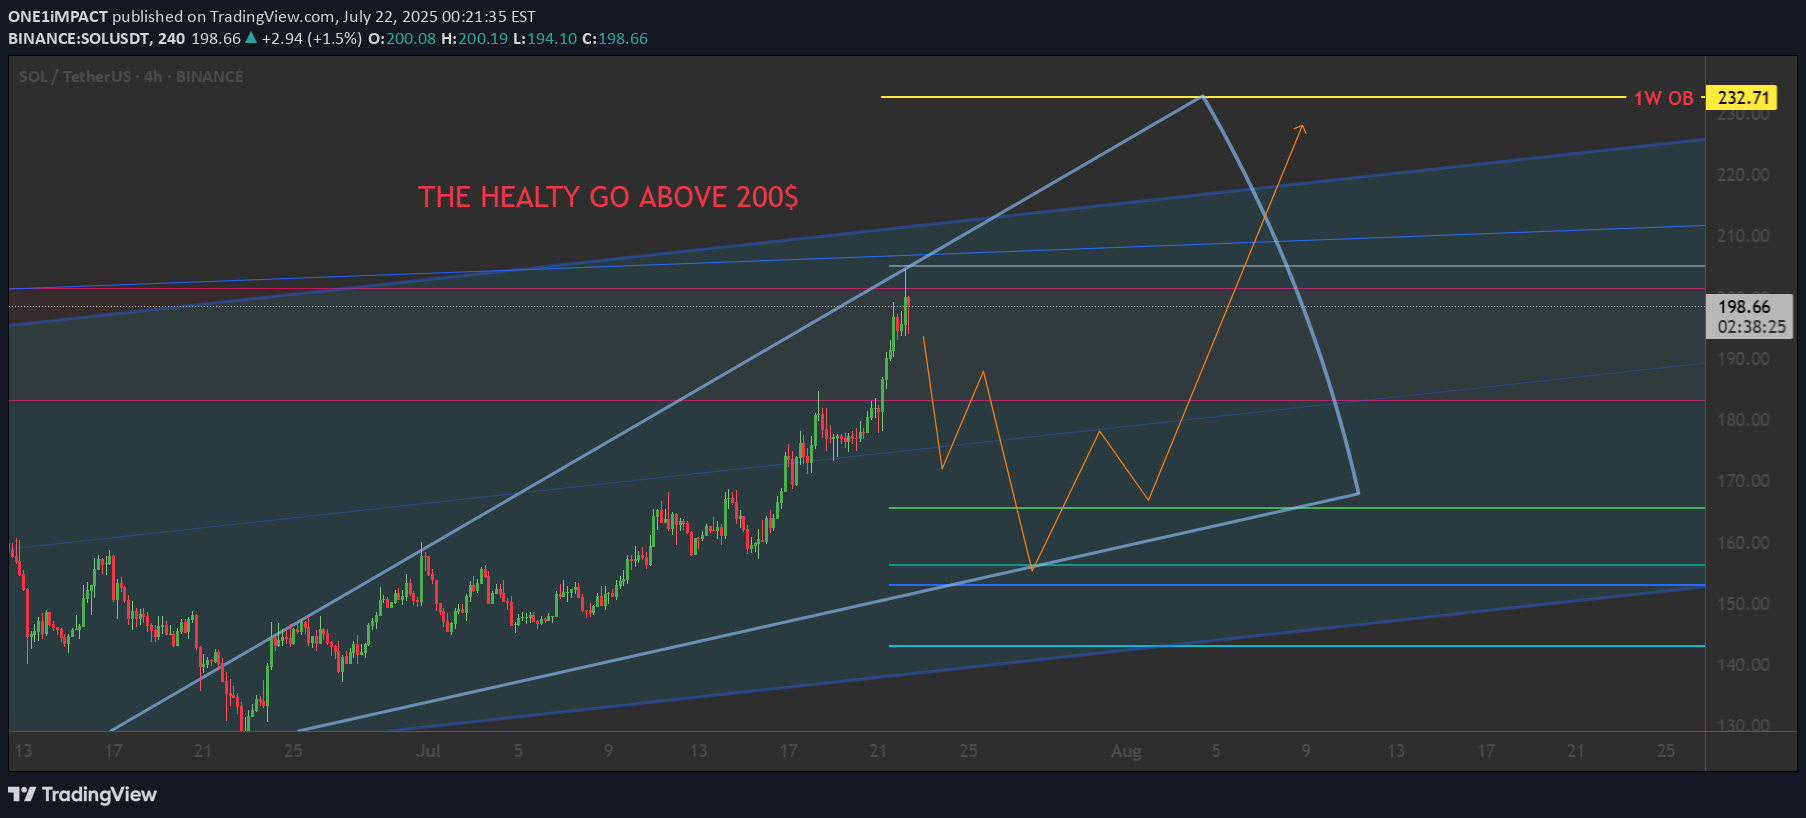
📊 THE TRADING PLAYBOOK 🛡️ CONSERVATIVE SUPPORT PLAY Setup: Buy at Fibonacci support levels🚨 Entry: $158-$165 (0.618-0.5 zone) 🌟 Stop: $140 (Below all major support) ❌ Target: Tp1 : $200(25% gain) 💰 Tp2 : $232 (40% gain) 💰 ⚡ Position Size: 3-5% of portfolio ⚡ Time Horizon: 3-6 weeks 🎯 ______ NOTE _______ DYOR ⚠️ Not financial advice. This analysis is for educational purposes only. Always do your own research and never risk more than you can afford to lose. #SOLANA #SOL #SymmetricalTriangle #Fibonacci #Breakout #Crypto #TechnicalAnalysis #AltSeason #DeFi #MemeCoins #TradingSetupactived nowclose it at 206$.... maybe it will go back to 167 if not wait it in 125 ..
ONE1iMPACT
PENGU/USDT: THE ULTIMATE FIBONACCI RETRACEMENT PLAY
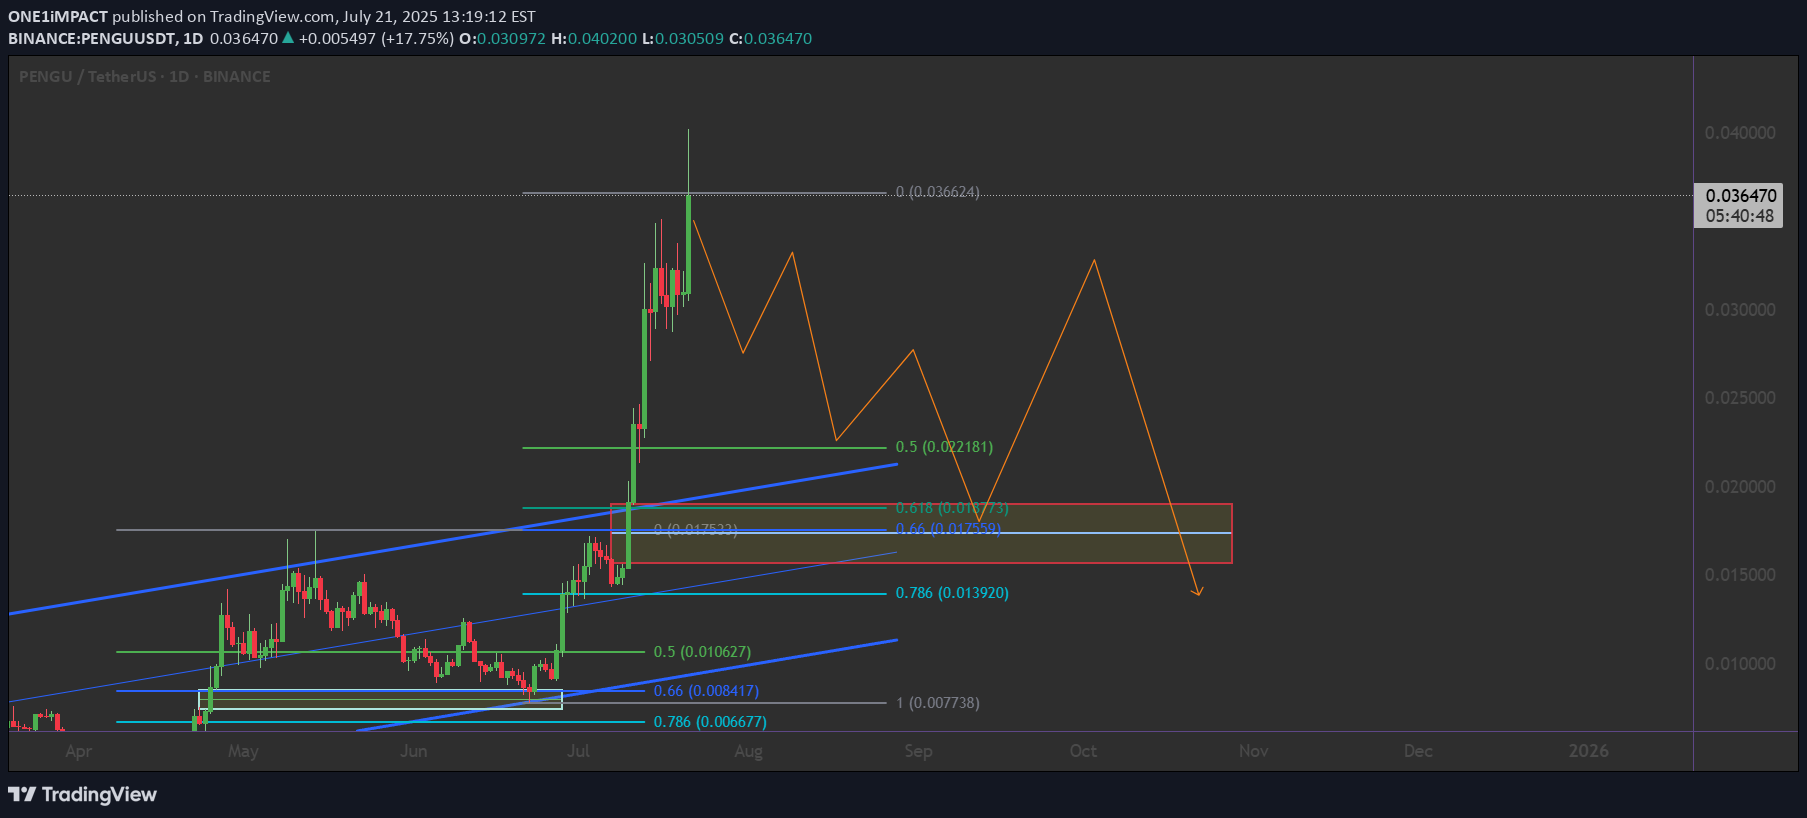
💎 THE GOLDEN SETUP: 5-Point Technical Confluence 1️⃣ FIBONACCI MASTERCLASS IN ACTION 0.5 Fib Level: $0.021181 (HELD PERFECTLY) ✅ 0.618 Golden Ratio: $0.017920 (Strong Support Zone) 0.786 Deep Retracement: $0.013920 (Ultimate Backstop) Current Position: Trading above 0.5 Fib = BULLISH CONTROL __________________ ❌ BEARISH Break below $0.029 (Channel support) Failure to hold 0.5 Fib level ($0.021) Volume declining on any pullback
ONE1iMPACT
WIF: The Perfect Storm Setup - Ascending Triangle Breakout
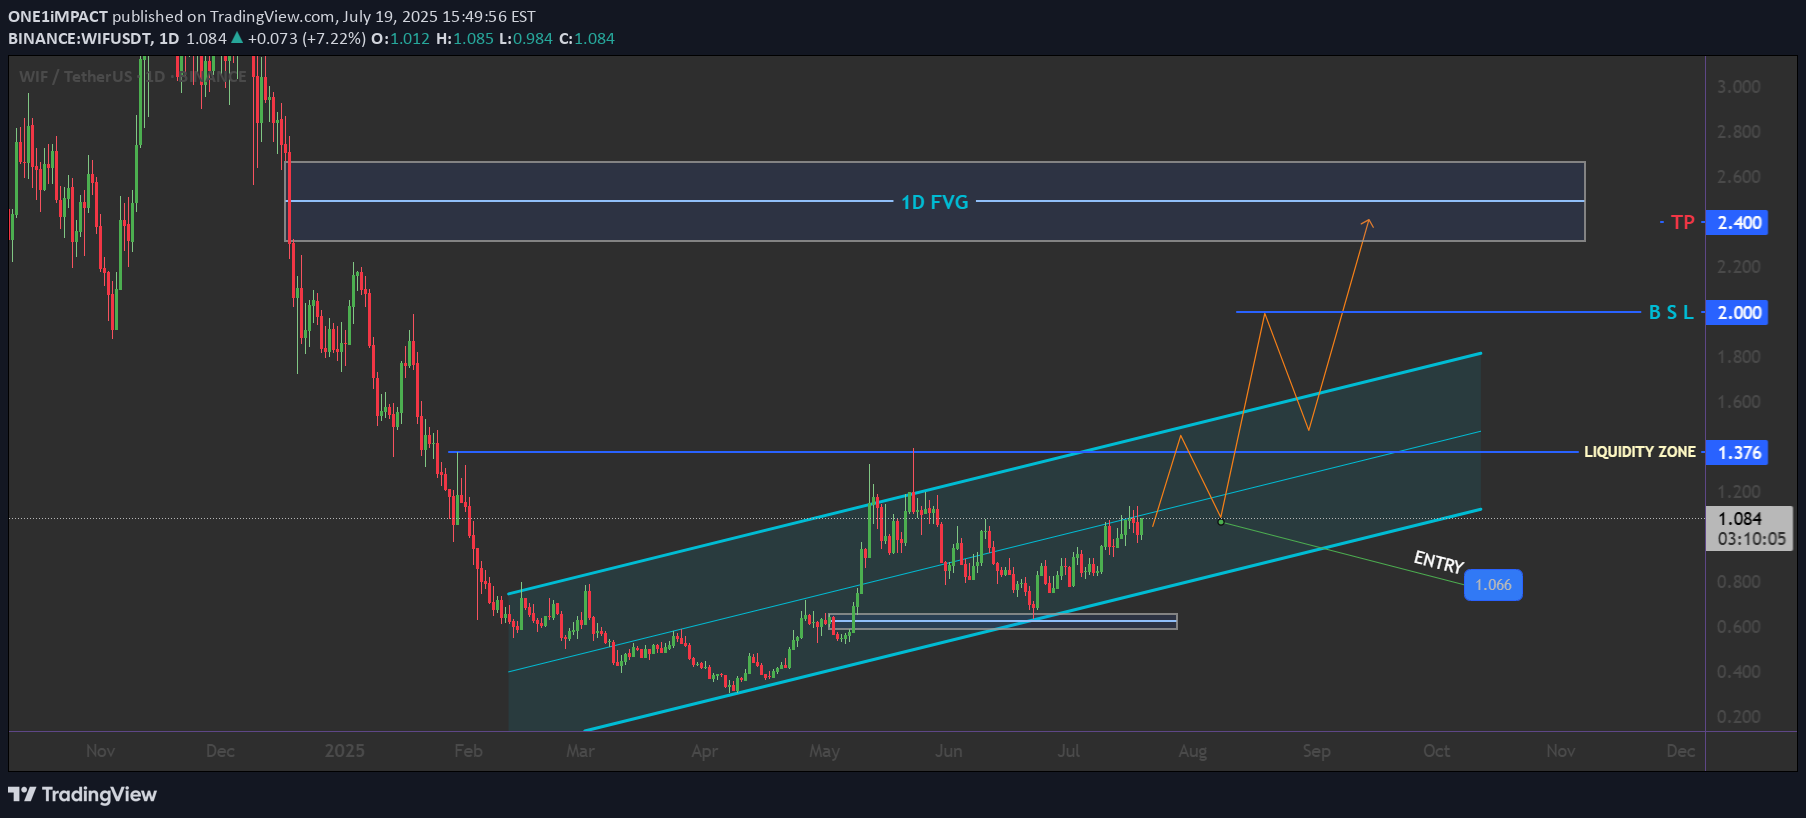
📐 Perfect geometric pattern formation 📊 Volume profile supporting the setup 🎯 Clear target zones with minimal resistance ⚡ Compression leading to expansion 🎯 THE SETUP: Triple Confluence Strategy 🔥 📍 ENTRY ZONE: $1.00 - $1.06 🎯 TARGET 1: $2.000 (+85%) 🎯 TARGET 2: $2.400 (+120%) 🔴 STOP LOSS: $0.95 (-3%) ___________ NOTE ____________ 🚨 RISK MANAGEMENT 🚨 DYOR
ONE1iMPACT
GOLD: Bullish Reversal Pattern Activated! 21/07/2025
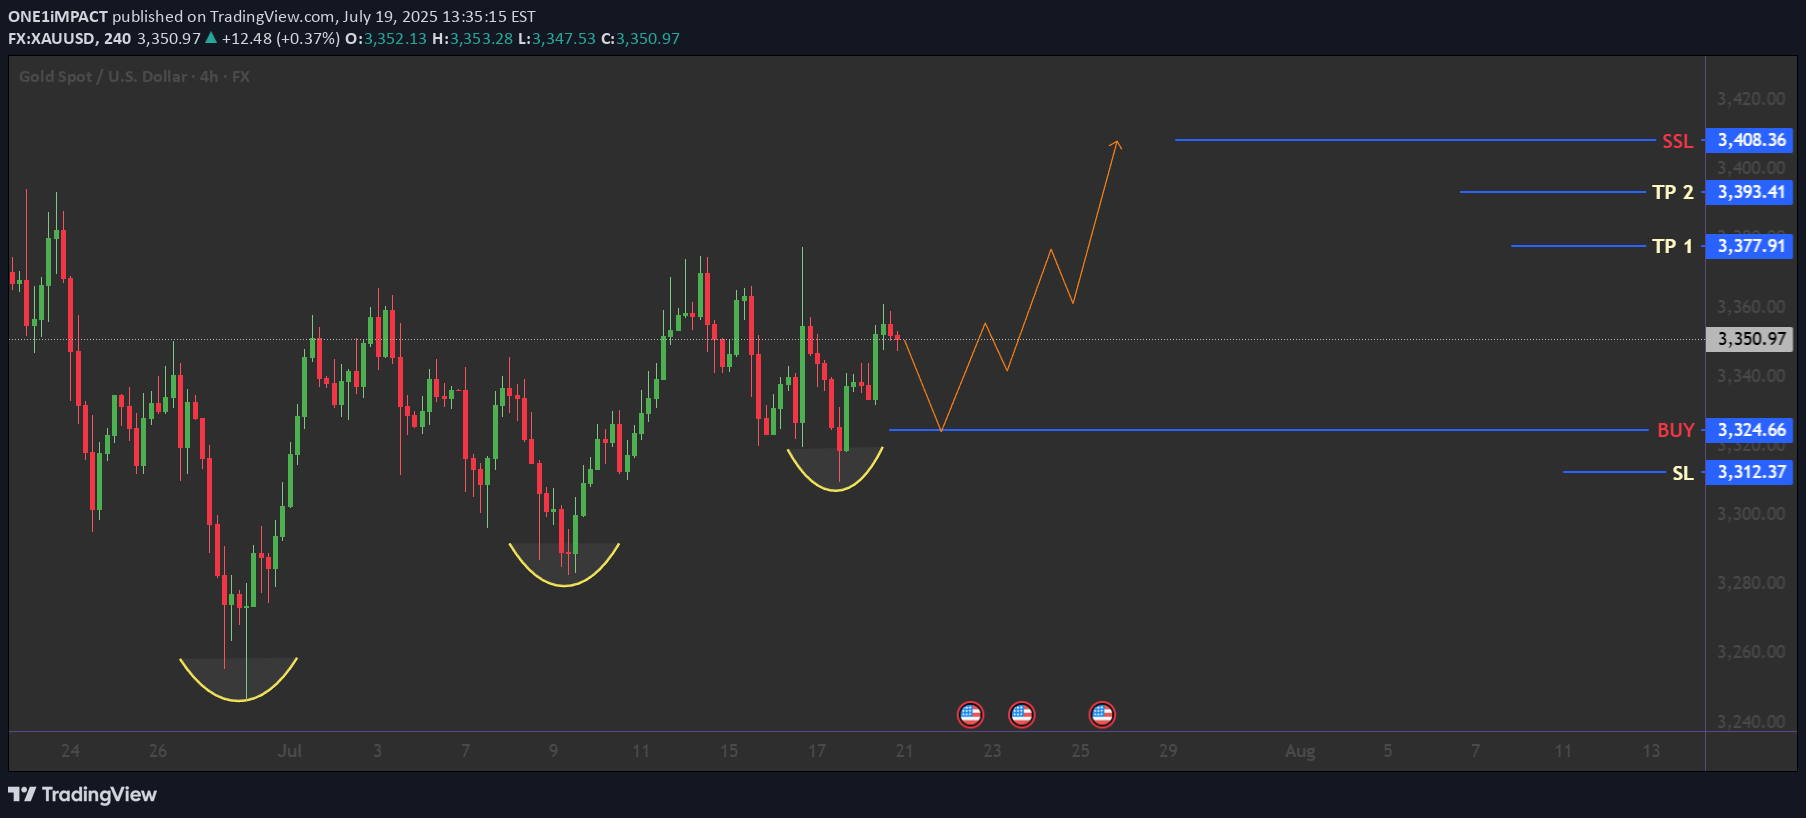
THE GOLDEN SETUP: Triple Bottom Masterpiece : 🟢 BULLISH BREAKOUT SETUP 🎯 BUY ZONE: $3,324 (Neckline Break) 🚀 TP1: $3,377 🚀 TP2: $3,393 🚀 LAST TP : $3,408 Stop Loss: $3,312 (Below recent low) 🚨 🌟 Before You Trade: ✅Wait for neckline break ($3,325+)🔥 ✅Confirm with volume surge ✅Set stop loss below pattern ($3,312) ✅Calculate position size (max 2% risk) --------------- N O T E ---------------- 🚨 RISK MANAGEMENT 💡DYOR Follow for more high-probability setups! 📊✨
Disclaimer
Any content and materials included in Sahmeto's website and official communication channels are a compilation of personal opinions and analyses and are not binding. They do not constitute any recommendation for buying, selling, entering or exiting the stock market and cryptocurrency market. Also, all news and analyses included in the website and channels are merely republished information from official and unofficial domestic and foreign sources, and it is obvious that users of the said content are responsible for following up and ensuring the authenticity and accuracy of the materials. Therefore, while disclaiming responsibility, it is declared that the responsibility for any decision-making, action, and potential profit and loss in the capital market and cryptocurrency market lies with the trader.