
quantsignals
@t_quantsignals

What symbols does the trader recommend buying?
Purchase History
پیام های تریدر
Filter
quantsignals
پیشبینی صعودی گوگل (GOOGL): سطوح ورود کلیدی برای تریدهای کوتاهمدت
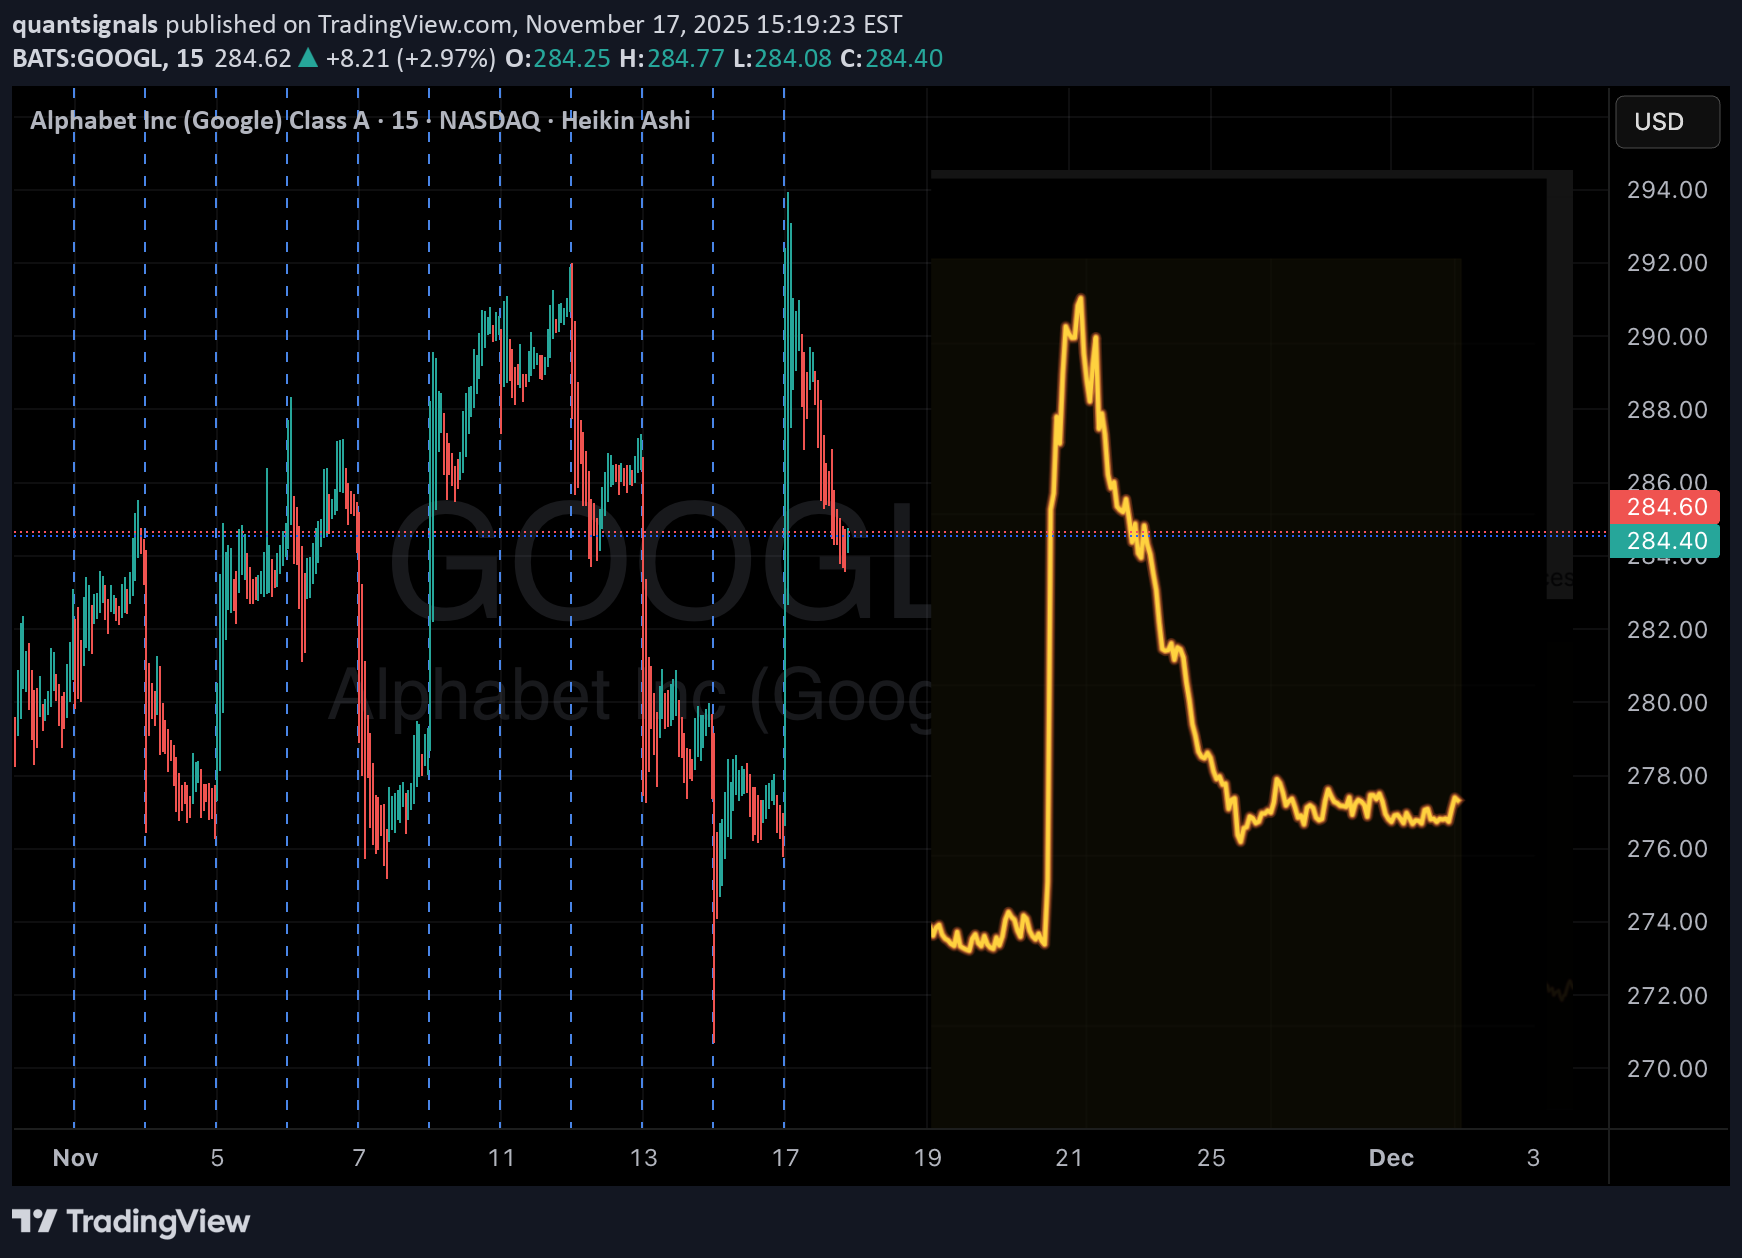
Ticker: GOOGL Date: 2025-11-17 Trend: BULLISH Confidence: 64.5% – 69.8% Volatility: 14.4% – 38.3% Trade Signal #1 Direction: LONG Entry: $286.07 Target: $287.63 Stop Loss: $281.78 Expected Move: +0.68% Trade Signal #2 Direction: LONG Entry: $284.14 Target: $287.47 Stop Loss: $279.88 Expected Move: +1.47% Analysis Summary: Katy AI shows bullish trend on both signals with moderate confidence. Short-term 30-min targets show minor intraday pullbacks ($285.71 / $286.90) before continuation. Volatility ranges from 14.4% – 38.3%, indicating potential for intraday swings. Suggested risk management: maintain small position size, monitor stop-loss closely. Key Notes: Both signals indicate gradual upward momentum with modest upside. Optimal for traders looking for short-term long exposure in alignment with AI trend. Watch for intraday reversals; stop-loss levels provide key exit points.
quantsignals
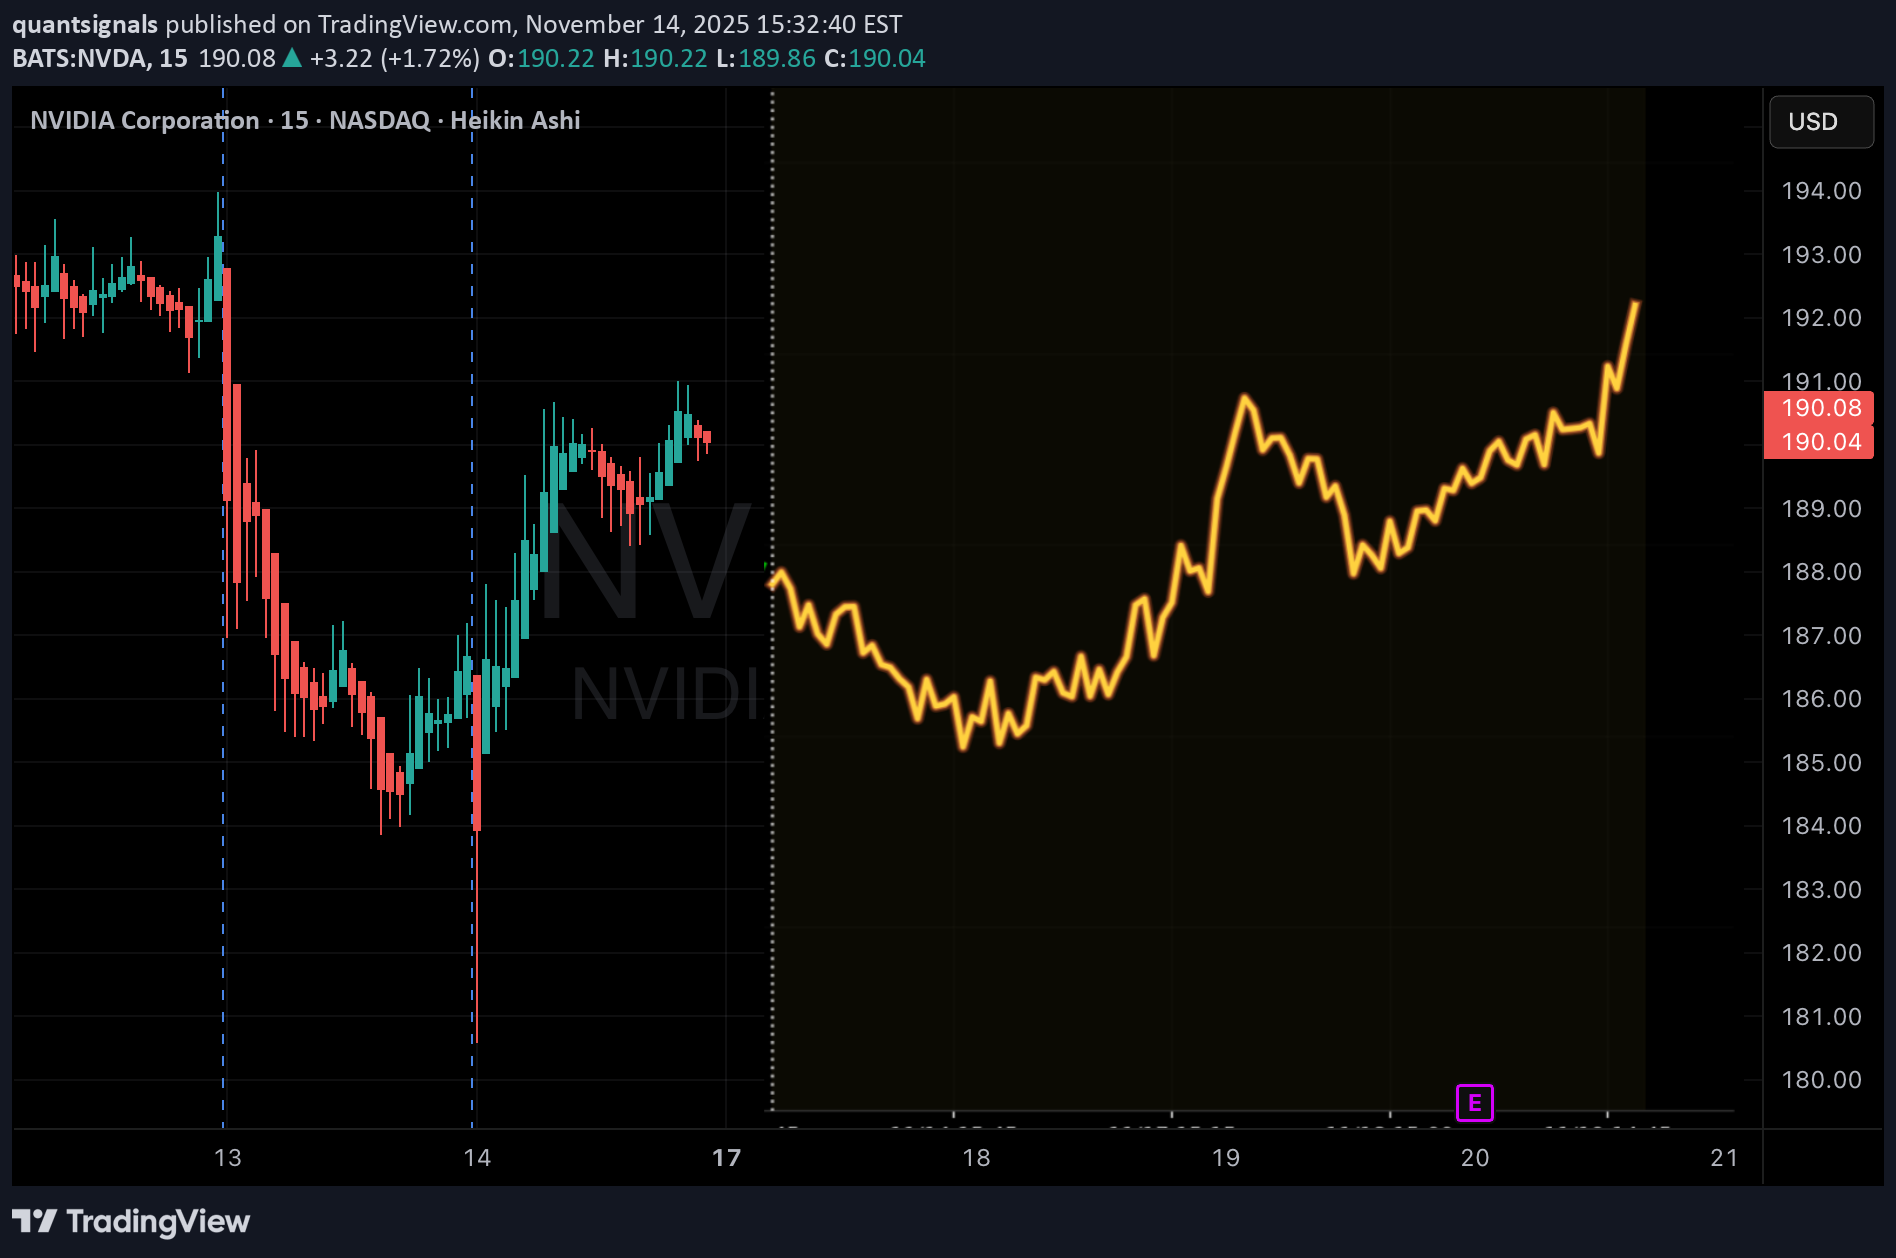
سیگنال فروش پنهان برای انویدیا (NVDA): آیا خریداران کم آوردند؟
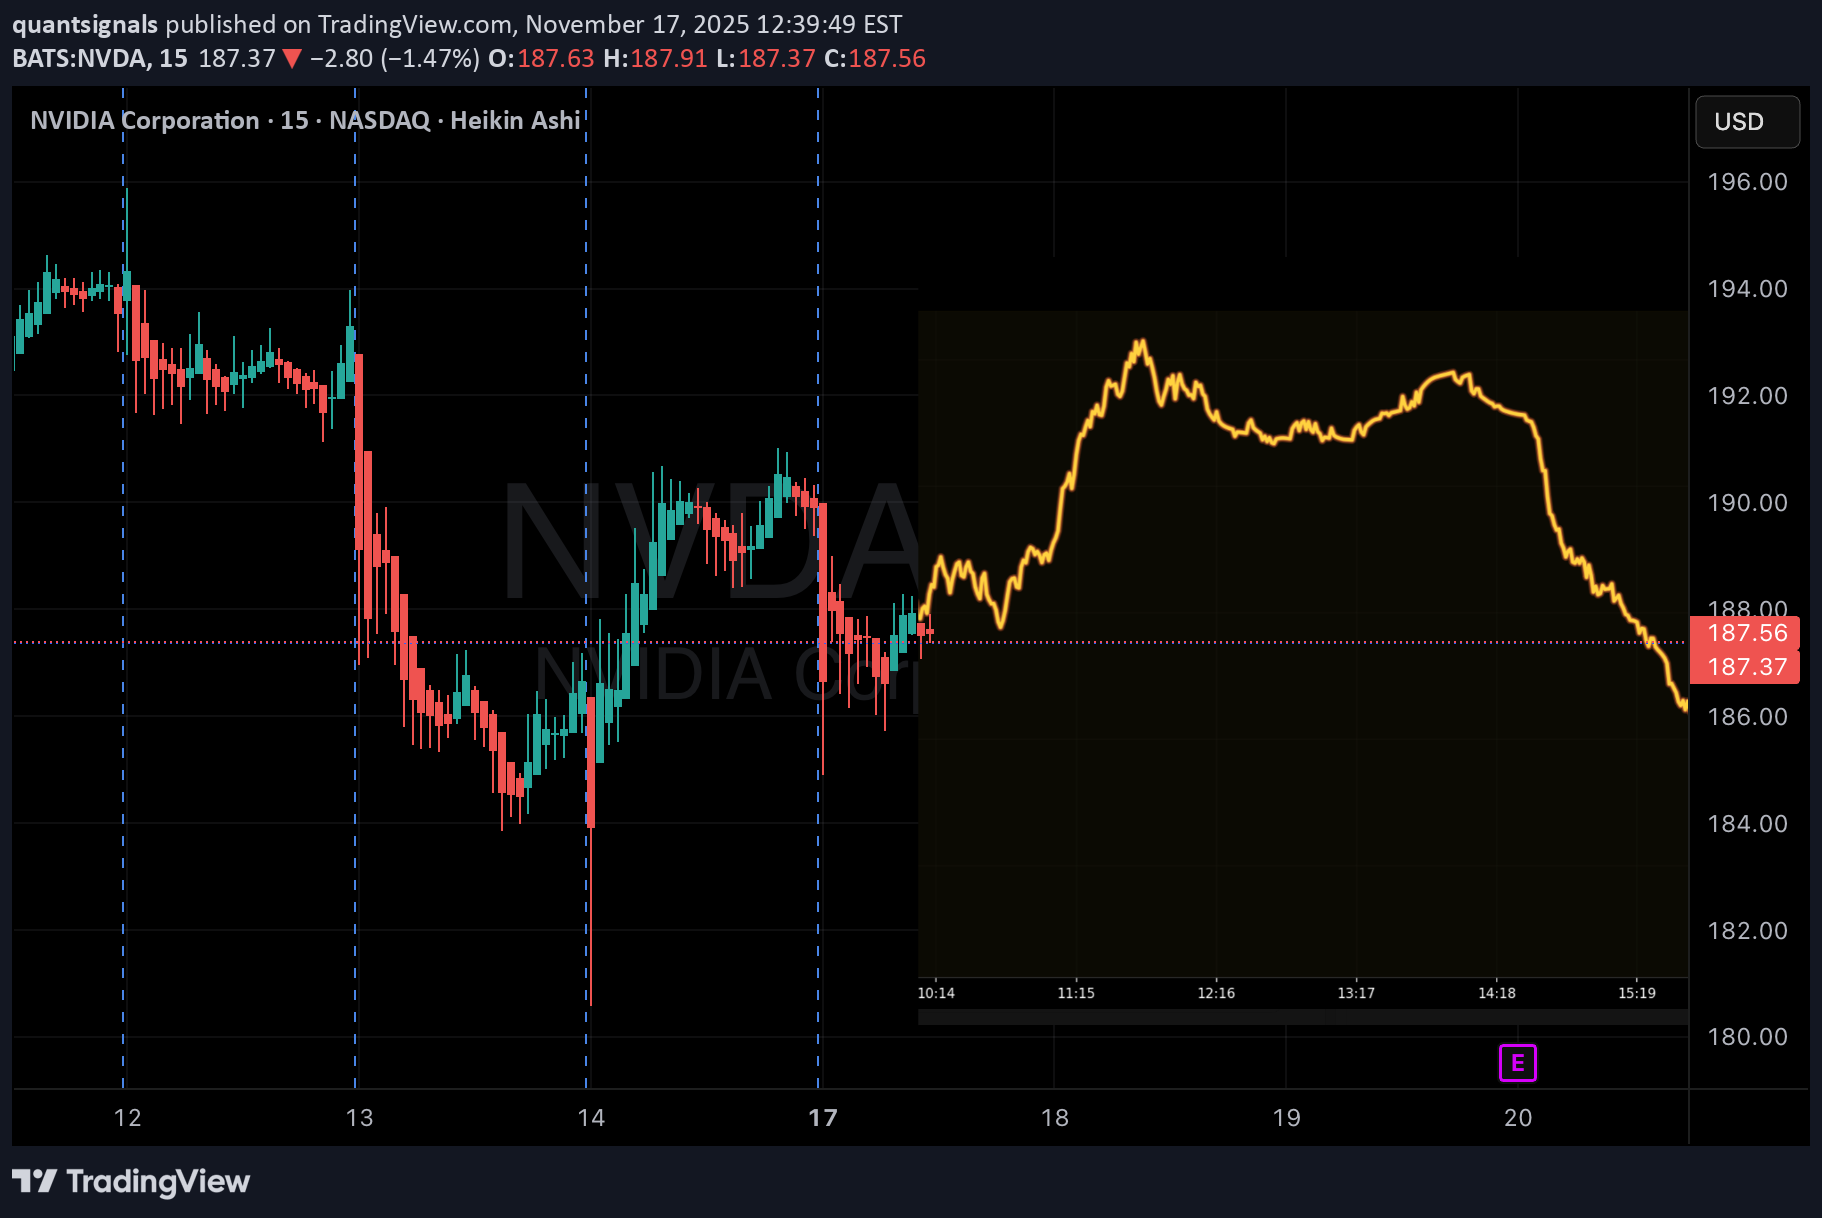
NVDA (QuantSignals V3) Market Structure: NVDA is showing neutral-to-weak momentum with price hovering near short-term resistance at $189–190. Buyers are losing strength, and the tape shows lower high formations, signaling potential exhaustion. Trend Outlook: The Katy 1M model flags soft downside pressure. Despite the neutral trend reading, intraday structure leans toward a controlled pullback, supported by moderate volatility (16.5%). Order Flow Insight: Momentum flow appears to be slowing, with reduced upward volume. The micro-trend suggests fade-the-rip behavior—small rallies may get sold into. Key Levels: Resistance: $189.40 / $191.70 Support: $188.00 / $186.80 Short Trigger Zone: $188.50–$189.00 Vision Summary: NVDA shows lower momentum, weak buyer conviction, and a short-biased micro-shift. Best setup aligns with a tight short scalp targeting the next liquidity pocket below $188.00.
quantsignals
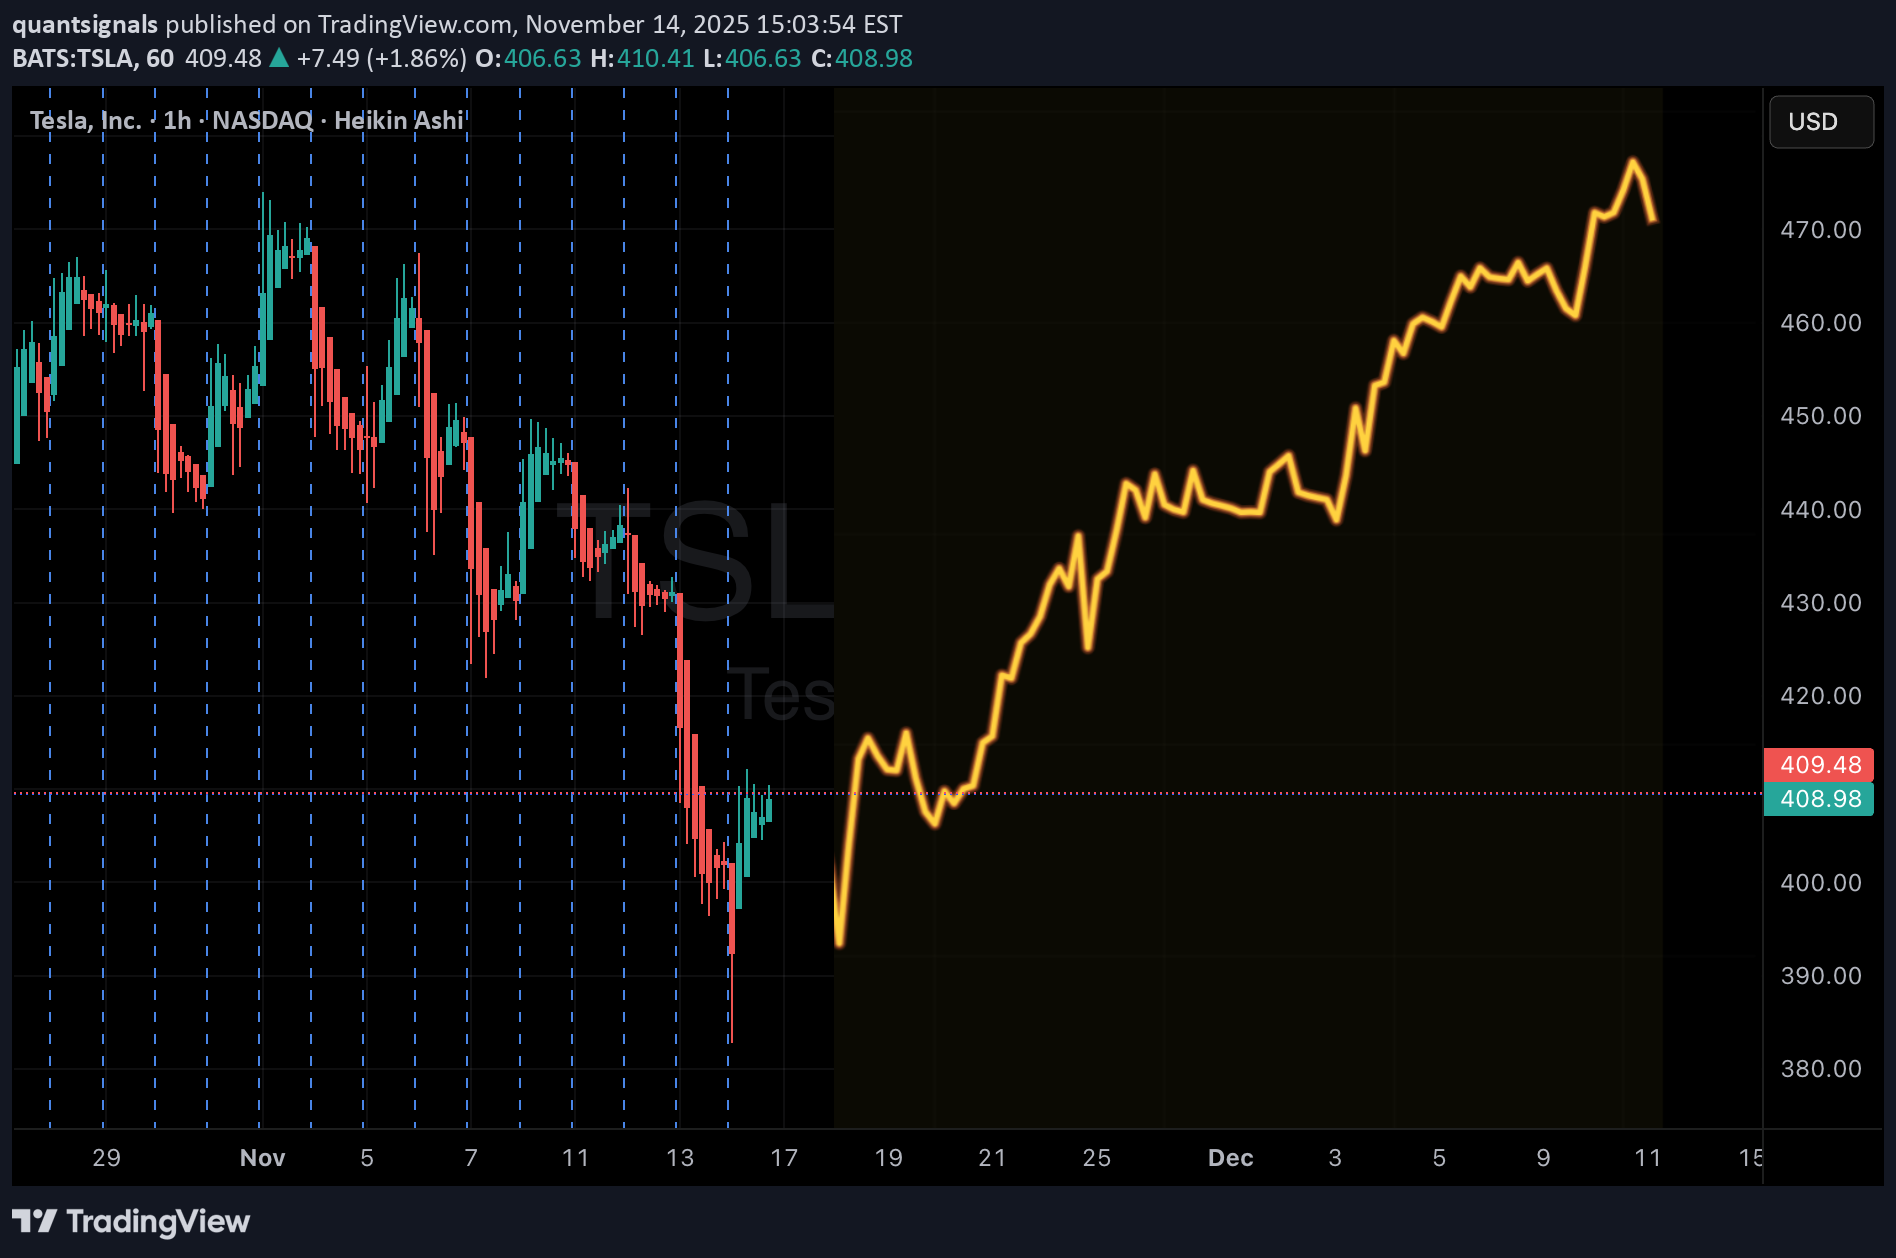
پیشبینی سقوط تسلا (TSLA) تا ۴۰۳ دلار: سیگنالهای کمی پیشرفته چه میگویند؟
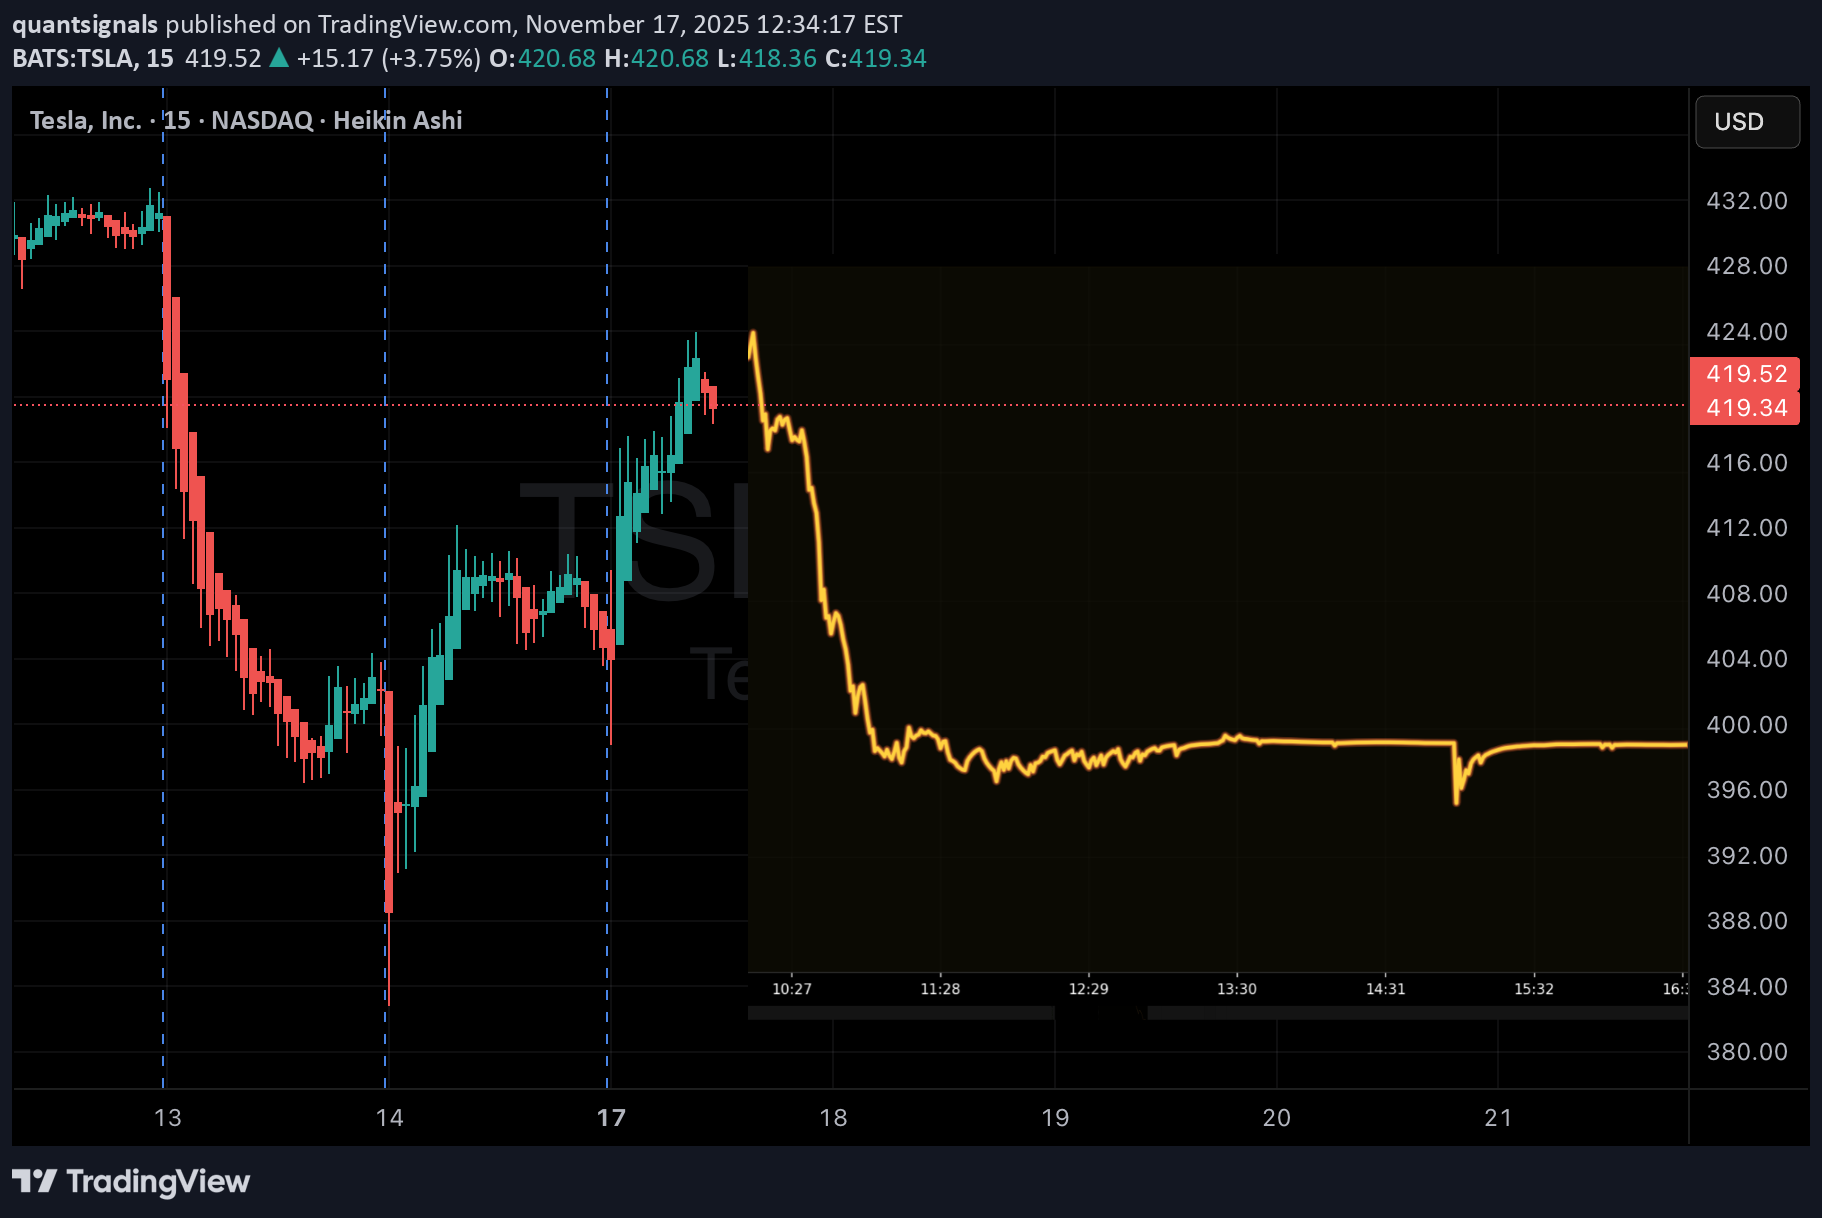
TSLA QuantSignals Katy 1M Prediction 2025-11-17 Symbol: TSLA Price: 415.30 Model: Katy AI — 1M Prediction Trend: Bearish Confidence: 75% 🔮 Vision Summary TSLA shows a bearish short-term structure, with the model forecasting a move toward 403.52 (-2.84%). Momentum is shifting lower, and volatility remains moderate at 20%, supporting a gradual downside drift rather than a sharp drop. Near-term projection points to 411.47 within the next 30 minutes as price weakens into lower support zones. 📉 Key Levels Entry Zone: 415.30 Downside Target: 405.87 – 403.52 Resistance / Invalidation: 421.53 🧭 Vision Bias Bearish — Model anticipates sustained downside pressure as TSLA fails to reclaim short-term resistance. Break above 421.53 invalidates the bearish thesis.
quantsignals
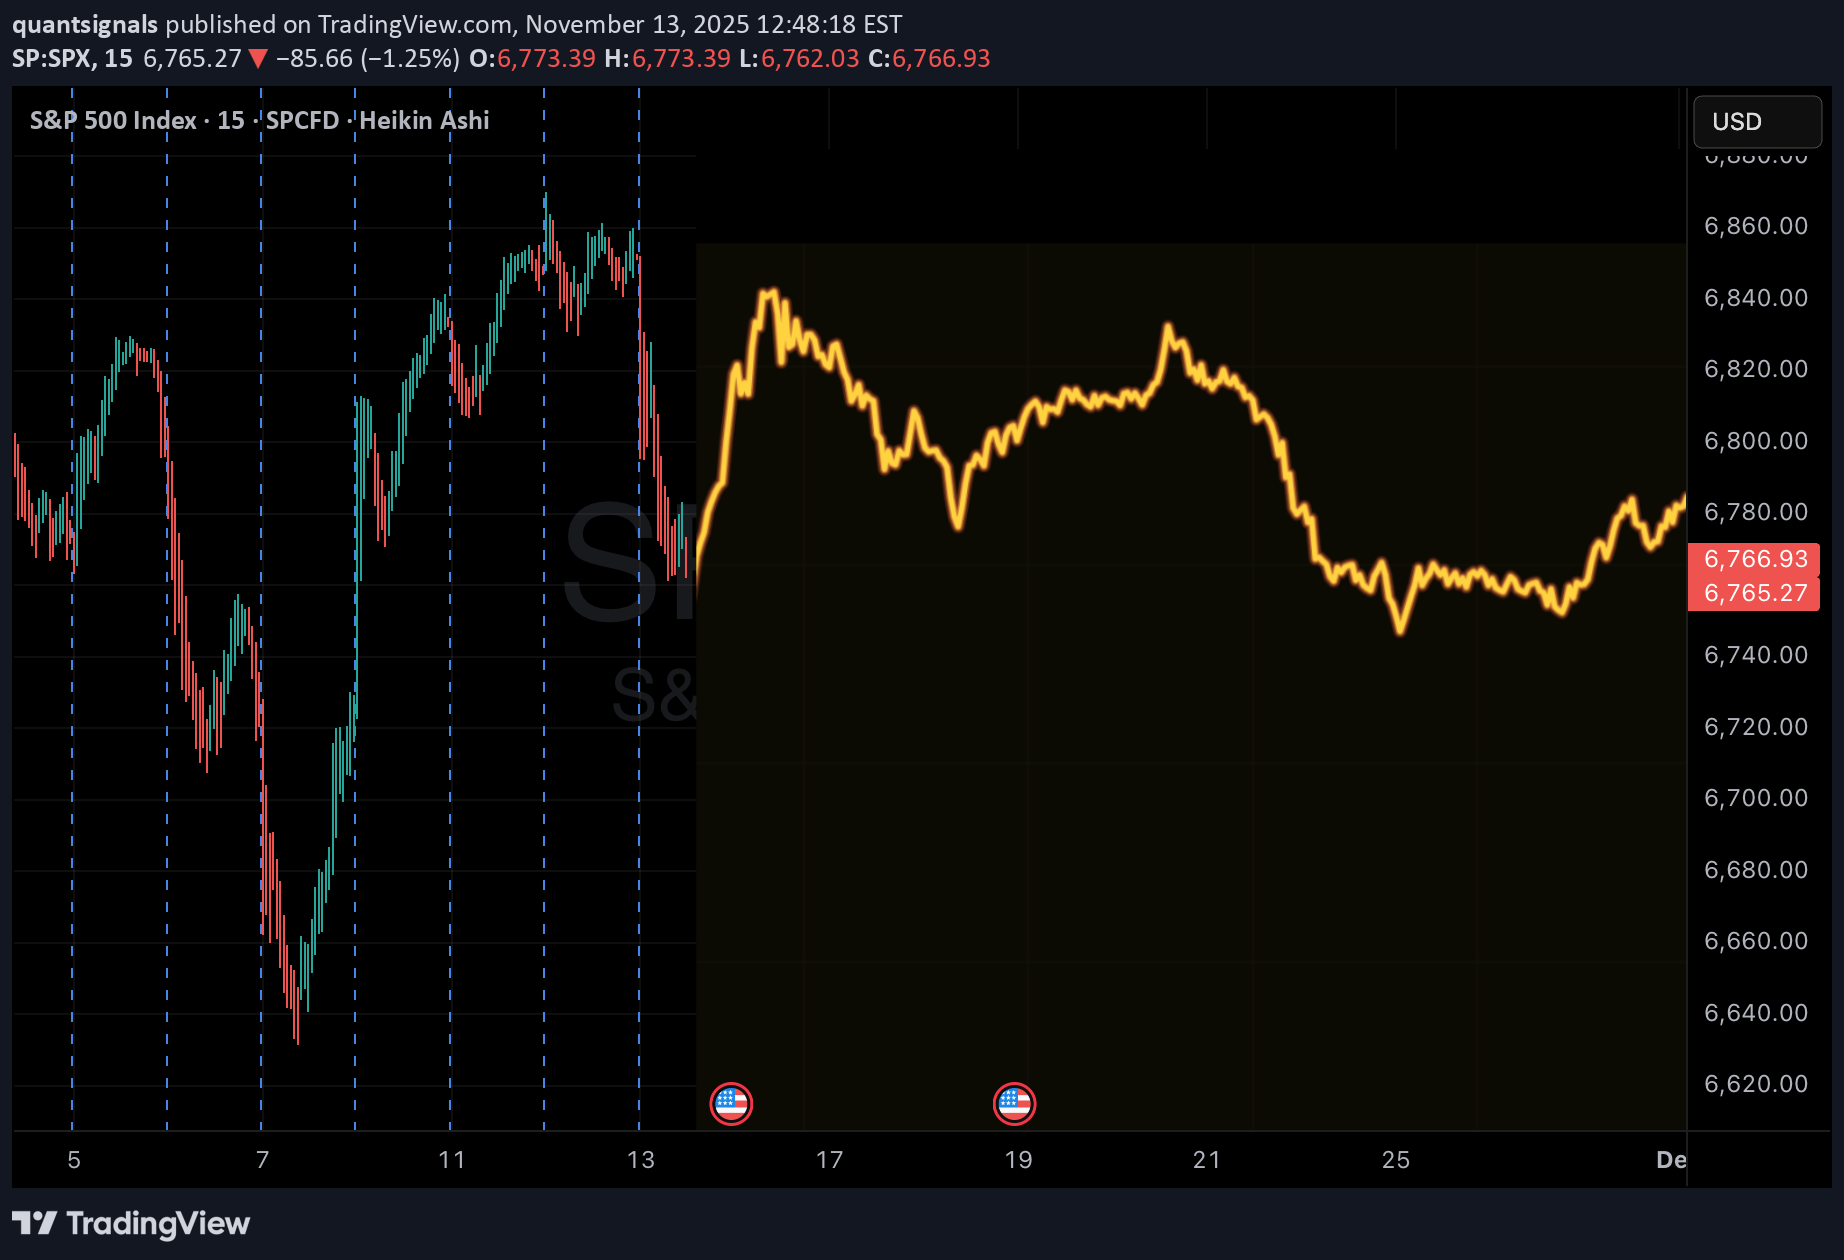
پیشبینی صعودی قوی برای شاخص SPX: رسیدن به ۶۷۵۳ با هوش مصنوعی کتی!
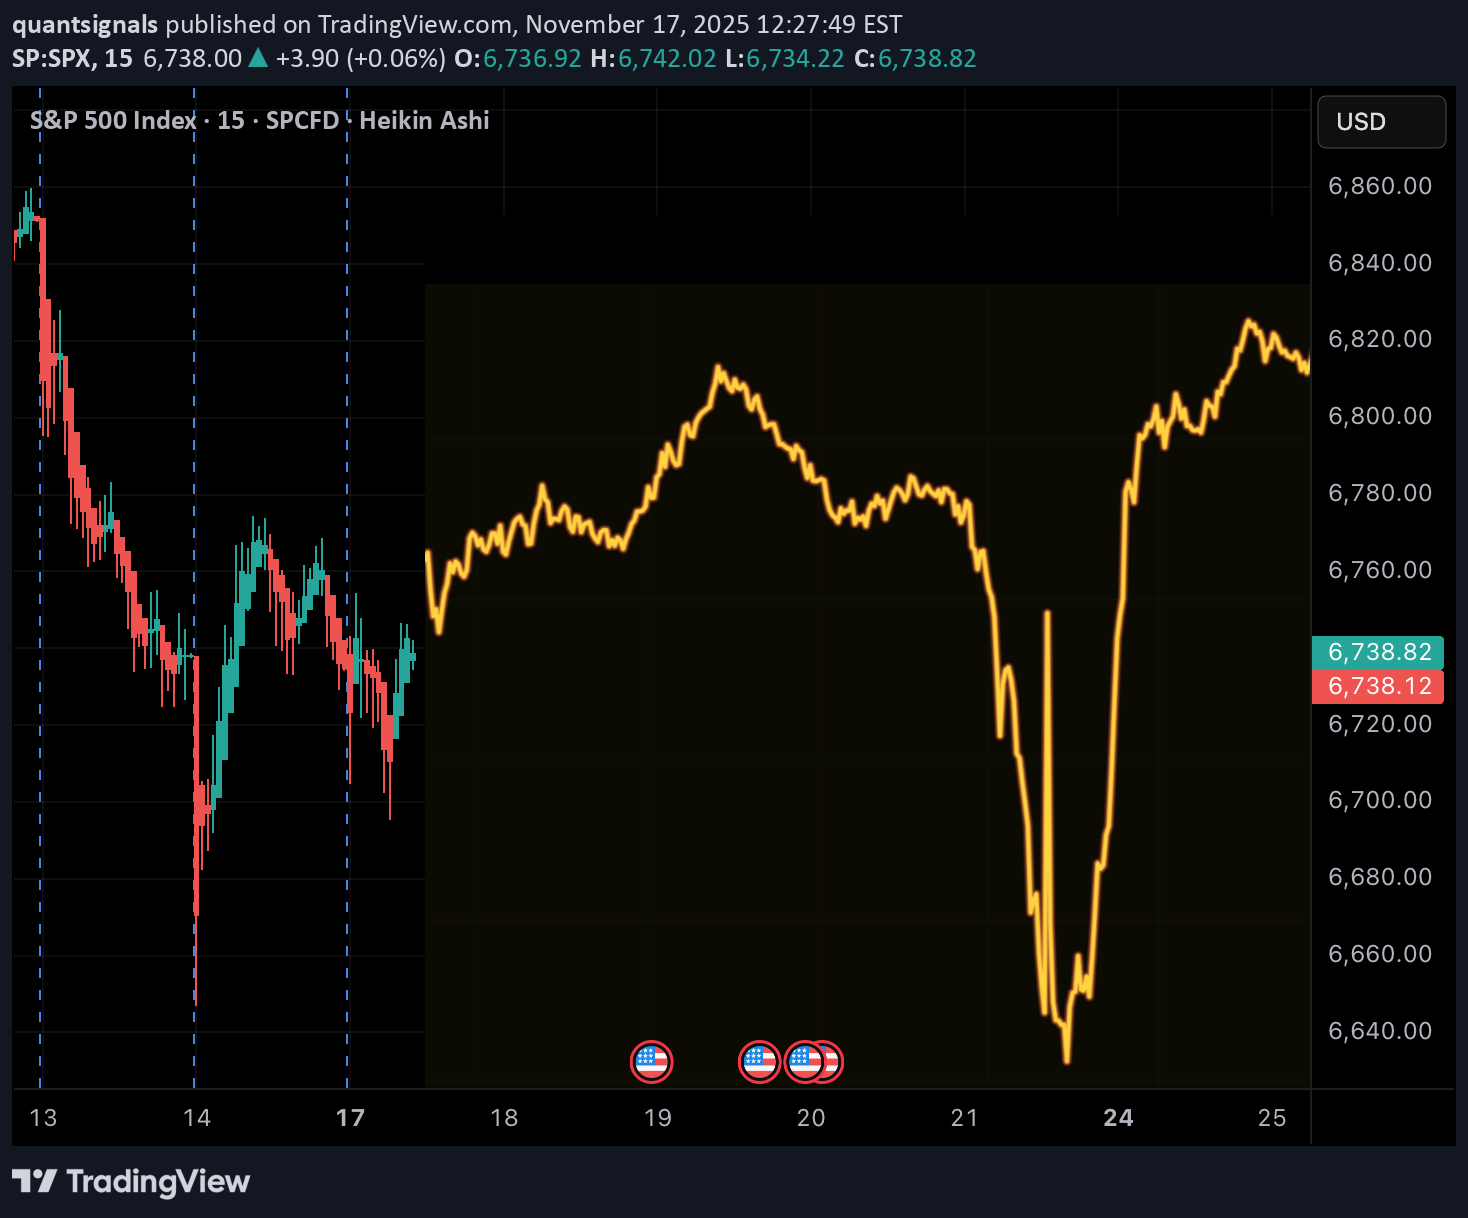
SPX QuantSignals Katy 1M Prediction 2025-11-17 Symbol: SPX Price: 6706.78 Model: Katy AI 1M Prediction Trend: Bullish Confidence: 64.6% 🔮 Vision Summary SPX maintains a bullish short-term structure, with the model projecting a move toward 6753.08 (+0.69%). Momentum remains positive as long as price holds above 6700, with 30-minute targets signaling continued upward drift toward 6730.49. Volatility remains moderate (27.3%), supporting steady trend continuation rather than sharp mean-reversion. 📈 Key Levels Entry Zone: 6706.78 Upside Target: 6743.82 – 6753.08 Support / Invalidation: 6606.18 🧭 Vision Bias Bullish — Model indicates upward continuation with controlled volatility and stable trend strength. Break below 6700 weakens the signal; break below 6606 invalidates the forecast.
quantsignals
تحلیل هفتگی NVDA: صعود با تکیه بر هوش مصنوعی و جریان سرمایهگذاری نهادی!
🧭 Overview Ticker: NVDA Current Price (Entry): $187.50 Trend: Bullish (Analyst + AI recovery) Expiry: 2025-11-21 (7D) Strike: $187.50 (ATM, Delta 0.521) Position Size: 4% of portfolio 📊 AI & Technical Forecast Katy AI Target: Recovery sequence $185 → $190, timing for momentum reversal Analyst Price Target: $250 PCR / Flow Intel: 0.33 → bullish institutional positioning RSI: 80.9 → overbought, expect short-term dip before upward move VIX: 19.84 → favorable volatility entry before expansion Insights: Friday entry captures weekend theta premium Light weekly volume (0.6x) → monitor for institutional confirmation Dip to $185.50 may provide optimal entry for maximum upside 🎯 Trade Setup ParameterValue DirectionCALL Strike$187.50 Entry$7.50 Target 1$12.00 (+60%) Target 2$15.00 (+100%) Stop Loss$4.50 (–40%) Expiry2025-11-21 Position Size4% portfolio Confidence60% ⚡ Key Advantages ATM call → balanced risk/reward vs OTM alternatives Tight stop aligns with AI critical support at $184.44 Institutional bullish flow + AI recovery pattern → asymmetric reward potential Timing advantage: Monday-Tuesday momentum reversal 🚨 Risk Notes Low AI confidence (50%) → disciplined sizing required Overbought RSI → short-term upside may be capped Rising VIX → daily premium decay risk, consider scaling entry Avoid holding past Wednesday if Target 1 isn’t reached Summary NVDA presents a medium-conviction weekly call leveraging AI recovery trajectory, institutional flow, and analyst support. Ideal for disciplined traders seeking timed momentum entry into a 7-day horizon.
quantsignals
سیگنال انفجاری تسلا: خرید کال عمیق با بازدهی بالا (هفتگی)
TSLA QuantSignals V3 Weekly 2025-11-14 AI & Technical Forecast Katy AI Target: $421.69 (+3.2% upside) Expected Dip: $390.59 Monday before mid-week recovery Momentum: Strong weekly uptrend, MACD bullish, EMA alignment confirms uptrend Support: $402.40 Resistance / AI Target: $421.69 Insights: Friday expiration entry offers volatility discount; deep ITM call captures most delta with minimal extrinsic loss PCR 3.30 → institutional put-heavy positioning, creating potential contrarian opportunity Event Risk: Elon Musk fireside chat (Friday 1:05 PM ET) may spike volatility 🎯 Trade Setup ParameterValue DirectionCALL Strike$370.00 Entry$40.30–$40.55 (mid: $40.42) Target 1$46.00 (+13.8%) Target 2$52.00 (+28.6%) Stop Loss$35.05 (–13.3%) Position Size2–3% of portfolio ⚡ Key Advantages Deep ITM structure → high delta exposure (stock-like behavior) Limited extrinsic value → reduces theta and IV crush risk Timing aligned with post-event momentum and mid-week recovery Risk/Reward ~2.15:1 (Target 1 vs stop) 🚨 Risk Notes PCR 3.30 → extreme hedging/fear; stop may trigger quickly Theta decay accelerates Mon-Wed; manage positions carefully Deep ITM calls → wider spreads; use limit orders Consider scaling out at Target 1 to reduce gamma exposure Summary: TSLA deep ITM weekly call provides contrarian, medium-conviction bullish exposure, leveraging AI trajectory and technical alignment. Suitable for 7-day horizon with disciplined risk management.
quantsignals
سیگنال فوری: هشدار پوزیشن فروش قوی (PUT) در SPX با اعتماد ۷۲٪ – آیا ریزش ادامه دارد؟
SPX 0DTE Signal | 2025-11-13 Market Context: SPX faces heavy selling pressure after a -1.22% intraday drop, with RSI at an extreme 8.1 (oversold zone). Despite Katy AI’s neutral 50% confidence, momentum and sentiment indicate short-term downside continuation. AI Insight (QuantSignals V3): Confidence: 72% (Medium) Predicted Range: $6769 → $6667 (-1.5%) Gamma Risk: Low Flow Intel: Neutral Signal Type: 0DTE PUT Trade Setup: 🎯 Strike: 6770 PUT (Exp. 2025-11-13) 💵 Entry: $15.30 🎯 Target 1: $22.80 (+50%) 🎯 Target 2: $30.60 (+100%) 🛑 Stop Loss: $10.70 (-30%) 📏 Position Size: 2% (Low-Moderate Risk) 🕒 Exit By: 2:00 PM ET (Time Decay Risk) Technical Summary: EMA alignment: Bearish RSI: 8.1 (Extreme Oversold) MACD: -6.23 (Bearish) Support: $6667.58 (Katy stop) Resistance: $6869.91 (session high) Key Notes: ⚠️ Katy’s model predicts upside, but real-time technicals override AI summary. ⚡ Momentum + sentiment confirm short-term PUT bias. 📉 Use tight stop & scale profits fast — 0DTE = fast decay.
quantsignals
پیشبینی هوش مصنوعی برای تسلا (TSLA) تا سال 2025: آیا وقت فروش است؟
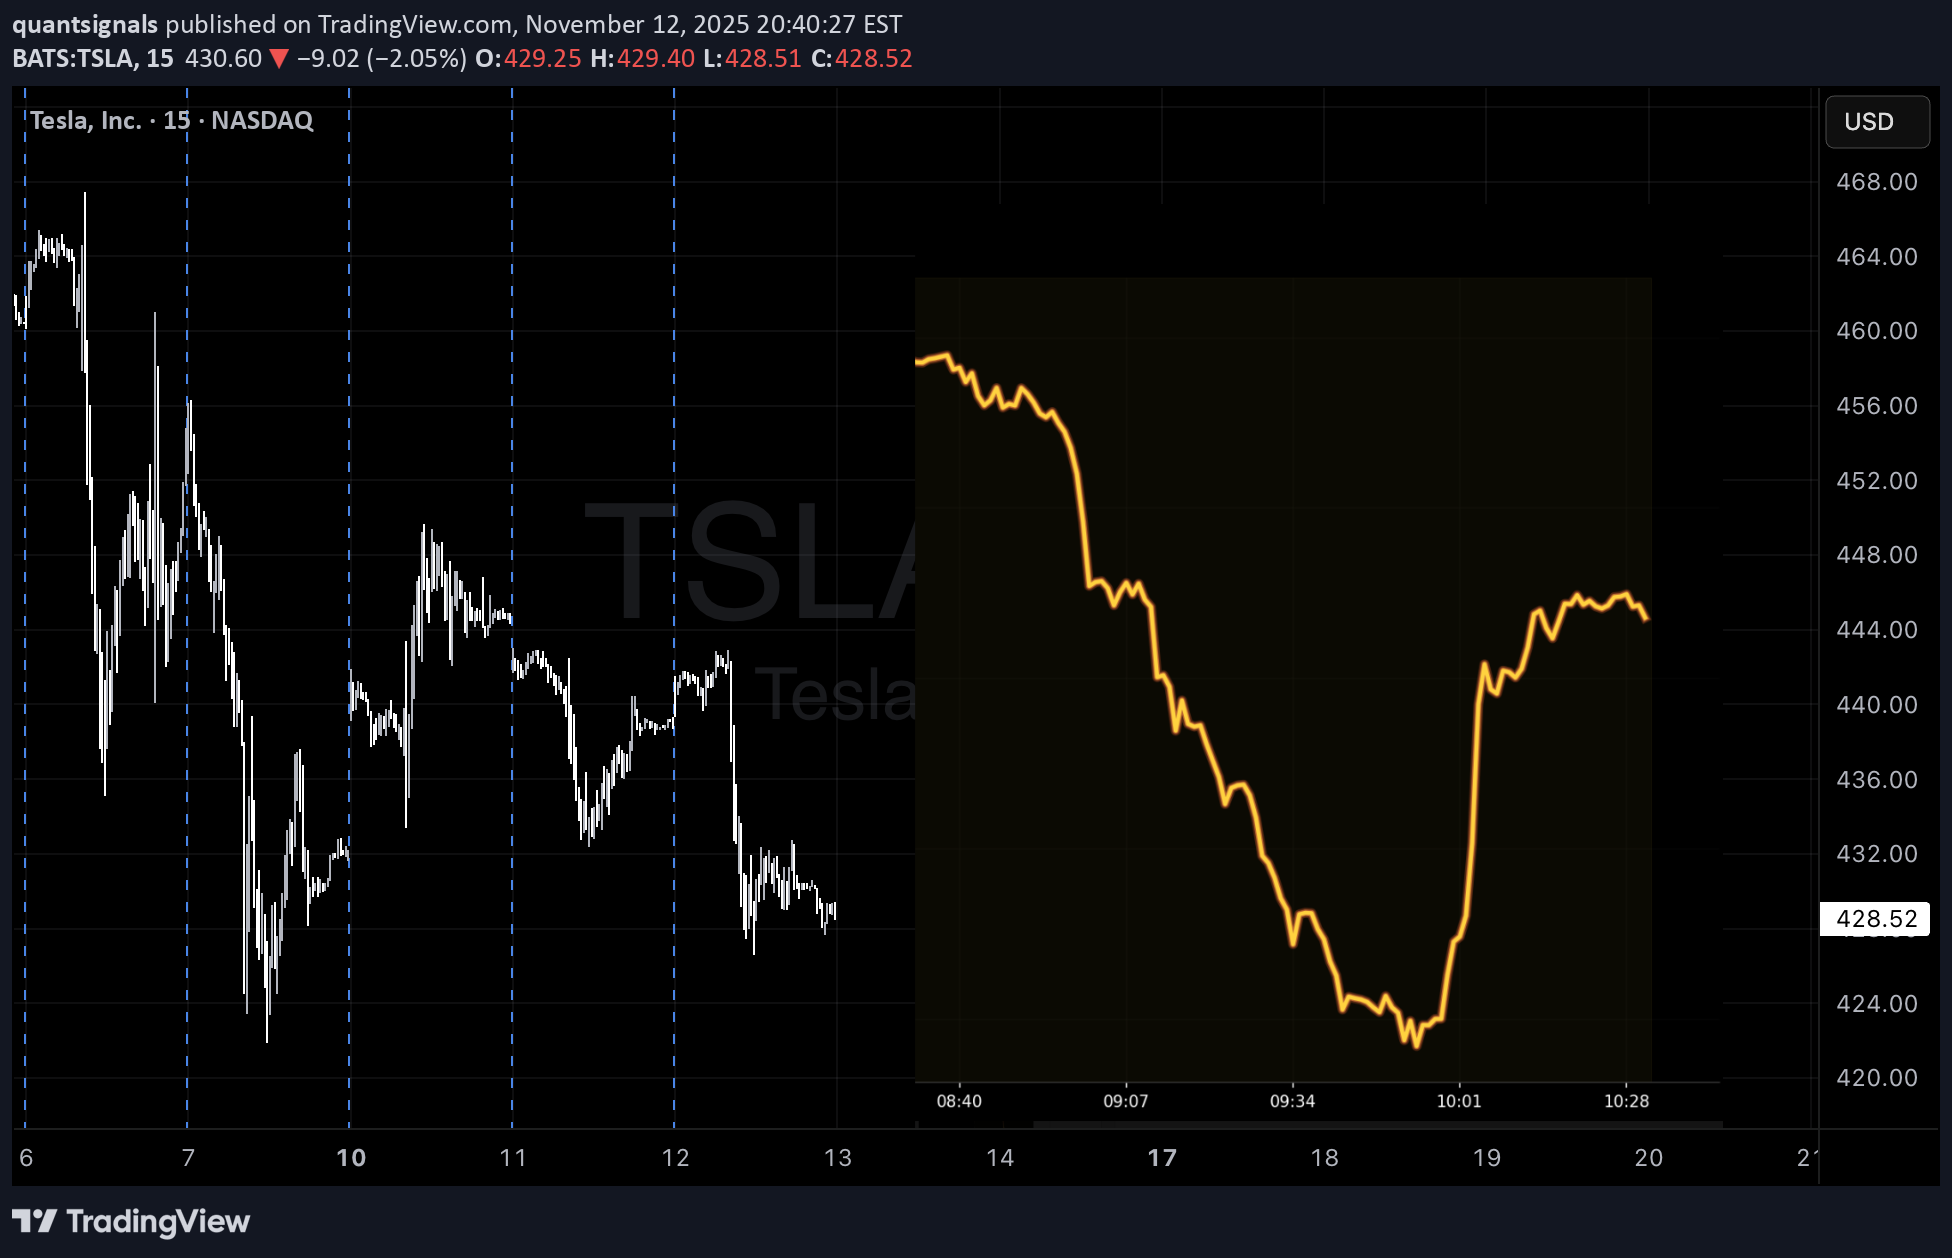
📊 TSLA 1M AI Prediction – 2025-11-12 Current Price: $442.35 Trend: Neutral Confidence: 55% Volatility: 14.7% Trade Signal: Direction: Short Entry Price: $442.35 Target: $440.50 (-0.52%) Stop Loss: $448.99 Expected Move: -0.52% 30min Target: $440.31 (-0.46%) Insight: Katy AI predicts a small downward move in the short term Low-moderate confidence; trade with proper risk management Market trend is neutral, so position sizing should remain cautious
quantsignals
تحلیل هفتگی آپشن NVDA: سیگنال انفجاری تماسها با ریسک کم!
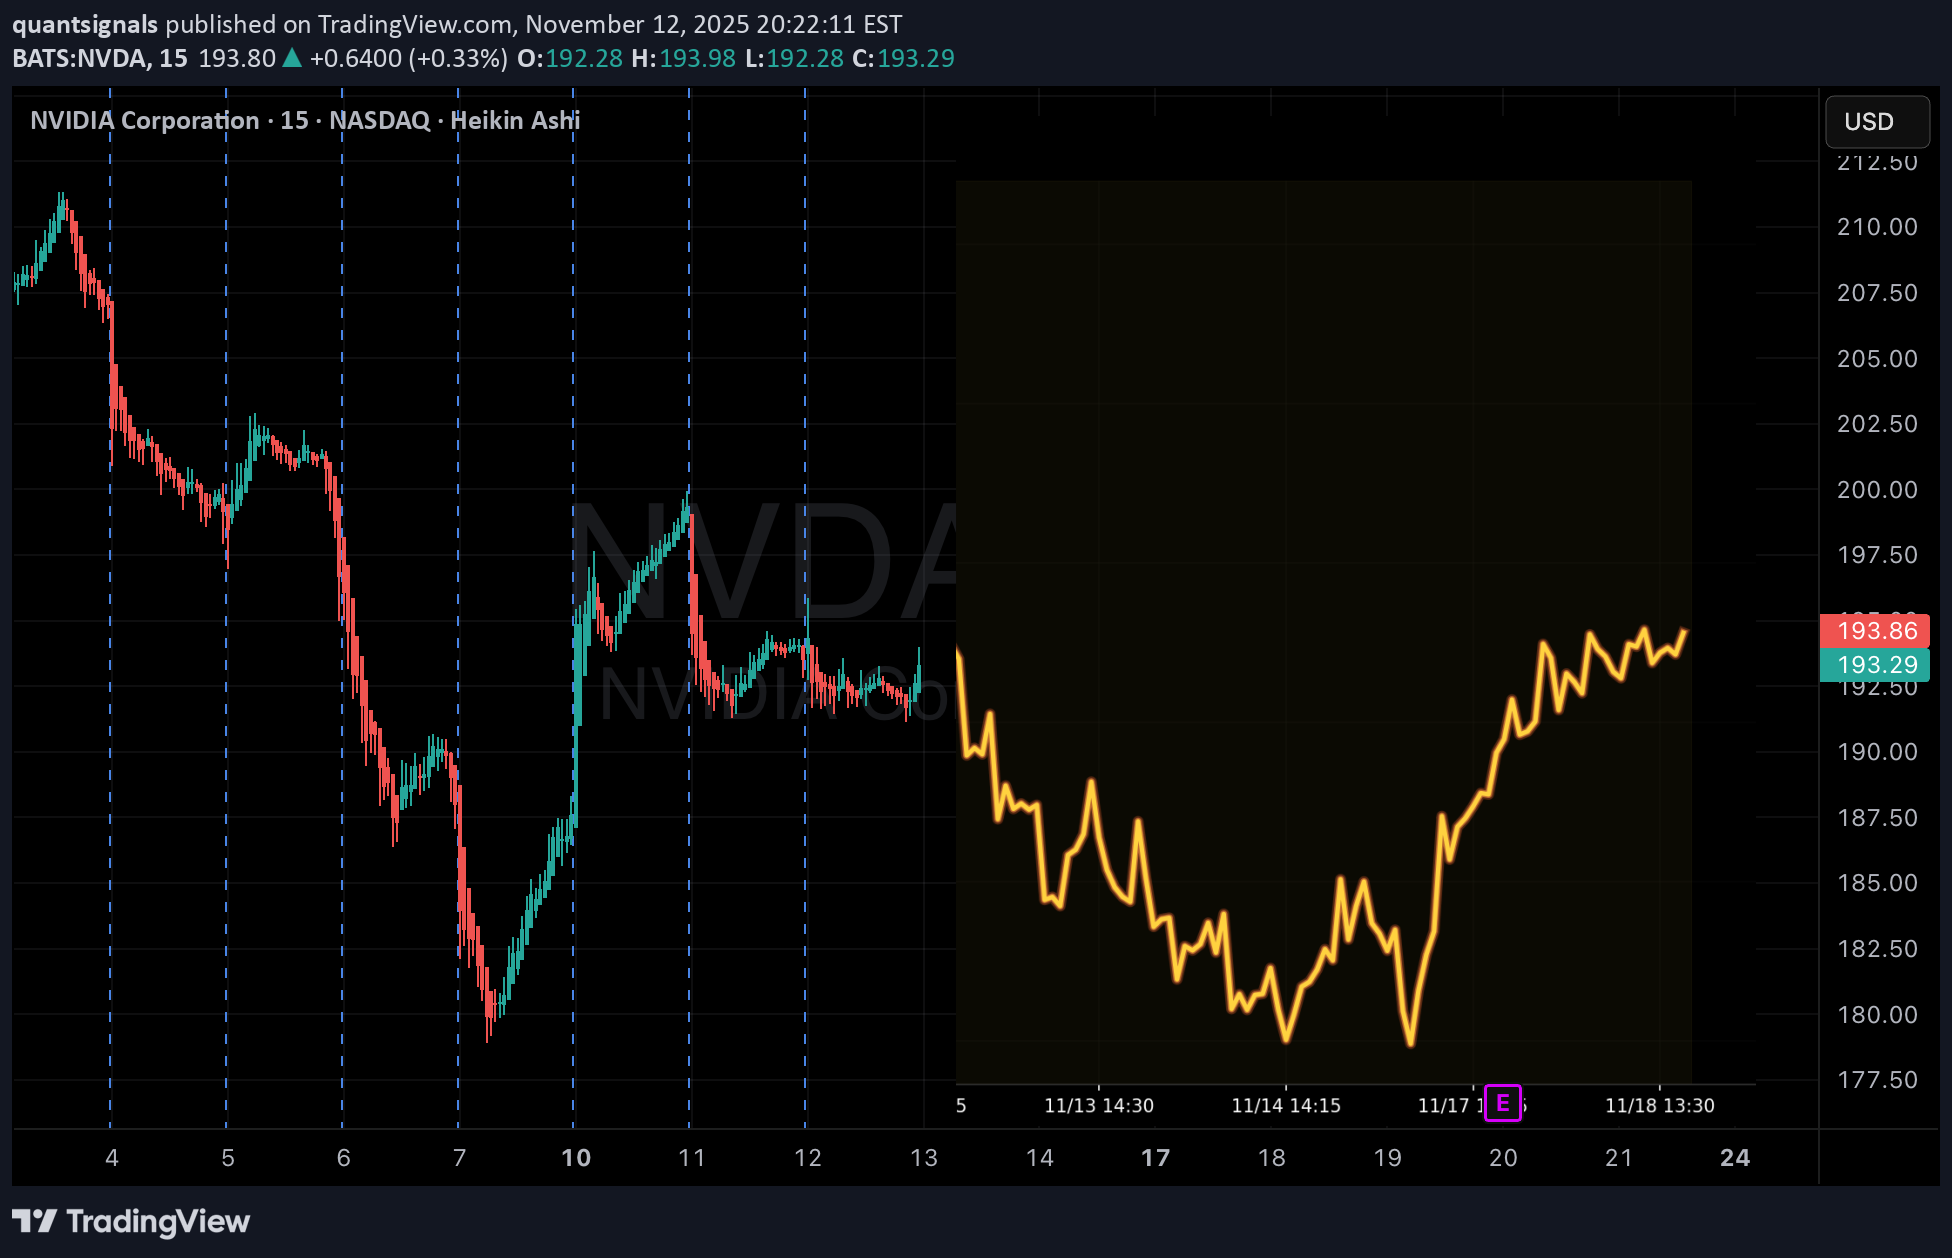
NVDA Weekly Options Analysis – 2025-11-12 Current Price: $192.38 Trend: Neutral (Weekly Momentum: Bearish -1.73%) Confidence: 58% | Conviction: Low Expiry: 2025-11-14 (2 days) Recommended Strike: $192.50 Technical Overview: Price in the middle of weekly range ($178.91–$200.05) EMA alignment confirms bearish weekly trend VWAP at $190.89 offers near-term support Volume spike (26.4x previous week) indicates potential capitulation Options Flow: Extremely bullish, PCR 0.42 → heavy call buying Max volume at $262 call shows institutional positioning High gamma risk, volatility potential elevated Trade Setup: Direction: Buy Calls (Long) Entry: $2.74 Target 1: $3.70 (+35%) Target 2: $4.50 (+64%) Stop Loss: $2.05 (-25%) Position Size: 2% portfolio (Low conviction) Summary Insight: Katy AI shows neutral/bearish signals, but options flow suggests bullish institutional interest High-risk, low-conviction setup; small position recommended Mixed technicals and news sentiment → use tight risk management ⚠️ Risk Warning: Conflicting signals → only small size recommended Not financial advice; educational commentary for QS Premium members
quantsignals
تحلیل هوش مصنوعی HOOD: روند خنثی، آیا الان زمان خرید است؟
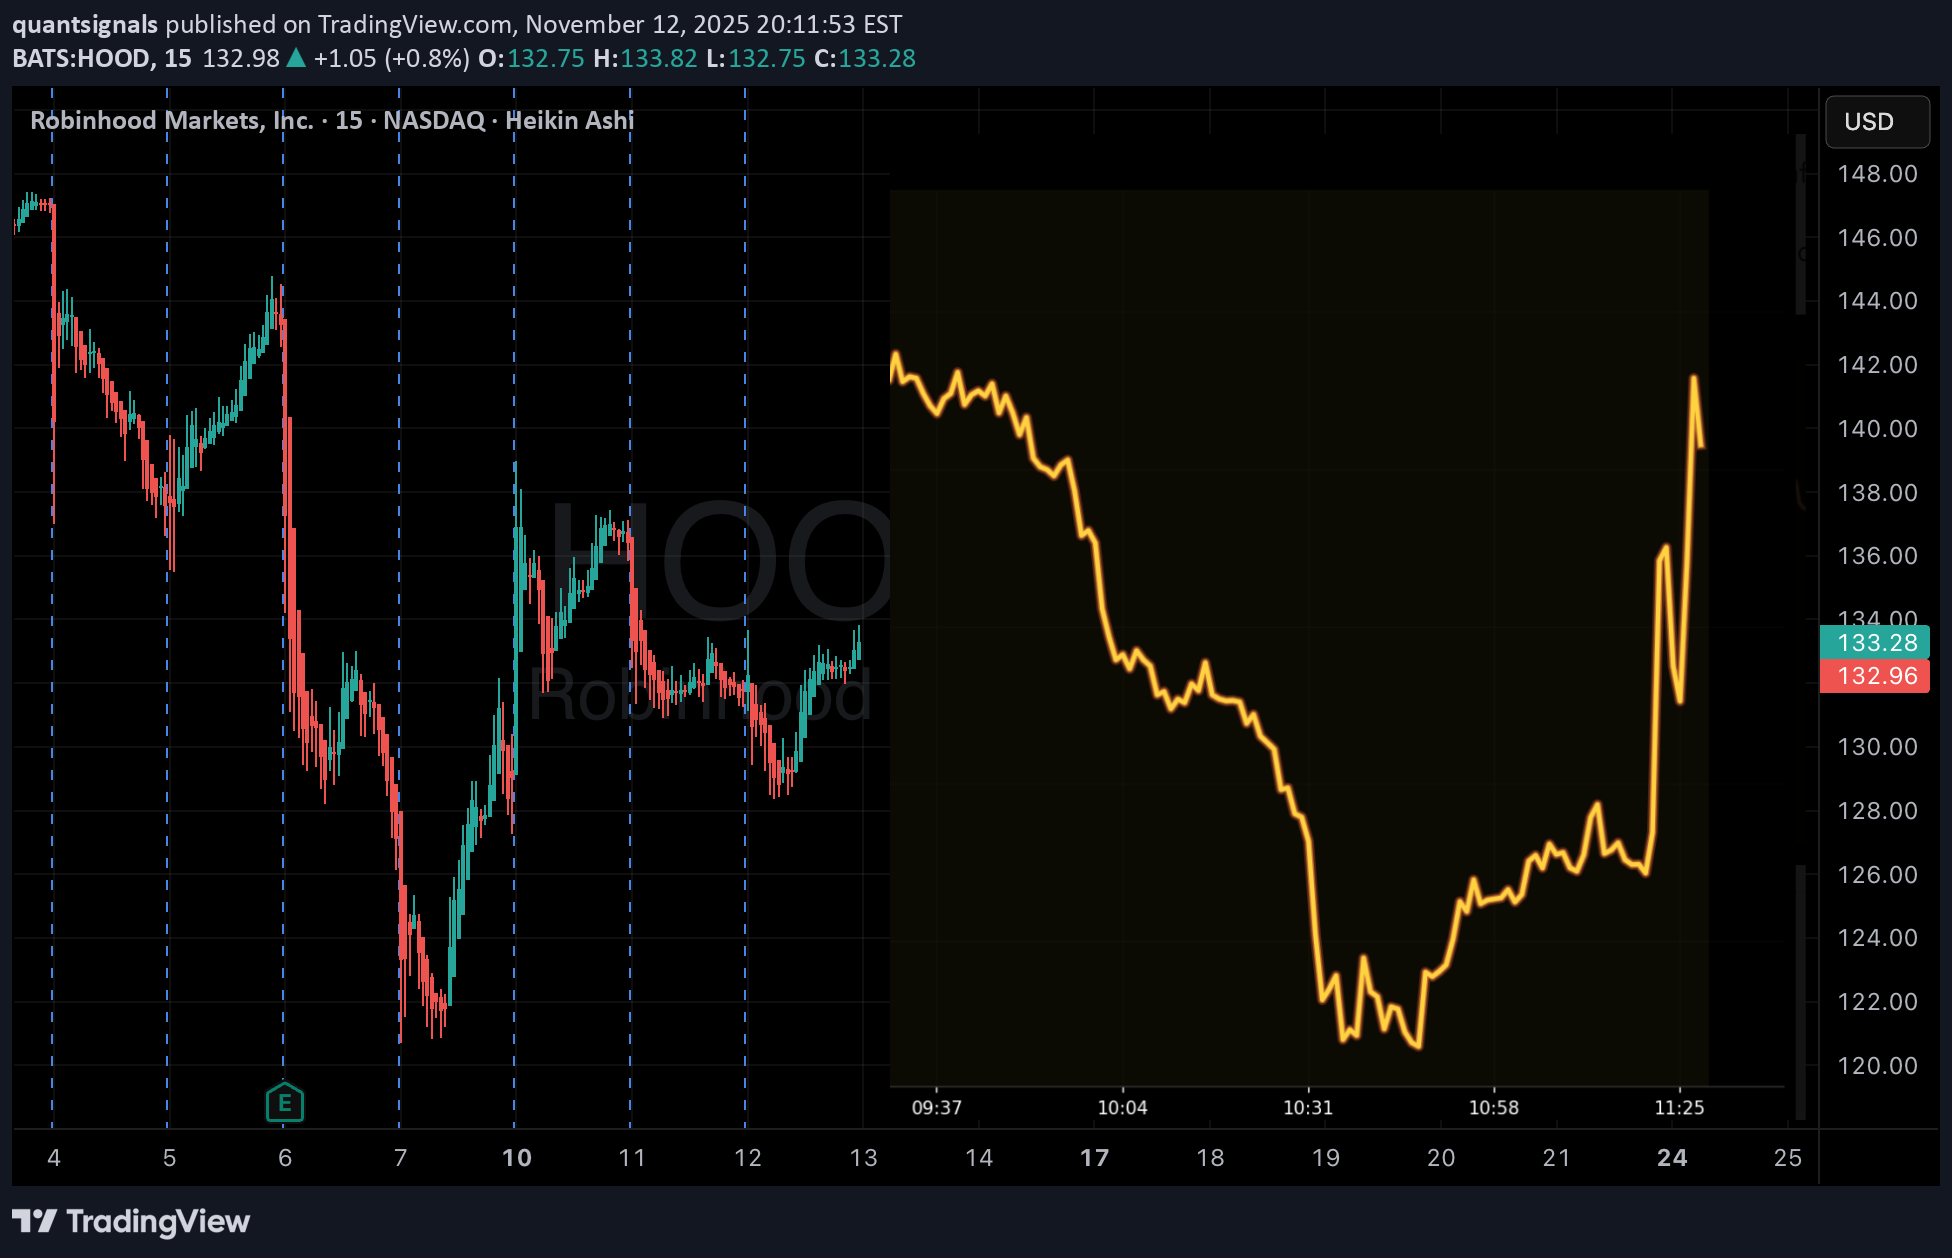
🚀 HOOD – QuantSignals AI Analysis (1M Prediction) Current Price: $133.27 Final Prediction: $133.08 (-0.14%) 30min Target: $132.79 (-0.36%) Trend: Neutral Confidence: 55% Volatility: 32.2% Summary: 1 stock analyzed (HOOD) 0 trade signals generated The Market shows a neutral trend for HOOD in the near term. Small predicted movement and moderate confidence suggest holding or waiting for a clearer setup rather than taking a position.
Disclaimer
Any content and materials included in Sahmeto's website and official communication channels are a compilation of personal opinions and analyses and are not binding. They do not constitute any recommendation for buying, selling, entering or exiting the stock market and cryptocurrency market. Also, all news and analyses included in the website and channels are merely republished information from official and unofficial domestic and foreign sources, and it is obvious that users of the said content are responsible for following up and ensuring the authenticity and accuracy of the materials. Therefore, while disclaiming responsibility, it is declared that the responsibility for any decision-making, action, and potential profit and loss in the capital market and cryptocurrency market lies with the trader.