
The_Alchemist_Trader_
@t_The_Alchemist_Trader_

What symbols does the trader recommend buying?
Purchase History
پیام های تریدر
Filter
The_Alchemist_Trader_
Chainlink Bullish Reversal?

Chainlink is trading at a critical high-time-frame support zone around $12, where price action is beginning to form a potential double bottom structure. This region is technically significant, as it aligns with both the value area low and the Point of Control, suggesting strong historical participation and acceptance at this level. So far, LINK has defended this support multiple times, indicating that sellers are struggling to push price lower. While the broader bearish structure is still intact, the compression around support highlights a potential transition phase where accumulation may be taking place. Key Technical Observations: - Price is holding $12 HTF support, aligned with value area low and POC - A double bottom pattern is developing but not yet confirmed - Break above the most recent lower high is required for validation - Upside target sits near $19, aligning with 0.618 Fibonacci and daily resistance From a market structure perspective, confirmation will only occur once LINK breaks its current lower-high sequence. As long as $12 holds, the reversal thesis remains valid. Failure to reclaim resistance keeps price range-bound, but a confirmed breakout could mark the beginning of a macro trend shift.
The_Alchemist_Trader_
XRP corrective after strong rejection, lower coming?

XRP has entered a corrective phase after its recent rally stalled near the $2.40 resistance zone, where price faced a sharp and technically significant rejection. This area marked a high-confluence level, combining both Fibonacci resistance and a major volume node, making it a natural zone for supply to enter the market. Following the rejection, XRP has now accepted back below value, signalling a loss of short-term bullish momentum. Key Technical Observations: - Rejection occurred at the 0.618 Fibonacci retracement, a common reversal level - The sell-off aligned with the Point of Control, the highest volume area of the trading range - Acceptance below the POC shifts control back to sellers in the short term - Downside focus moves toward the value area low, with $1.79 as the next major support From a market structure perspective, this move lower does not yet signal a trend reversal. Instead, it reflects a rotational correction within a broader trading range. The rally into $2.40 lacked strong volume expansion, highlighting limited bullish conviction as price approached resistance. In contrast, selling pressure increased on the rejection, reinforcing the validity of the move lower. As long as XRP remains capped below $2.40 and fails to reclaim acceptance above the Point of Control, the path of least resistance remains corrective. A reaction from lower support could eventually allow price to rotate higher again, but until then, downside probing remains the higher-probability scenario in the immediate term.
The_Alchemist_Trader_
BTC Range-Bound Structure Keeps $80,000 in Focus

Bitcoin continues to trade within a well-defined range, struggling to reclaim key resistance despite multiple attempts. Price has repeatedly tested the $95,500 resistance zone, but each retest has resulted in rejection, reinforcing this area as the upper boundary of the current range. While Bitcoin has not yet rotated aggressively lower, the point of control (POC) has acted as temporary support, keeping price elevated in the short term. However, the current rally shows weak bullish characteristics, with limited volume inflows and a lack of strong follow-through. This suggests the move higher may be corrective rather than the start of a sustained trend. As long as price remains capped below resistance, the probability of a rotational move lower increases. The $80,000 level remains the key downside target, representing the overall swing low and lower boundary of the broader trading range. A decisive break above resistance with strong volume would be required to invalidate the range-bound thesis. Until then, market structure and momentum continue to favor consolidation, with $80,000 firmly in focus as the next major support level.
The_Alchemist_Trader_
DOGE Distribution Signals Emerge at $0.15 Resistance

Dogecoin’s recent rally from the $0.12 support zone is beginning to show signs of exhaustion as price stalls near the $0.15 resistance. This level represents a high-confluence zone, aligning with the value area high and a prior swing high, making it a natural area for selling pressure to emerge. Price action around $0.15 has produced multiple rejections, suggesting that buyers are struggling to gain acceptance above this region. From a lower-time-frame perspective, this behavior points toward distribution, where supply begins to outweigh demand after an extended rally. As long as Dogecoin remains capped below $0.15, the probability of a corrective rotation increases. The most likely downside target sits at the value area low, which also aligns with the 0.618 Fibonacci retracement, making it a key area to monitor for potential support and a higher-low formation. Acceptance above $0.15 with strong volume would be required to invalidate the distribution thesis and reopen the path for continuation. Until then, the technical bias favors consolidation or a pullback within the broader trading range.
The_Alchemist_Trader_
Hyperliquid Technical Analysis - Lower Comming?

Hyperliquid price has reacted at the 0.618 Fibonacci golden pocket, but the quality of the bounce remains weak. The move higher has occurred on low volume, suggesting limited buyer conviction rather than a confirmed trend reversal. The $27 level is now a critical area to monitor. As long as price remains above this support, short-term stabilization is possible. However, acceptance below $27 would open the probability of a cascading, capitulation-style move toward the $19 support region, where deeper liquidity is located. Key Levels & Structure: - Golden Pocket (0.618 Fibonacci): Current reaction zone - Key Support: $27 - Downside Target: $19 What to Expect: Without strong volume confirmation or a reclaim of key resistance levels, the bounce is likely corrective. A breakdown below $27 would increase downside risk.
The_Alchemist_Trader_
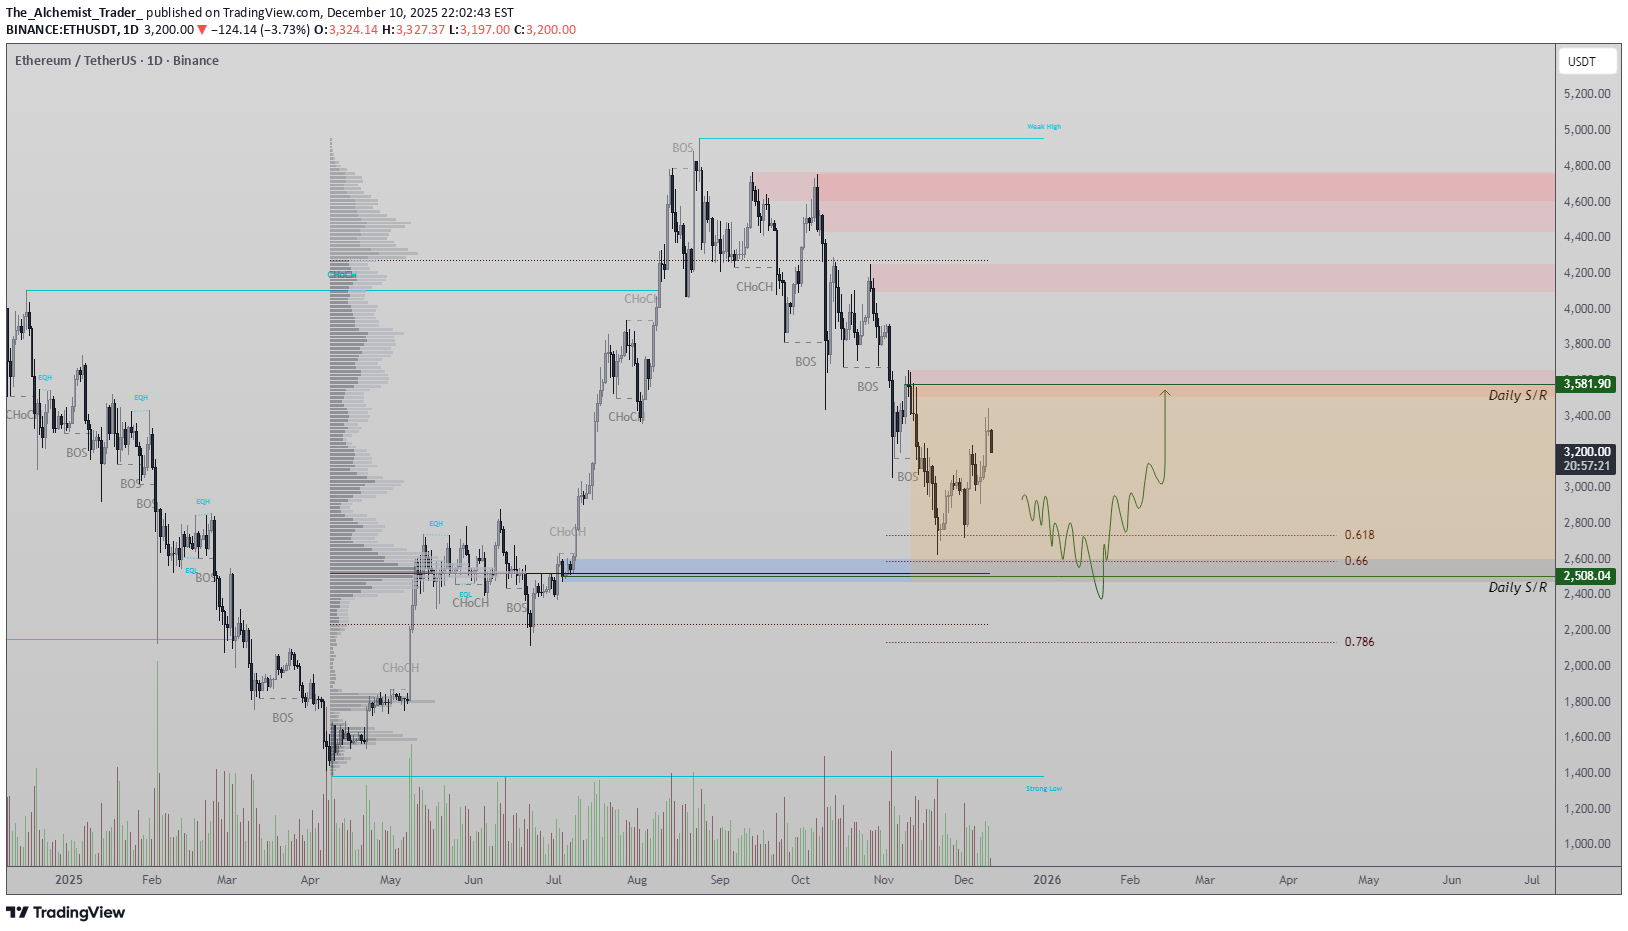
Ethereum Price Shows Weakness, Capitulation?

Ethereum price action has broken down bearishly from a rising wedge structure, confirming a continuation of downside momentum. The breakout attempt into the 0.618 Fibonacci level proved to be a false move, trapping late buyers before price was rejected back into the wedge — a classic technical fakeout. Following this failure, Ethereum has now lost the Point of Control on a daily closing basis. This shift signals a loss of market equilibrium and increases the probability of a deeper corrective move. As long as price remains below the Point of Control, downside continuation toward the $2,500 region remains the higher-probability scenario. Key Levels & Structure: -Pattern: Bearish rising wedge breakdown - Failed Breakout: 0.618 Fibonacci retracement - Key Support Target: $2,500 What to Expect: Ethereum is likely to remain under pressure unless it can reclaim the Point of Control. Failure to do so keeps the downside target toward $2,500 firmly in play.
The_Alchemist_Trader_
Bitcoin Price Trading Range

Bitcoin price action is now trading within a clearly defined range between sub-$80,000 support and $94,000 resistance. Price recently rejected from the range high after failing to reclaim the Value Area High on a daily closing basis, reinforcing the range-bound structure. This rejection has triggered a bearish expansion back toward the range midpoint, which aligns with the 0.618 Fibonacci retracement and daily support. This region is now critical for short-term direction. As long as Bitcoin holds this midpoint support, price is likely to remain rotational within the range. However, a daily close below this level would open the probability of a deeper corrective move toward the sub-$80,000 range low. Key Levels & Structure: - Range High: $94,000 - Range Midpoint: 0.618 Fibonacci + Daily Support - Range Low: Sub-$80,000 What to Expect: Bitcoin is likely to remain rotational within this range until a decisive breakout or breakdown occurs. Directional confirmation will come from a clean daily close beyond the range boundaries.
The_Alchemist_Trader_
Bitcoin Price Trades into Triangle

Bitcoin is consolidating within a tightening triangle pattern, with price repeatedly bouncing from dynamic support at the lower boundary. This ongoing compression suggests volatility is being stored rather than released. As price continues to squeeze toward the apex, the probability of a breakout increases. While direction remains unconfirmed, the structure itself points to an imminent expansion once price exits the triangle. Key Levels & Structure: - Dynamic triangle support continues to hold - Confluence with value area and 0.618 Fibonacci - High-time-frame triangle nearing its apex What to Expect: A decisive breakout is likely once price reaches the apex. Direction will be confirmed on a clean break and close outside the triangle boundaries.
The_Alchemist_Trader_
Bitcoin Price Weakness, $76,000 next?
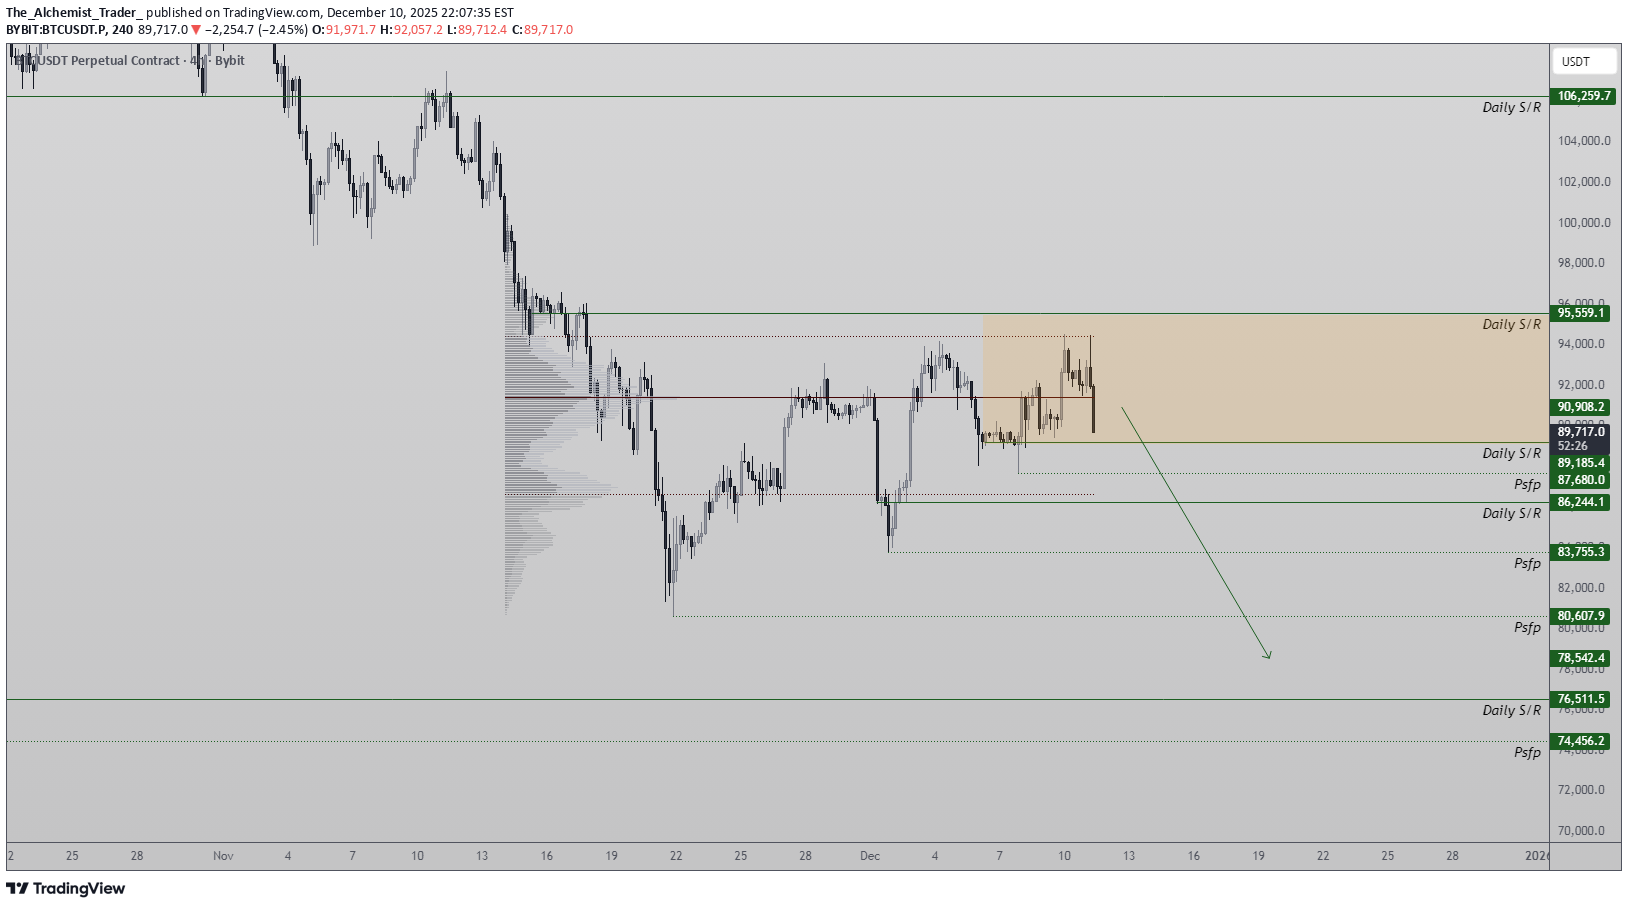
Bitcoin continues to struggle below the value area high, repeatedly rejecting the $95,559 resistance. Price has slipped beneath the POC, showing signs of weakness as momentum shifts toward support. BTC is now heading into the $89,185 support level, and a breakdown here could trigger deeper selling as liquidity pools sit lower in the structure. Key Points: Rejected multiple times at $95,559 resistance Trading below POC, signalling immediate weakness Next key support sits at $89,185, with deeper targets at $76,000 What to Expect: Unless Bitcoin reclaims the POC and breaks back above $95,559, the bearish trend is likely to continue, with $76,000 becoming a high-probability downside target.
The_Alchemist_Trader_
Ethereum (ETH) Update, Lower High ?
Ethereum has rallied, but the move lacks strong volume support, making the bounce look fragile. With lower highs continuing to form, the broader trend remains bearish despite the short-term push. Price is now approaching the $2,500 support, which aligns with the 0.618 Fibonacci level and key daily structure — a critical zone for bulls to defend. Key Points: - Rally shows weak bullish volume - Structure remains bearish with consistent lower highs - Major support sits at $2,500 (0.618 Fibonacci + daily support) What to Expect: Unless bulls defend $2,500 with strong volume, ETH is likely to continue lower and print another confirmed bearish lower high.
Disclaimer
Any content and materials included in Sahmeto's website and official communication channels are a compilation of personal opinions and analyses and are not binding. They do not constitute any recommendation for buying, selling, entering or exiting the stock market and cryptocurrency market. Also, all news and analyses included in the website and channels are merely republished information from official and unofficial domestic and foreign sources, and it is obvious that users of the said content are responsible for following up and ensuring the authenticity and accuracy of the materials. Therefore, while disclaiming responsibility, it is declared that the responsibility for any decision-making, action, and potential profit and loss in the capital market and cryptocurrency market lies with the trader.