
PENDLE
Pendle
| تریدر | نوع سیگنال | حد سود/ضرر | زمان انتشار | مشاهده پیام |
|---|---|---|---|---|
 TheSignalystRank: 14922 | خرید | حد سود: تعیین نشده حد ضرر: تعیین نشده | 11/26/2025 | |
 Crypto-by-PRIMERank: 35114 | خرید | حد سود: تعیین نشده حد ضرر: تعیین نشده | 11/27/2025 |
Price Chart of Pendle
سود 3 Months :
سیگنالهای Pendle
Filter
Sort messages by
Trader Type
Time Frame
Crypto-by-PRIME
پندل (PENDLE) در آستانه جهش صعودی جدید؛ منتظر کدام منطقه قیمتی هستیم؟

Pendle / USDT is looking strong, but I’m expecting price to first tap the 4H FVG zone before continuing its trend towards $3 – $3.5… A clean reaction from that zone can trigger the next bullish wave, so waiting for confirmation is important here. Momentum is still in favor of buyers, but entries should always be planned with patience. Manage risk wisely and only enter after a clear confirmation.

CryptoNuclear
نقطه عطف پندل (PENDLE): آیا منتظر صعود تاریخی هستیم یا سقوط بزرگ؟
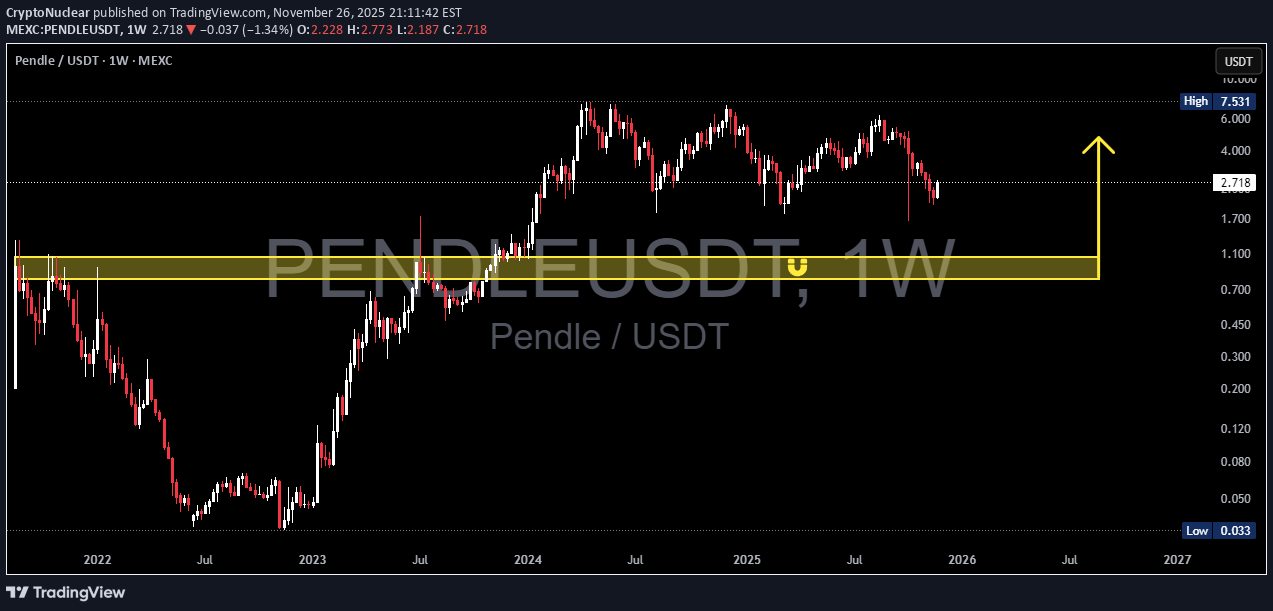
Pendle is now approaching one of the most critical areas on its entire weekly chart. After topping near 7.5 and forming a long distribution phase, price is sliding back toward the historical origin of its previous bull cycle — the 1.05–0.80 demand zone. This yellow zone is not just another support. It’s the level that changed Pendle’s trajectory once before. --- 🧩 Macro Structure: What’s Really Happening? 2022 → Early 2023: Long accumulation base. 2023 → 2024: Explosive breakout and trending bull phase. 2024 → 2025: Distribution, weakening structure, lower highs forming. Now: Price retracing toward the most critical weekly demand zone. Why is 1.05–0.80 such a big deal? Because this is where: The previous bullrun began Major volume and liquidity were absorbed Smart money positioned before the breakout If the zone holds → history could repeat. If it breaks → the long-term bullish structure collapses. --- 🟢 Bullish Scenario — Could This Become a New Macro Higher Low? A bullish case activates if: 1. Price taps 1.05–0.80 and rejects strongly – A weekly candle with a long lower wick would be a powerful early signal. 2. Weekly close stays above the zone – Confirms that demand still dominates here. 3. Recovery targets are as follows: First reclaim: 2.7 Structural resistance: 4.0 Full recovery region: 6.0–7.5 If this happens, the chart would form a new macro higher low, potentially triggering a long-term bullish reversal. This is exactly where institutions and early-cycle buyers may step back in. --- 🔴 Bearish Scenario — Breakdown Toward Deeper Liquidity Zones? A bearish continuation is confirmed if: 1. Weekly close breaks below 0.80 with conviction – This signals full momentum shift to sellers. 2. Retest fails to reclaim the zone – Validates a clean supply-flip. 3. Downside targets become: 0.45 → midrange structural support 0.20–0.12 → major historical demand Below this lies deep capitulation territory Losing 0.80 would mark the official breakdown of Pendle’s multi-year bullish structure. --- 🎯 Why the 1.05–0.80 Zone Is So Important Because it is: A macro decision point for market direction A battle zone between smart money and retail liquidity The origin of the previous bull market The clearest weekly level on the entire chart This is the type of zone that determines the direction of the next several months. --- 📌 Conclusion Pendle enters one of its most critical phases. The 1.05–0.80 zone is not merely “support” — it is the major pivot that will decide whether: Pendle is preparing for a large-scale weekly reversal, or Pendle is sliding into a deeper corrective phase toward 0.45 → 0.20. On the weekly timeframe, every reaction is amplified and highly meaningful. --- #Pendle #PENDLEUSDT #CryptoAnalysis #MarketStructure #PriceAction #WeeklyChart #CryptoOutlook #SupportAndResistance #CryptoBreakdown #CryptoReversal
TheSignalyst
پندل (PENDLE) در نقطه عطف: آیا حمایت قوی، گاوها را به بازار باز میگرداند؟
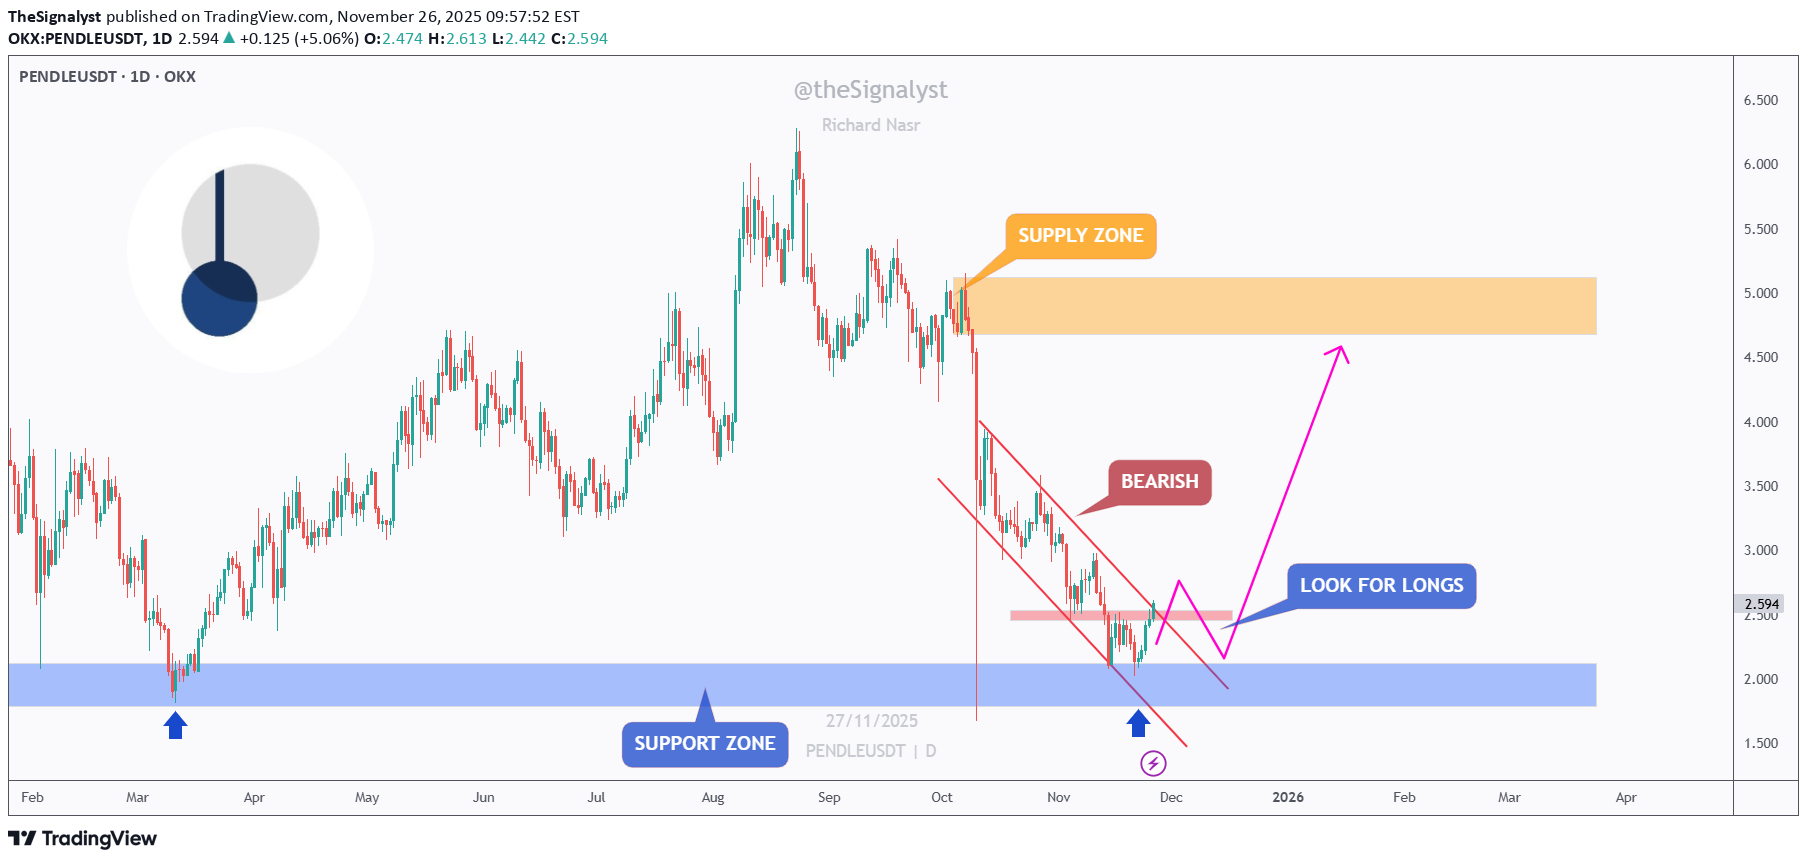
📉PENDLE has been bearish for weeks, sliding inside a clean falling channel. But price is now reacting from a major support zone, the same area that initiated previous strong rallies earlier this year. ⚔️As long as this blue support zone holds, we will be looking for long setups, expecting a corrective move toward the upper bound of the falling channel. The first confirmation from the bulls will come after a break above the pink structure zone - the last lower high inside the correction. Once that level is reclaimed, momentum could shift upward, opening the way for a larger move toward the supply zone around 5.00. For now, PENDLE is positioned at a potential turning point… will the support zone spark the next bullish correction? 🤔 ⚠️ Disclaimer: This is not financial advice. Always do your own research and manage risk properly. 📚 Stick to your trading plan regarding entries, risk, and management. Good luck! 🍀 All Strategies Are Good; If Managed Properly! ~Richard Nasr

Bithereum_io
پندل (PENDLE) از الگوی گُوِه شکست؟ نقاط ورود و اهداف هیجانانگیز برای خرید!

#PENDLE has broken above the falling wedge pattern on the daily chart. The daily candle hasn’t closed yet, so the breakout is not fully confirmed. Keep an eye on it. If price dips back into the wedge, you can consider an additional buy on the support zone. If the breakout above the wedge confirms, the potential targets are: 🎯 $2.729 🎯 $3.166 🎯 $3.519 🎯 $3.872 🎯 $4.375 🎯 $5.016 ⚠️ Always remember to use a tight stop-loss and maintain proper risk management.

AlvinDeo96
تحلیل تکنیکال پندل (PENDLE): آیا برگشت قیمت قطعی است یا در دام خرسها خواهیم افتاد؟
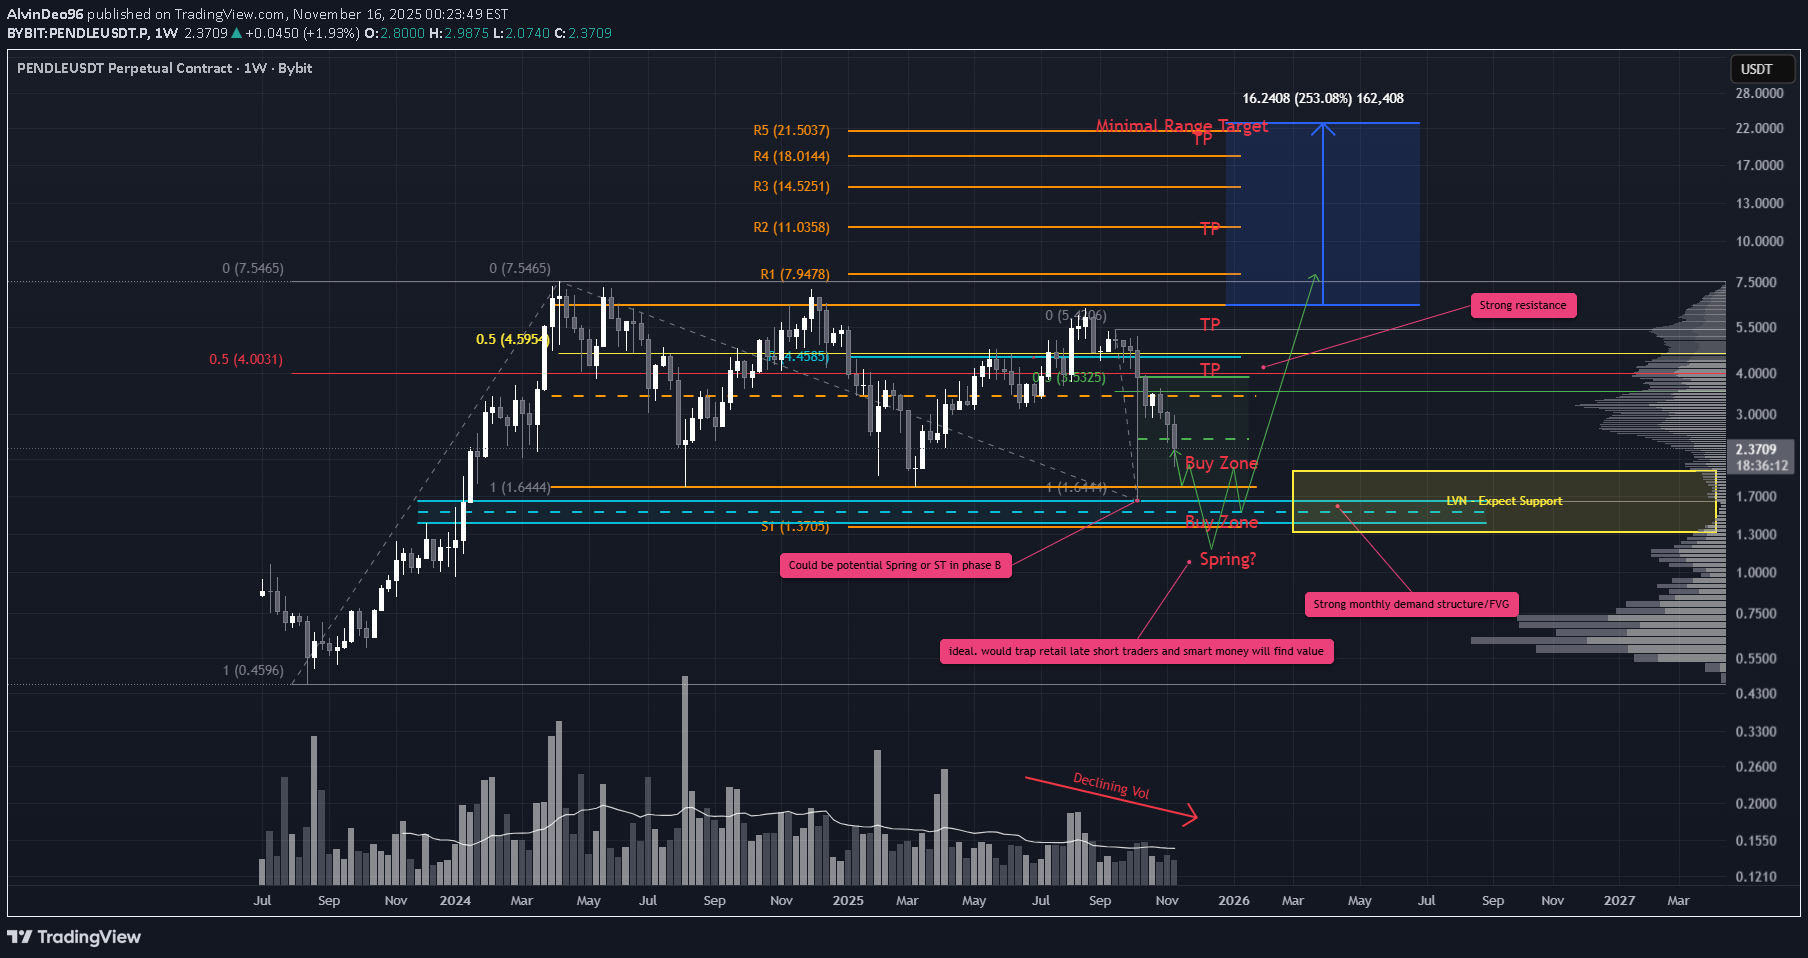
PENDLE’s chart is loaded with nuance right now. There’s a lot in play, and multiple paths could unfold from here so staying nimble and managing risk is key. The October 10 flash crash left a deep wick at the bottom of the range. Price initially bounced back to ~$3.87 but has since retraced heavily into that wick. Candle spreads are widening, which suggests selling pressure is still present, but volume hasn’t picked up. That leans me toward accumulation rather than distribution. We’re currently hovering around the EQ of that wick. If price pushes out strongly from here, the pullback may be complete and we can treat the October 10 low as a low-volume spring. If price continues to pull back, we may sweep those October lows and form the actual spring. The ideal confirmation would be a weekly move below the range on volume, followed by a close back inside the range preferably with a doji or hammer. Psychologically, that would be the cleanest setup, injecting liquidity and setting the stage for reversal. Just below the range sits the yearly S1 pivot and a major monthly FVG both worth watching. Trade Scenario 1 – Early Entry with Spring Add-on Entry • Start layering in now (as outlined above) • Add again if we get the spring confirmation Stop Loss • No hard SL yet. This setup leans advanced. • If we see large bearish candles on rising volume, the thesis is invalidated and we exit. Trade Scenario 2 – Wait for Spring Confirmation Entry • Wait for price to sweep the lows and print the spring candle • Enter on confirmation (weekly close back in range with volume) Targets for Both Scenarios Keep it simple: • EQ of the range • Range highs • Minimal range extension if price breaks out above This is a contrarian view. Many expect crypto to roll over into a broader bear phase. But if this spring plays out, PENDLE could offer a clean bounce setup with strong psychological structure with most retail traders left behind.

ydnldn
پیشبینی سقوط PENDLE: ورود به موقعیت فروش (Short) با اهداف دقیق
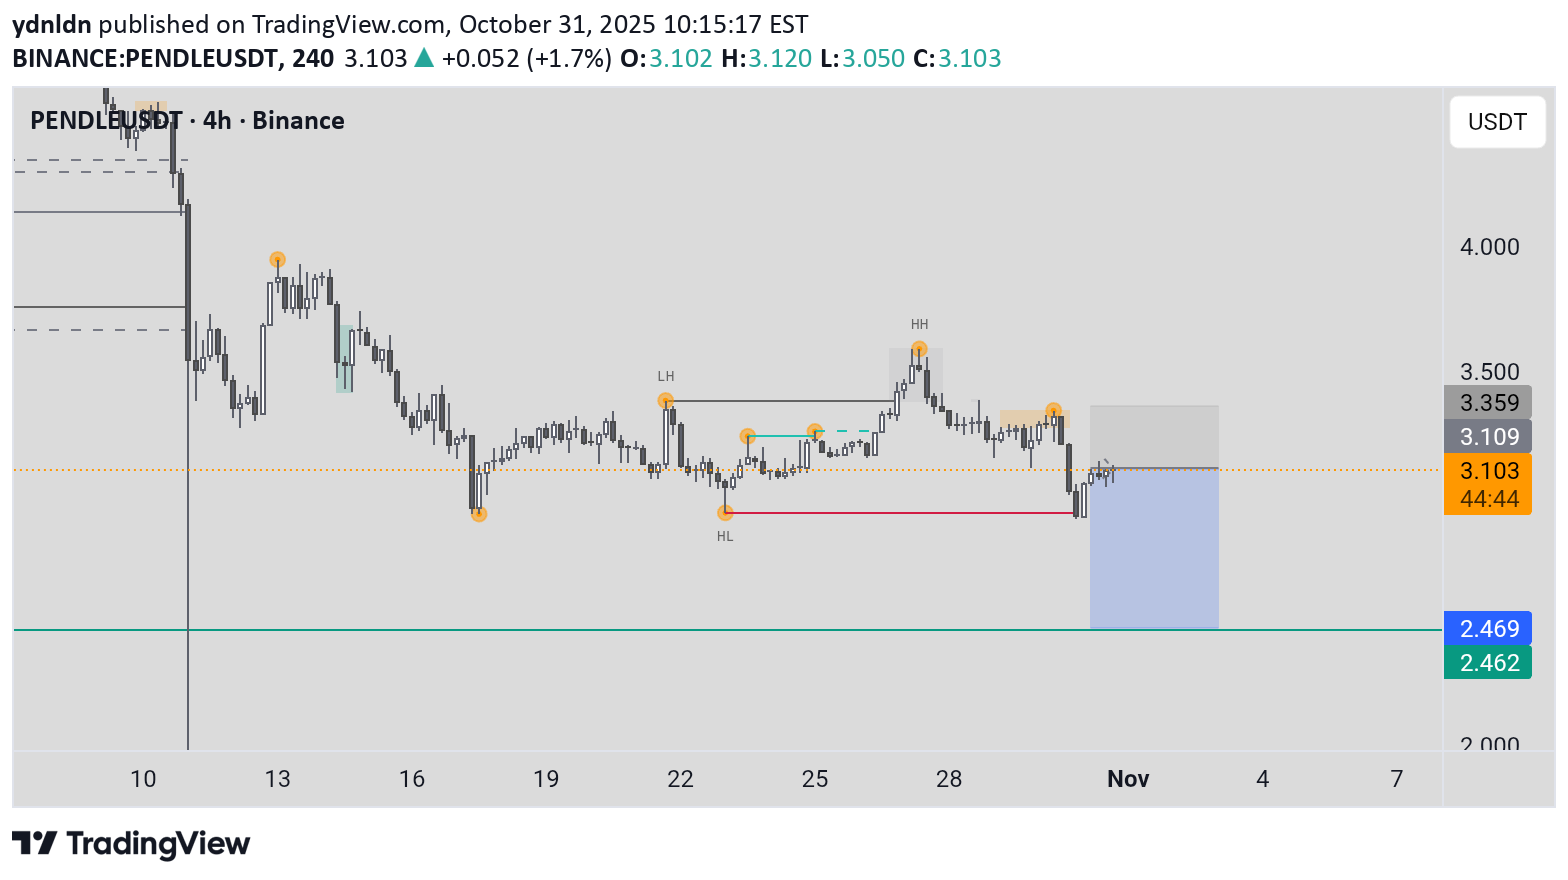
Bearish Scenario (Continuation Downtrend): Rationale: A sharp drop at the end of the chart indicates weak buyers; if it breaks lower, bearish momentum will continue. Entry: Short below ~2,469 USDT (breakdown with a bearish candle close and high volume). Alternative: Short on a pullback to ~3,105 USDT (as new resistance) if there is rejection. Stop Loss (SL): Above the recent pullback high, ~3,200 USDT (buffer 1-2%). Take Profit (TP): TP1: ~2,000 USDT (50% of position, R:R 1:1.5). TP2: Lower extension (use Fibonacci 1.618 from the swing high-low, target ~1,800 USDT). Trailing stop: Follow with the 50-EMA if the trend is strong. Invalidation: If the price reclaims ~3,105 USDT or above, cancel the bearish plan.

UnculturedTrade007
خیز بلند پندل (PENDLE): فرصت خرید با اهداف قیمتی جذاب!
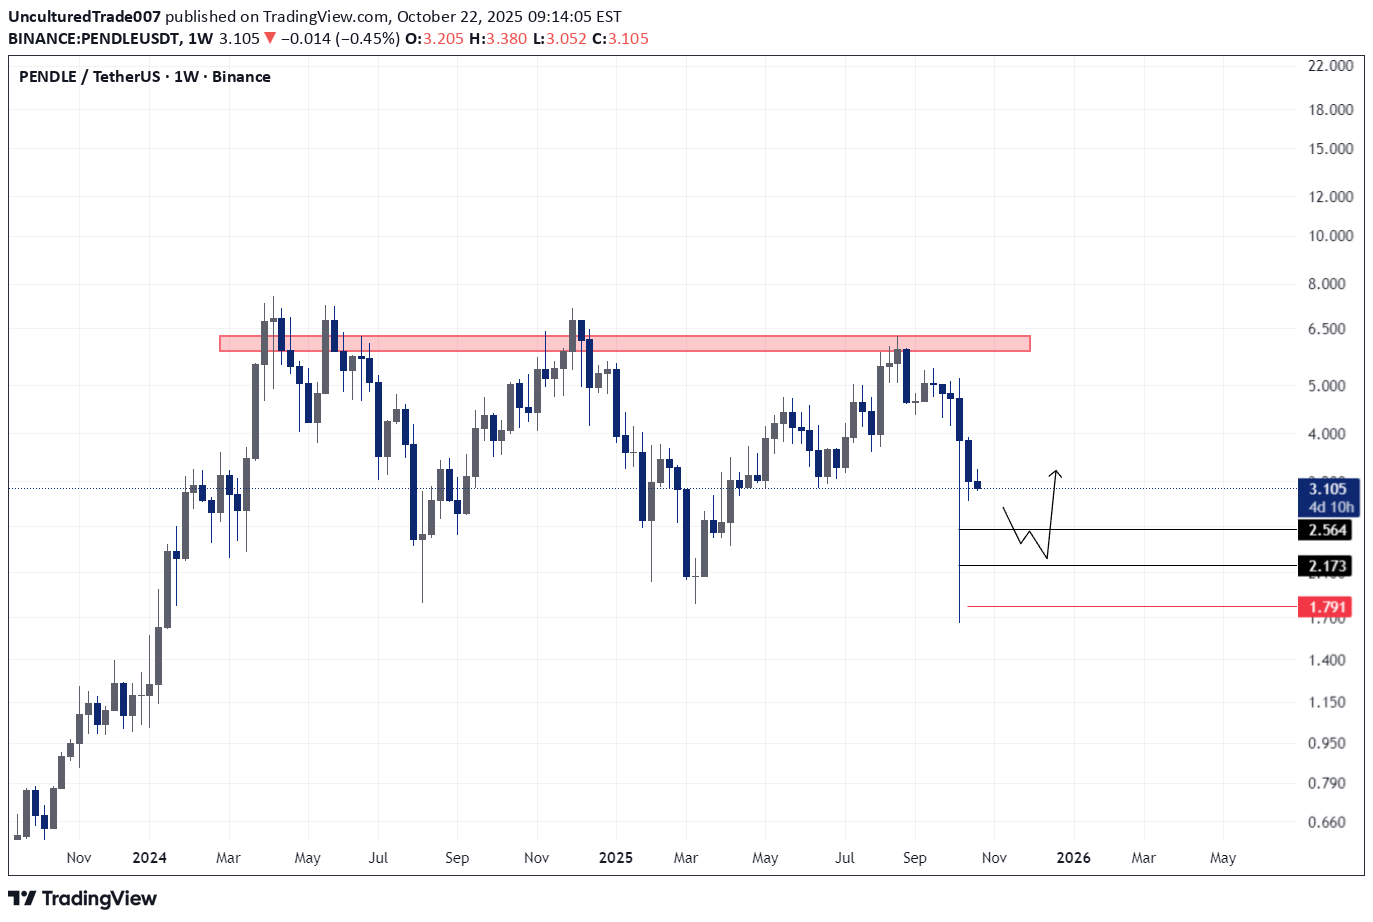
PENDLEUSDT Looking good to Long Entry Between 2.150 - 2.560 SL Below 1.791 Target above 3.5$ Lev & Margin As Per Your Risk Capacity

TwinklingWM
شکست خط روند ترند، راز ورود طلا برای سود انفجاری!

Entry should only be considered after price breaks the trendline and confirms the breakout

tradecitypro
پندل (PENDLE) در آستانه شکست مهم: آیا روند صعودی ادامه مییابد؟

👋 Welcome to TradeCity Pro! In this analysis, I want to review the PENDLE coin for you — one of the projects in the Ethereum ecosystem, currently ranked 93rd on CoinMarketCap with a market cap of $858.76 million. 📅 Daily Timeframe On the daily timeframe, this coin has formed two trendlines. The main trendline is the long-term ascending trendline that the price has respected for a long time, while the second is a continuation descending trendline — if broken, the previous bullish move can resume. ✨ Since the overall trend is bullish, the continuation trendline is currently more important for us, because breaking it would confirm the continuation of the uptrend. 🔍 This trendline formed after the price reached the 5.732 level and made a fake breakout. 📊 The breakout trigger for this trendline is currently at 5.344. Breaking this level can provide an opportunity to open a long position on PENDLE. 🛒 For spot purchases, this same 5.344 trigger can be used, but the 5.732 level would be a much safer confirmation for a spot entry. ✅ The main confirmation of bullish continuation in higher cycles will come after breaking 6.857. 🎲 It’s important to note that any bullish breakout must be accompanied by an increase in volume, otherwise the move could easily turn out to be fake. ⚡️ If the ascending trendline breaks, the trigger for this breakdown is at 4.431. Breaking this level is not an ideal short trigger, but if the price stabilizes below it, you can consider activating your stop-loss in case you’ve already bought the coin in spot. 🧩 The next support levels in case of further decline are 3.741 and 3.017.The momentum trigger on the RSI is at 39.16. 📝 Final Thoughts Stay calm, trade wisely, and let's capture the market's best opportunities! This analysis reflects our opinions and is not financial advice. Share your thoughts in the comments, and don’t forget to share this analysis with your friends! ❤️

ibrahimakkaya
PENDLE
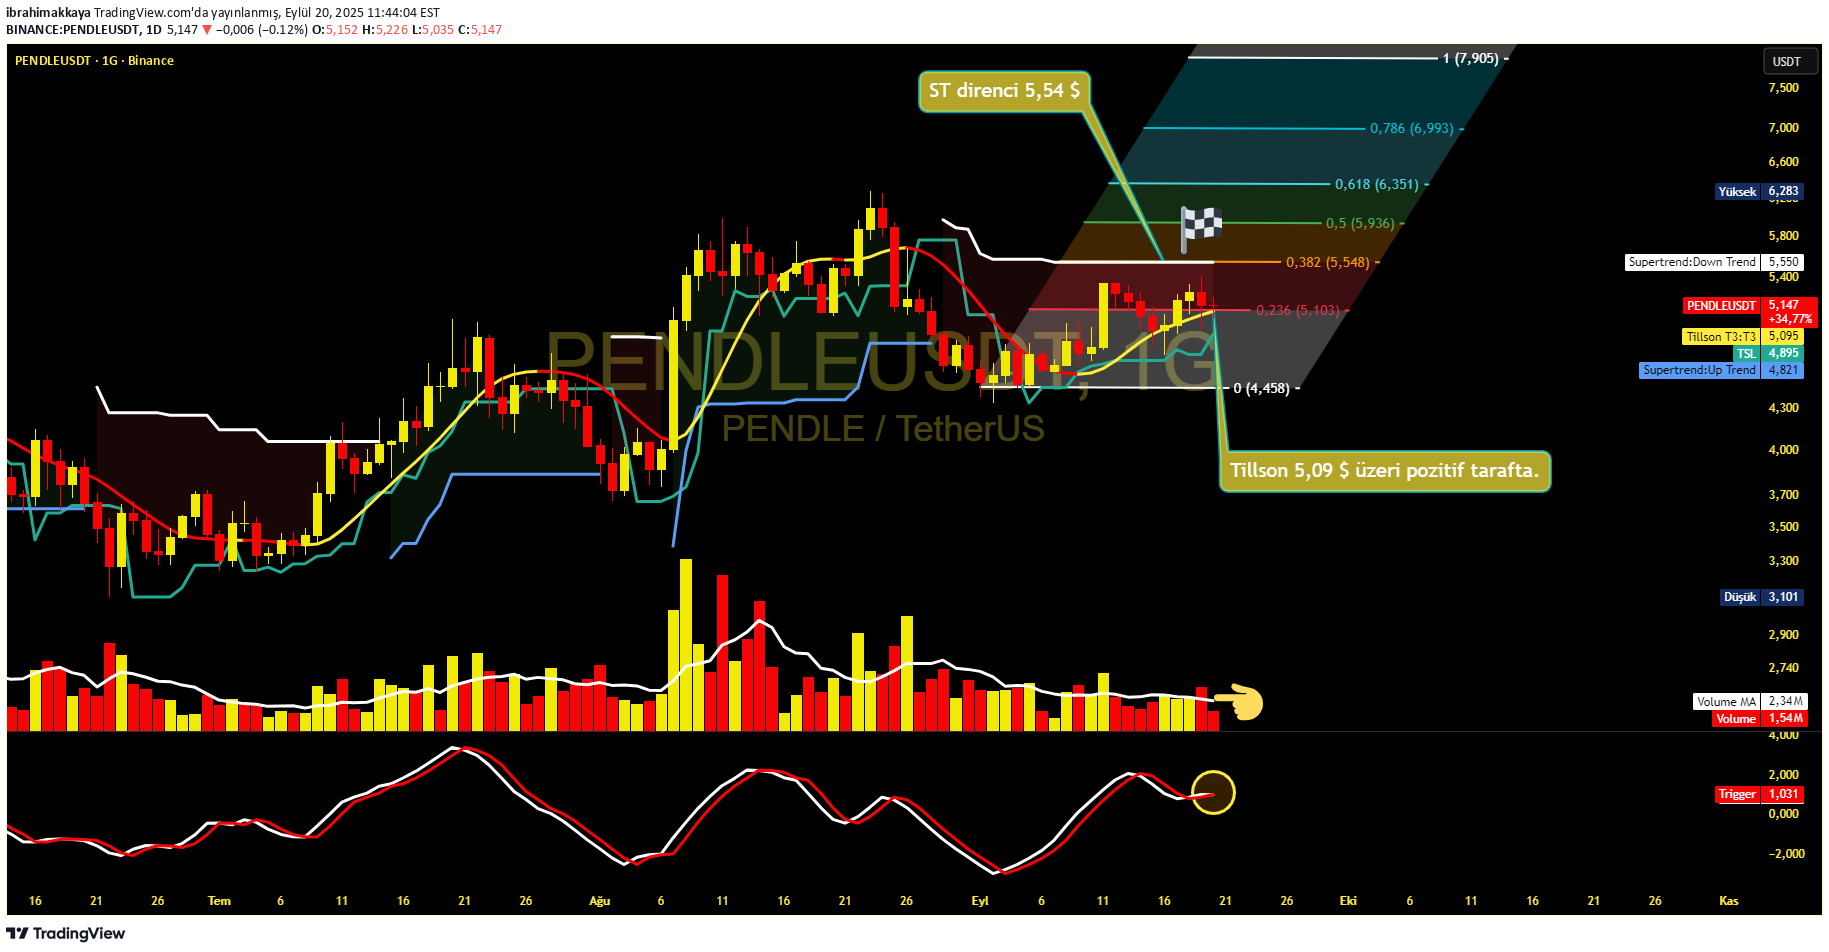
📊 Let's look at the technical analysis: #Pendle/USDT graph in a critical area. 📈 General view Tillson T3 level: $ 5.09 👉 👉 is now above the price. The fact that it remains above this level means positive signal. Supertrend resistance: 5,54 $ → If this level is exceeded, the rise confirmation is stronger. Gated flag target 🏁: $ 7,90 (Fibo 1.00 level). 🔎 Indicators Volume (Volume): There is a horizontal but recovery signal in recent days. Volume increase is required for upward movement 📌. Display: The intersection movement from the bottom has started 🚀. This shows that buyers are activated. Supertrend: Closing over $ 5,54 will be a sign of a new trend. ✅ Summary Izsüren stop (🛡️): $ 4,89 (TSL level). Positive view: It will continue at closing over $ 5.09. FIRST TARGETS: 5,54 → 6,35 → 7,90 $ 🏁 🔔 In short: When Tillson and Supertrend resistors are exceeded, a strong trend return will be confirmed. If the volume increase supports this movement, the target of $ 7,90 comes up.
Disclaimer
Any content and materials included in Sahmeto's website and official communication channels are a compilation of personal opinions and analyses and are not binding. They do not constitute any recommendation for buying, selling, entering or exiting the stock market and cryptocurrency market. Also, all news and analyses included in the website and channels are merely republished information from official and unofficial domestic and foreign sources, and it is obvious that users of the said content are responsible for following up and ensuring the authenticity and accuracy of the materials. Therefore, while disclaiming responsibility, it is declared that the responsibility for any decision-making, action, and potential profit and loss in the capital market and cryptocurrency market lies with the trader.