
ydnldn
@t_ydnldn

What symbols does the trader recommend buying?
Purchase History
پیام های تریدر
Filter
ydnldn
NLDN | SOLUSDT PERPETUAL SPECULATION SHORT

Asset Pair: SOL/USDT (Solana) on the Binance Perpetual Futures instrument. Timeframe: 1D (Daily), showing price movement from late 2025 to early January 2026. Current Price Condition: The price is around 134.10 USDT. It appears the price has just touched the resistance zone (orange box) around 139.27 and experienced rejection. Technical Analysis: Supply Zone (Orange): The area between 139 and 145 is a fairly strong selling zone, where the price has often held up in the past. This indicates expectations of a price decline after failing to break through the upper resistance. Sentiment: The short-term trend appears to be testing the strength of sellers in the upper area. If the price fails to hold above 134, there is potential for a move towards the psychological level of 120 or the lower target of 113.
ydnldn
NLDN | XAUUSD ANALYSIS

The market is in a bullish expansion phase. The price is testing the validity of a breakout above the 1.618 extension level. If this 4-hour candle closes strongly above 4.481, the potential for a move towards 4.609 is wide open.
ydnldn
NLDN | FILUSDT PERPETUAL SPECULATION BUY

FILUSDT 📈 4H Perpetual SHORT Entry 1.597 SL 1.440 TP 1.973 Should you find this analysis insightful, I invite you to like or leave a comment. Constructive feedback and suggestions are greatly appreciated. For further analyses, please follow me at @ydnldn.
ydnldn
پیشبینی فروش استراتژیک OPUSDT: تحلیل تکنیکال 4 ساعته با نقاط ورود و خروج دقیق

OPUSDT 📉 4H Perpetual SHORT Entry 0.3219 SL 0.3489 TP 0.2785 I have had a career as a technical analyst for 3 years at an investment management company. To get special access, forex signals, crypto, commodities or investment advice, please contact me on Instagram instagram.com/ydnldn?igsh=MWpmbGdxcnBmcTl6MQ== Should you find this analysis insightful, I invite you to like or leave a comment. Constructive feedback and suggestions are greatly appreciated. For further analyses, please follow me at @ydnldn.
ydnldn
پیشبینی انفجاری نزولی SEIUSDT: تحلیل تکنیکال 4 ساعته با نقطه ورود دقیق!

SEIUSDT 📉 4H Perpetual SHORT Entry 0.1230 SL 0.1331 TP 0.1123 I have had a career as a technical analyst for 3 years at an investment management company. To get special access, forex signals, crypto, commodities or investment advice, please contact me on Instagram instagram.com/ydnldn?igsh=MWpmbGdxcnBmcTl6MQ== Should you find this analysis insightful, I invite you to like or leave a comment. Constructive feedback and suggestions are greatly appreciated. For further analyses, please follow me at @ydnldn.
ydnldn
NLDN | ANALYSIS JUPITER

Price Structure: Currently in a recovery phase after forming a base below. The price has just broken out of the intermediate consolidation zone. Resistance Zone (Target): There is an orange supply area around $0.2400 - $0.2500, which serves as the main upside target. Support Zone (Entry): There is a blue demand area around $0.2000 - $0.2100. The arrow indicates the expectation that the price will retest (a healthy correction) this area before continuing to rise. Current Price: Currently at $0.2131. This position is testing the latest local high. Movement Projection: Analysis suggests a Buy on Retest strategy; wait for the price to drop slightly into the blue zone to seek confirmation of a bounce towards the target in the orange zone.
ydnldn
NLDN | ONDO SPECULATION BUY

ONDOUSDT 📉 4H Perpetual LONG Entry 0.4054 SL 0.4606 TP 0.3888 I have had a career as a technical analyst for 3 years at an investment management company. To get special access, forex signals, crypto, commodities or investment advice, please contact me on Instagram instagram.com/ydnldn?igsh=MWpmbGdxcnBmcTl6MQ== Should you find this analysis insightful, I invite you to like or leave a comment. Constructive feedback and suggestions are greatly appreciated. For further analyses, please follow me at @ydnldn.
ydnldn
NLDN | PENDLE PERPETUAL

PENDLEUSDT 📉 4H Perpetual SHORT Entry 1.8727 SL 2.0724 TP 1.6565 I have had a career as a technical analyst for 3 years at an investment management company. To get special access, forex signals, crypto, commodities or investment advice, please contact me on Instagram instagram.com/ydnldn?igsh=MWpmbGdxcnBmcTl6MQ== Should you find this analysis insightful, I invite you to like or leave a comment. Constructive feedback and suggestions are greatly appreciated. For further analyses, please follow me at @ydnldn.
ydnldn
NLDN | FILUSDT.P SPECULATION BUY
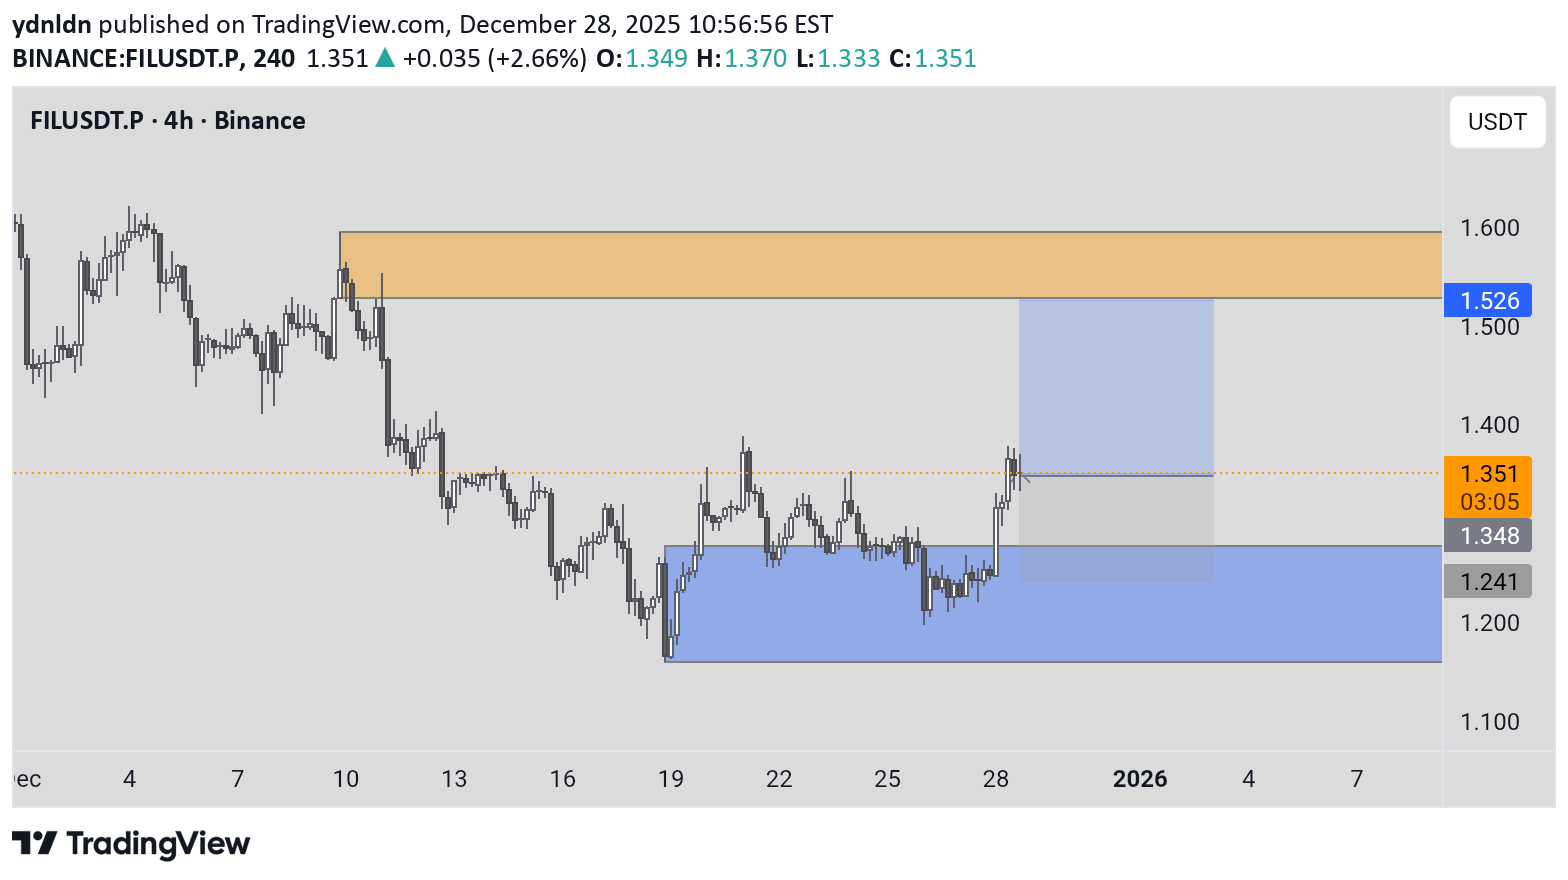
Assets & Trends: The chart shows Filecoin (FIL) in a recovery phase, heading towards an uptrend (bullish). Key Zones: Resistance (Above): Selling area in the range of 1,526 – 1,600 (orange box). Support (Below): Buying area in the range of 1,150 – 1,241 (blue box). Price Target: The trading plan indicates an upside target towards the 1,526 level. Current Conditions: The last price was at 1,347 and has just emerged from a consolidation phase. Should you find this analysis insightful, I invite you to like or leave a comment. Constructive feedback and suggestions are greatly appreciated. For further analyses, please follow me at @ydnldn.
ydnldn
NLDN | BITCOIN CYCLE

We can see from the previous cycle that BTC experienced a correction where the RSI gave a divergence signal, then the market changed to a downtrend. Just like now, BTC is providing data and signals from the RSI showing divergence signals, which has a big potential for BTC to experience a correction. Of course, the wise choice is to wait until a buying signal is formed again, this will take quite some time, it's best to be patient and don't rush into buying.
Disclaimer
Any content and materials included in Sahmeto's website and official communication channels are a compilation of personal opinions and analyses and are not binding. They do not constitute any recommendation for buying, selling, entering or exiting the stock market and cryptocurrency market. Also, all news and analyses included in the website and channels are merely republished information from official and unofficial domestic and foreign sources, and it is obvious that users of the said content are responsible for following up and ensuring the authenticity and accuracy of the materials. Therefore, while disclaiming responsibility, it is declared that the responsibility for any decision-making, action, and potential profit and loss in the capital market and cryptocurrency market lies with the trader.