
TheSignalyst
@t_TheSignalyst

What symbols does the trader recommend buying?
Purchase History
پیام های تریدر
Filter
TheSignalyst
راز بزرگ بازار: چگونه با تکرار روزانه به ثبات معاملاتی برسیم؟
Every trader wants consistency. But very few understand what consistency actually means. Consistency is not: ❌ winning every trade ❌ predicting the market ❌ avoiding losses ❌ being perfect Consistency is built long before you press the buy (or sell) button. Here’s what consistent traders all have in common: 1️⃣ They Repeat the Same Process Every Day! Consistency comes from repetition; not randomness. The best traders don’t have a different plan for every chart. They use the same routine, the same checklist, the same rules. Clarity replaces guesswork. 2️⃣ They Trade Only When Their System Shows Up! Consistency is not about taking more trades. It’s about taking only the trades that match your edge. No signal = no trade. No confluence = no risk. No clarity = no entry. Most inconsistency comes from forcing trades that never belonged in the plan. 3️⃣ They Accept Losses Without Breaking Structure! A consistent trader still loses, they just don’t fall apart when it happens. ❌They don’t double their risk. ❌ They don’t chase entries. ❌ They don’t change strategy mid-trade. They take the loss the same way they take the win: within the system. 4️⃣ They Focus on Long-Term Data, Not Single Trades! You can’t judge a strategy by one day, one week, or even one month. Consistency is measured across: ✔ dozens of trades ✔ multiple cycles ✔ all market conditions Professionals think in probabilities. Beginners think in outcomes. The Real Secret? Consistency is not an ability. It’s a decision you make every day: ➡️ Follow your rules ➡️ Manage your risk ➡️ Trade your edge ➡️ Ignore the noise When your habits become consistent, your results eventually follow. ⚠️ Disclaimer: This is not financial advice. Always do your own research and manage risk properly. 📚 Stick to your trading plan regarding entries, risk, and management. Good luck! 🍀 All Strategies Are Good; If Managed Properly! ~Richard Nasr
TheSignalyst
تکرار تاریخ در اتریوم (ETH): آیا یک جهش بزرگ در راه است؟
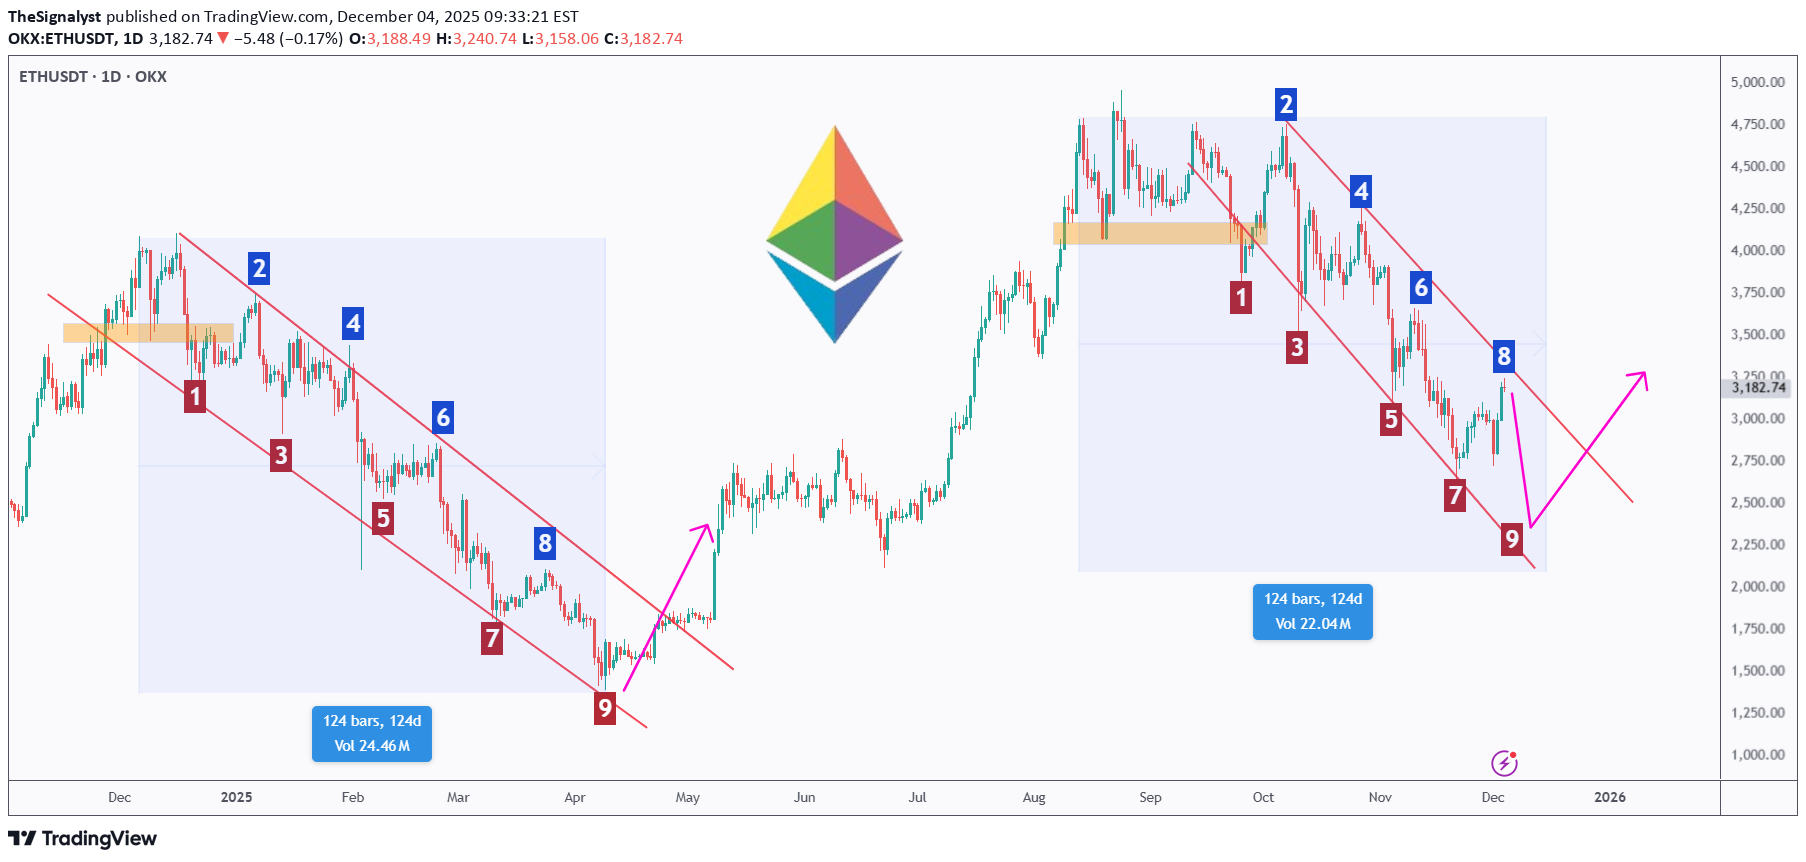
Ethereum is showing something extremely interesting… and extremely familiar. When we compare the previous corrective cycle to the current one, both have unfolded almost identically, not just in structure, but also in duration, each measuring around 124 days. 🌊Both cycles followed a clean 1-to-9 wave sequence inside a falling channel before ETH broke out aggressively. And right now, ETH is completing the same exact structure, approaching wave 9 once again. 🔄If history rhymes, and it often does in crypto, ETH may be preparing for a major impulsive phase, similar to what happened after the previous 124-day correction. From the lower bound of the channel, we will be looking for trend-following longs, anticipating a potential bullish reversal that mirrors the last breakout. Cycles don’t repeat perfectly… But they rhyme more often than people think. 📈✨ ⚠️ For now, the trend remains bearish, however, ETH would invalidate the entire bearish structure if the upper trendline breaks upward aggressively, signaling that bulls have fully taken over. Do you believe ETH is about to repeat its previous breakout? Share your view below! 👇🔥 ⚠️ Disclaimer: This is not financial advice. Always do your own research and manage risk properly. 📚 Stick to your trading plan regarding entries, risk, and management. Good luck! 🍀 All Strategies Are Good; If Managed Properly! ~Richard Nasr
TheSignalyst
راز پنهان موفقیت معاملهگران: الگویی که همه نادیده میگیرند!
Most traders focus on flags, wedges, double tops, fibs… But there’s a pattern far more powerful, and almost no one talks about it: -- The Behavior Pattern. -- 📈It’s not drawn on your chart. You can’t code it into an indicator. But it determines your success more than any formation. Here’s the pattern professionals watch, and beginners ignore: 1️⃣ Impulsive Behavior When price moves fast, traders move even faster. FOMO kicks in. Chasing begins. Risk is forgotten. Professional interpretation: ➡️ If emotions are impulsive, structure won’t be respected. Avoid trading in emotional markets unless you already have a plan. 2️⃣ Hesitation Behavior Price reaches your level. Your alert triggers. Everything lines up… and you still don’t enter. Why? Because hesitation is a sign your risk is unclear. Professional interpretation: ➡️ If hesitation appears, your plan isn’t ready. The chart is never the problem, the plan is. 3️⃣ Revenge Behavior One loss turns into five. You stop trading the chart and start trading your frustration. Professional interpretation: ➡️ If frustration is present, you’re trading without structure. Step away. Market will be here tomorrow. Why This Matters ⁉️ The market doesn’t punish bad trades. It punishes bad behavior. Your biggest losing streaks didn’t come from your strategy. They came from emotional patterns you didn’t recognize in real time. Once you learn to see these behavior patterns, your charts become clearer, your decisions simpler, and your risk finally makes sense. 🧠Final Thought Chart patterns tell you where the market might go. Behavior patterns tell you whether you’ll survive long enough to get there. Master both; and you’ll trade with the clarity most people never reach. ⚠️ Disclaimer: This is not financial advice. Always do your own research and manage risk properly. 📚 Stick to your trading plan regarding entries, risk, and management. Good luck! 🍀 All Strategies Are Good; If Managed Properly! ~Richard Nasr
TheSignalyst
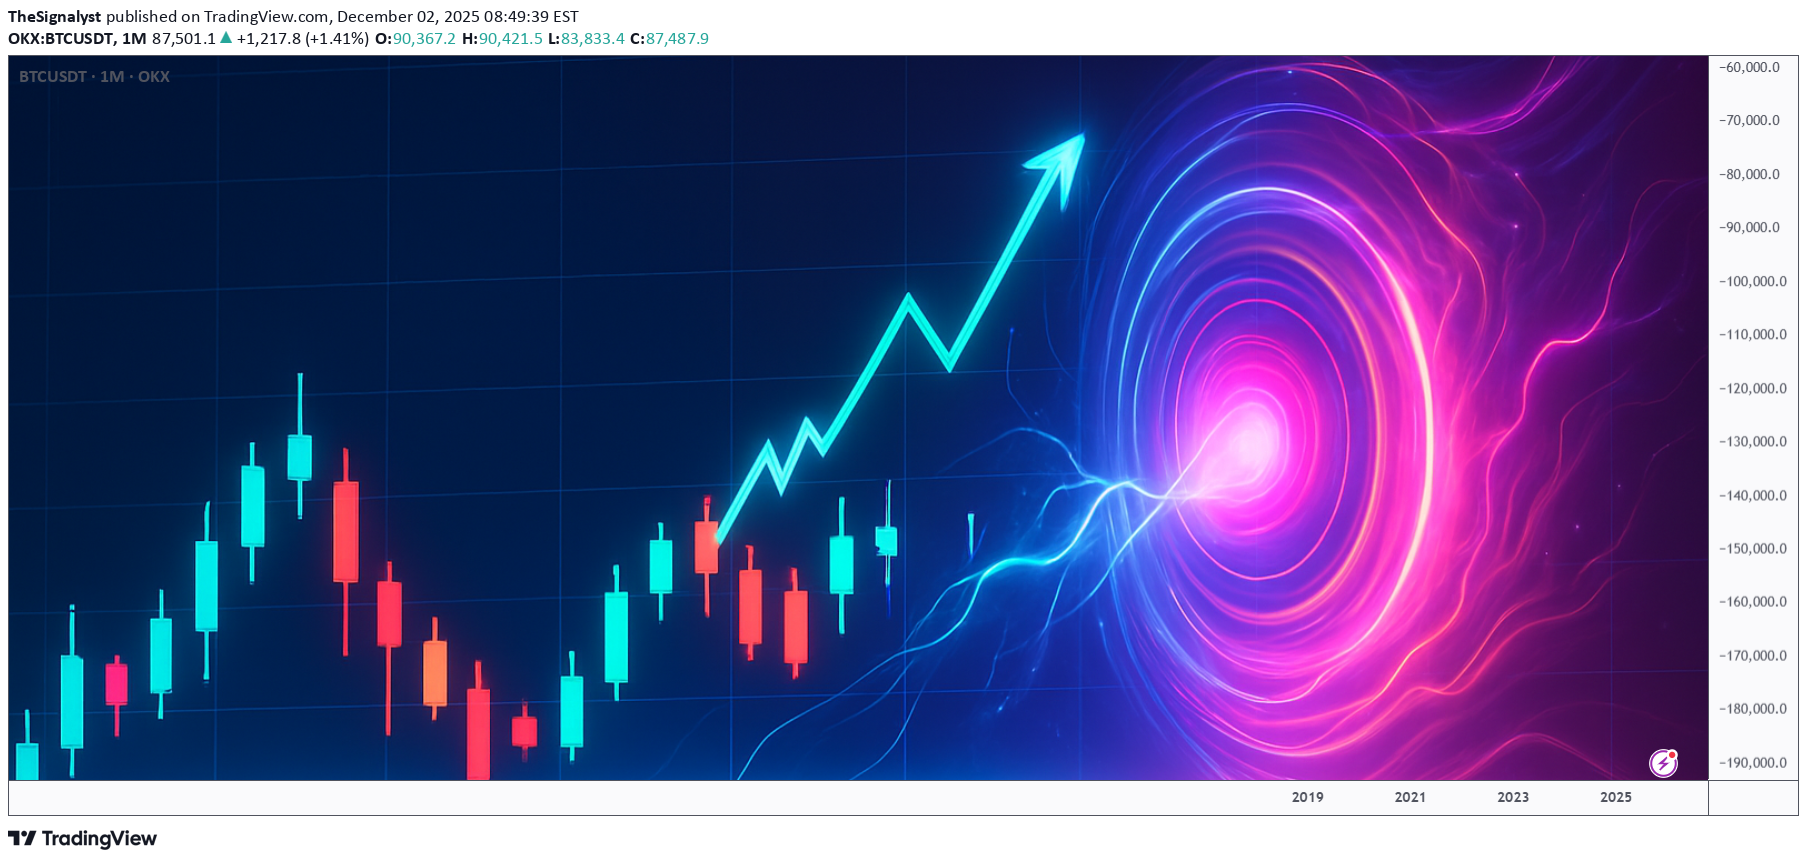
بیت کوین و آهنربای ۱۰۰ هزار دلاری: راز این منطقه مقاومتی چیست؟
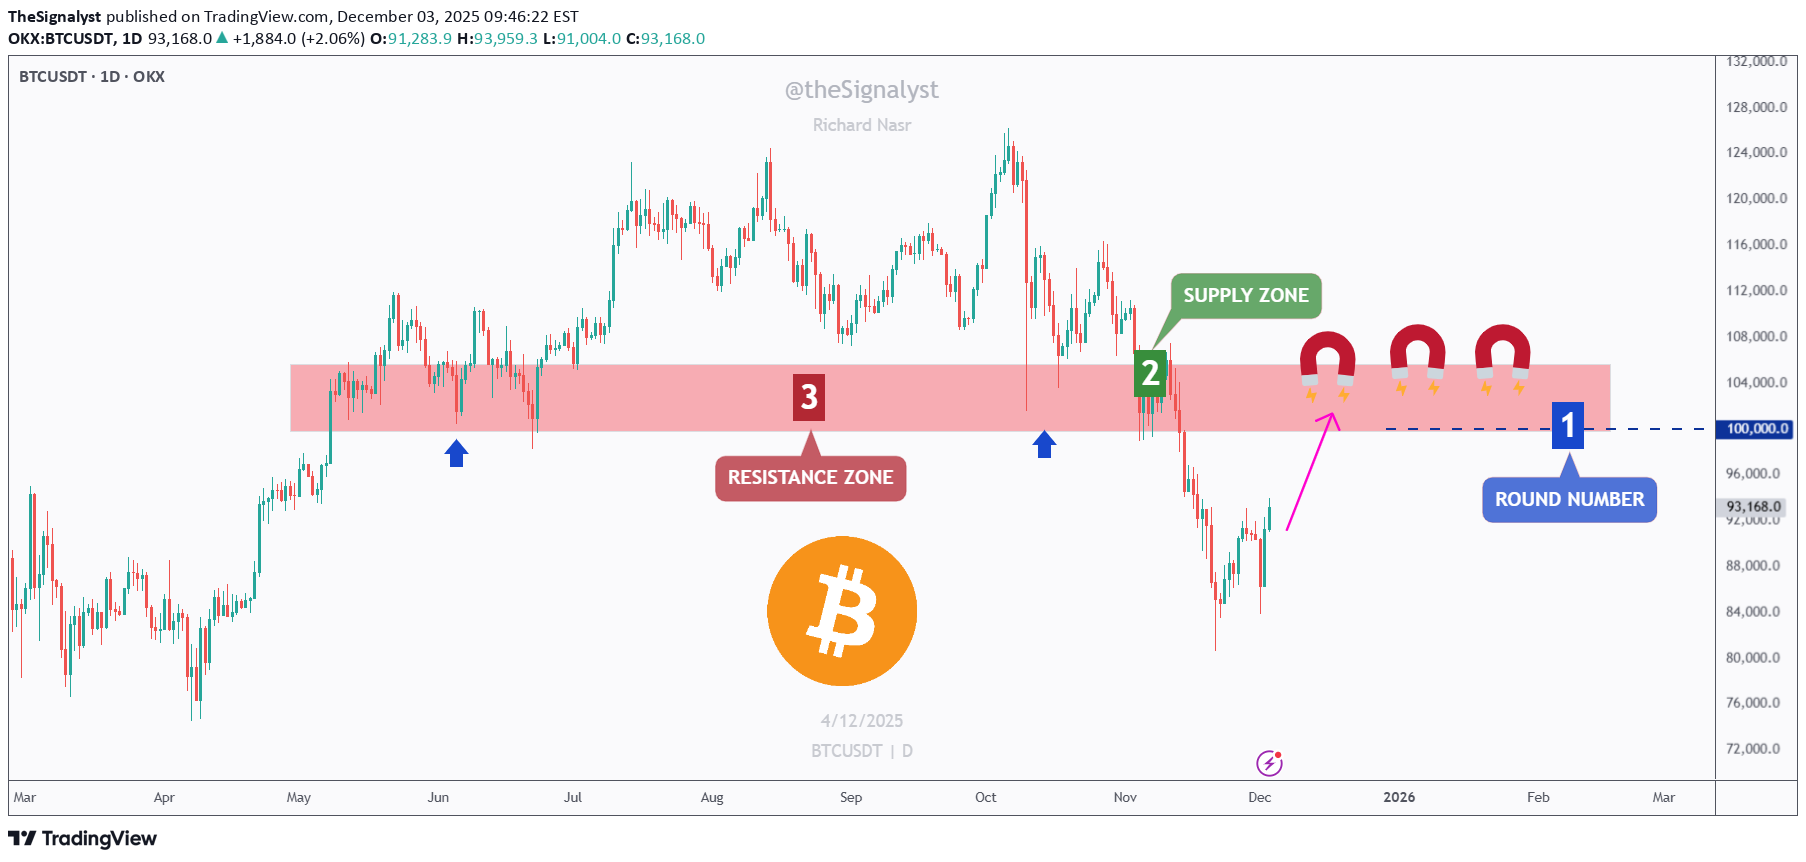
🧲🧲Bitcoin is aggressively climbing, and the chart makes one thing very clear, the red zone above is acting like a powerful magnet pulling price toward it. Here’s why: 1️⃣ 100k Round Number Major round numbers always attract liquidity. Traders, algorithms, and even long-term investors pay attention to them, making 100,000 a natural magnet for price. 2️⃣ Supply Zone This area hosted heavy selling in the past, meaning there’s unfilled liquidity sitting there. Markets tend to revisit such zones to rebalance orders. 3️⃣ Major Resistance Zone Historically, this level acted as a ceiling multiple times. What was once previous resistance often turns into the next major test. With all three factors stacked together, the entire zone becomes a high-gravity area, and BTC tends to get "pulled" toward such confluences. 🏹As long as BTC maintains its short-term momentum, a retest of this magnet zone becomes the most likely scenario. After that? The reaction will reveal whether the bulls can finally break through, or get rejected again. Will Bitcoin reclaim the magnet zone this time? 🤔 ⚠️ Disclaimer: This is not financial advice. Always do your own research and manage risk properly. 📚 Stick to your trading plan regarding entries, risk, and management. Good luck! 🍀 All Strategies Are Good; If Managed Properly! ~Richard Nasr
TheSignalyst
معاملهای که انجام نمیدهید: راز بزرگ معاملهگران حرفهای!
Most traders focus on entries, strategies, indicators, patterns… But the truth is: your biggest edge is avoiding low-quality trades. The market rewards patience far more than prediction. Here’s the framework professional traders use to filter noise from opportunity, something 90% of traders overlook: 1. The Market Must Be Aligned Before placing any trade, ask one question: “Is the market trending, ranging, or correcting?” Your strategy only works in the right environment. A breakout strategy fails in a choppy range. A mean-reversion setup dies in a strong trend. Identify the environment first, then choose the setup. 2. Your Levels Must Be Significant True opportunity comes from reaction points, not random prices. Look for: - Major swing highs and lows - Weekly or monthly levels - Clean trendlines with multiple touches - Areas where price previously paused, reversed, or consolidated If the market isn’t near one of these levels, you’re trading in the middle, where noise lives. 3. Your Risk Must Make Sense A good setup with a bad risk-to-reward is a bad trade. Professionals only act when: - The stop-loss is logical (protected behind structure) - The target is realistic - The reward outweighs the risk If the math doesn’t work, the trade doesn’t happen. 🧠 The Hidden Lesson Great traders don’t trade more, they filter more. Your account grows not by finding better entries, but by avoiding the trades that drain your capital, energy, and confidence. Master the art of waiting, and your strategy will finally start working the way it was designed to. ⚠️ Disclaimer: This is not financial advice. Always do your own research and manage risk properly. 📚 Stick to your trading plan regarding entries, risk, and management. Good luck! 🍀 All Strategies Are Good; If Managed Properly! ~Richard Nasr
TheSignalyst
مهمترین مهارت معاملهگری: خواندن بازار بدون سوگیری! (۳ داستان مخفی بازار)
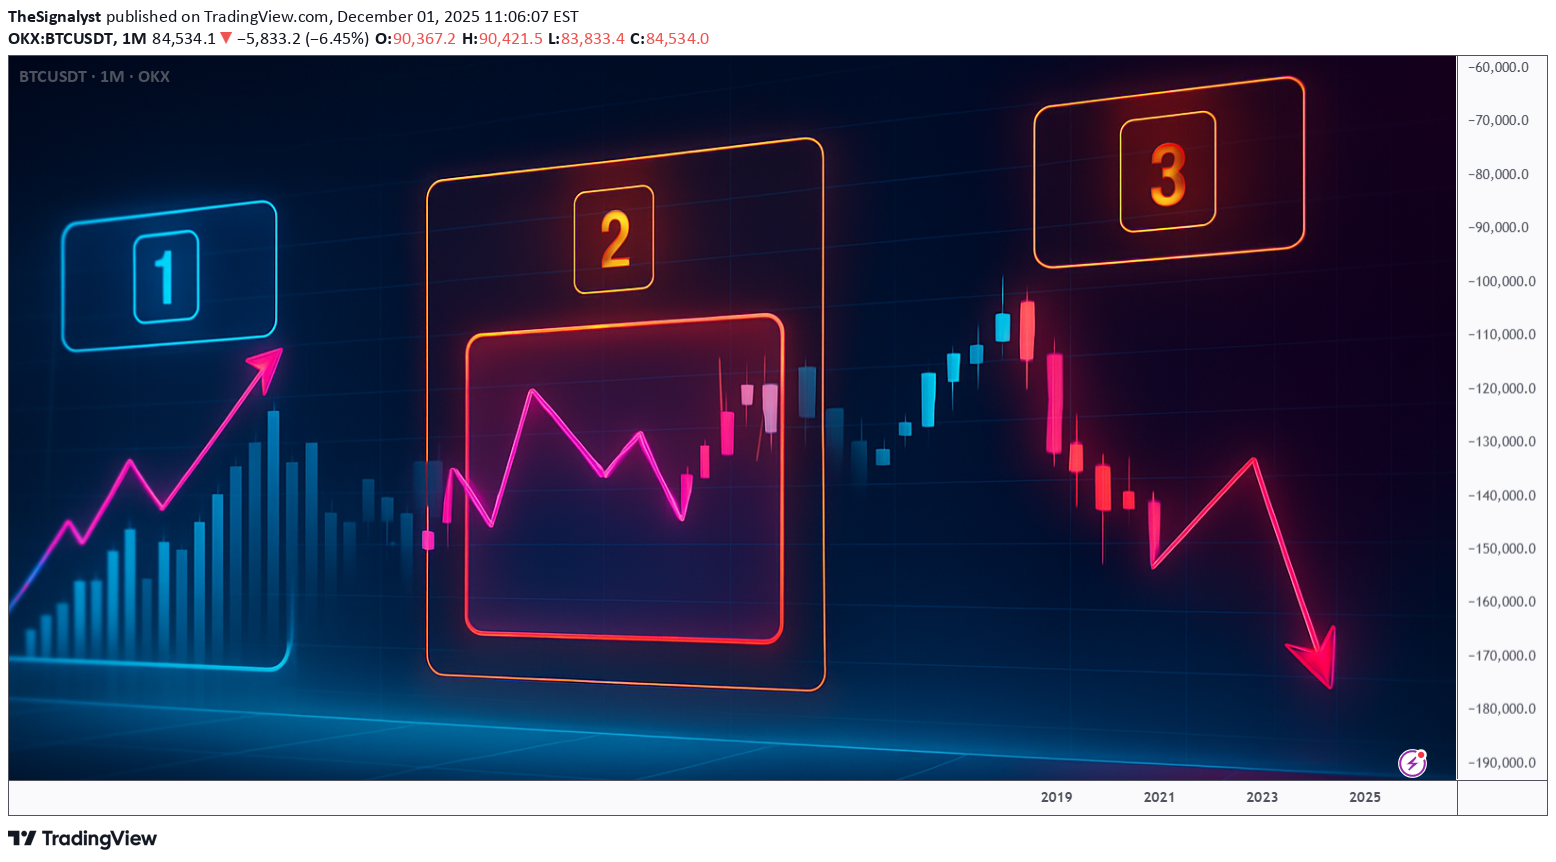
Most traders focus on indicators, patterns, and strategies… But very few focus on the skill that actually moves the needle: Learning to read the market without forcing your bias onto the chart. Here’s the truth 👇 When you zoom out and remove the noise, the market is always telling one of only three stories: 📘 1. Impulse → Market is moving with strength An impulse leg is a clear, strong movement in one direction. Candles are decisive. Pullbacks are shallow. Speed is visible. When you identify an impulse, the message is simple: “Don’t fight me, follow me.” This is where continuation trades thrive. 📔 2. Correction → Market is taking a breath A correction is messy, slow, overlapping price action. The market is not reversing; it’s reloading. Most beginners confuse corrections with trend reversals… Professionals don’t. The key question becomes: “Where will this correction end?” Because that’s where the next impulse usually begins. 📕 3. Reversal → Structure shifts, and momentum dies A reversal is structural. You see new lower lows in an uptrend, or new higher highs in a downtrend. Momentum slows. Failed impulses appear. Trendlines break. A true reversal is never a single candle; It’s a story told over multiple chapters. 🔑 The Skill: Listening Instead of Predicting Most traders lose because they try to predict what comes next. Professionals focus on reading what’s happening now. Ask these questions every time you open a chart: - Is momentum increasing or decreasing? - Are corrections getting deeper or shallower? - Is structure still intact? - Which key level holds all the power? Master these, and you’ll start seeing the market in HD. 💡 Why This Matters Your entries, exits, and risk management improve automatically when you can answer one simple question: “Is the market impulsive, corrective, or reversing?” This removes emotional trading, kills hesitation, and builds confidence, because you’re no longer guessing... You're listening. 🤔 Final Thought Strategies don’t fail because they’re bad. Strategies fail because traders apply them at the wrong time. Read the market first. Trade second. ⚠️ Disclaimer: This is not financial advice. Always do your own research and manage risk properly. 📚 Stick to your trading plan regarding entries, risk, and management. Good luck! 🍀 All Strategies Are Good; If Managed Properly! ~Richard Nasr
TheSignalyst
حمایت اول، شکست دوم؛ نقشه راه صعودی XRP چیست؟
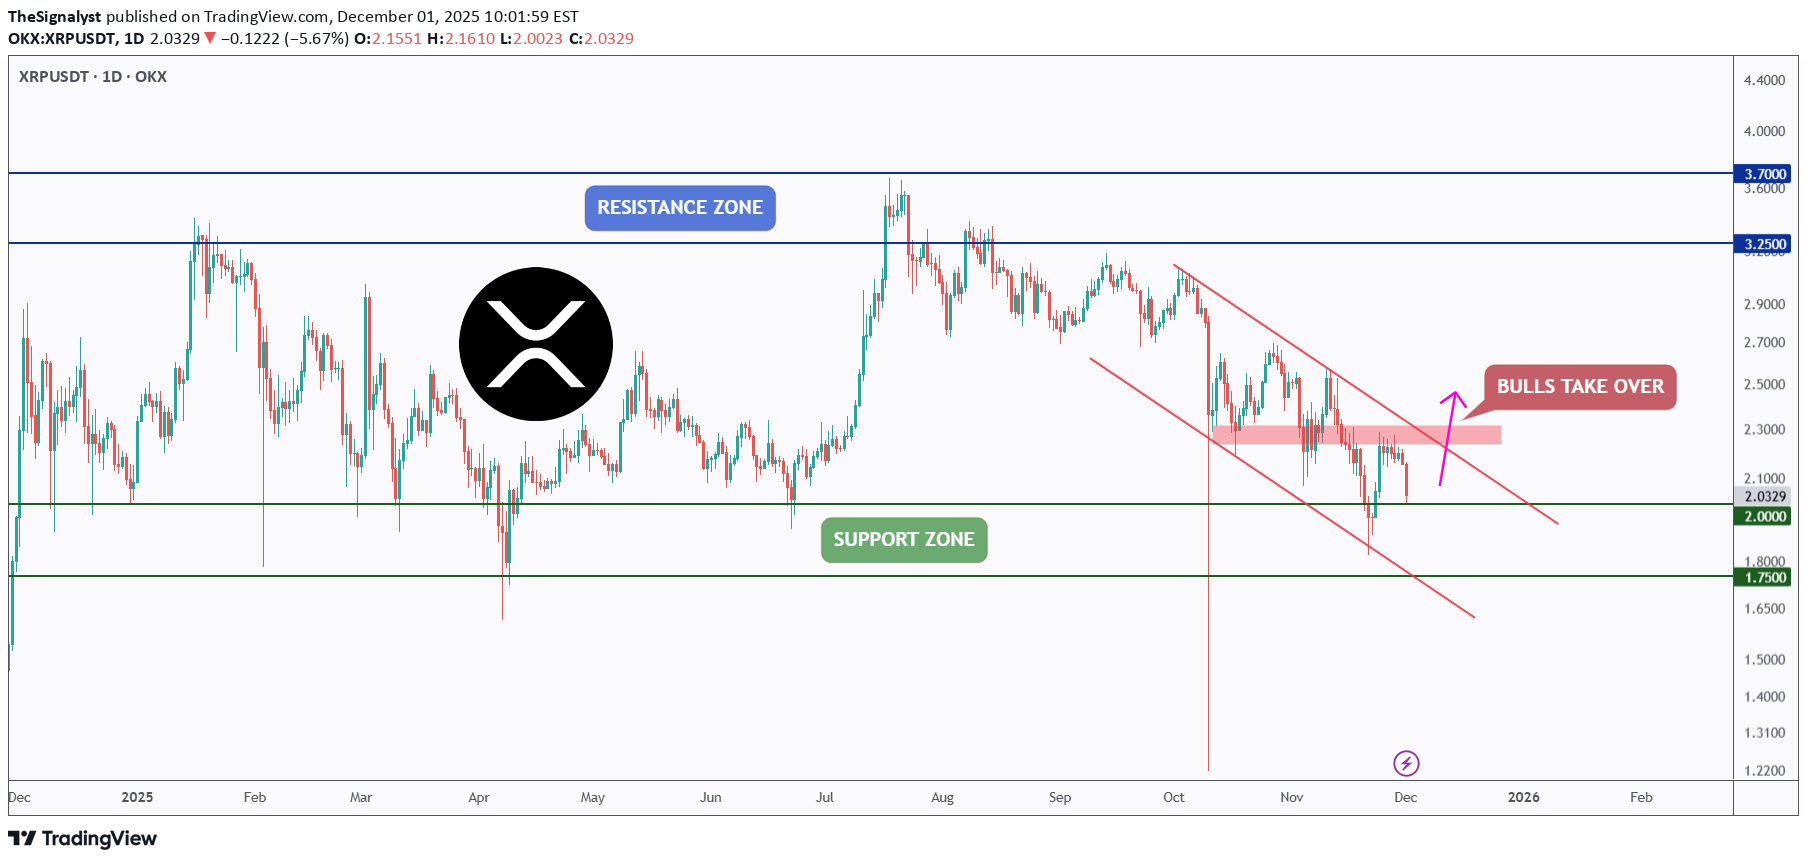
📦XRP has been holding well above its key support zone , and as long as this level continues to act as a floor, we will be looking for long setups. Buyers have defended this zone multiple times, making it a critical area for a potential bullish reaction. 🏹However, for the bulls to fully take over, XRP needs more than just a bounce. A confirmed break above the falling channel and the last major high in red is needed to shift the momentum and open the door for a larger bullish leg. Until then, the plan remains simple: Support holds → look for longs. Structure breaks → bulls take control. Will XRP finally break free from this falling channel? 🤔 ⚠️ Disclaimer: This is not financial advice. Always do your own research and manage risk properly. 📚 Stick to your trading plan regarding entries, risk, and management. Good luck! 🍀 All Strategies Are Good; If Managed Properly! ~Richard Nasr
TheSignalyst
مهارت پنهان معاملهگران بزرگ: صبر، نه نمودار!
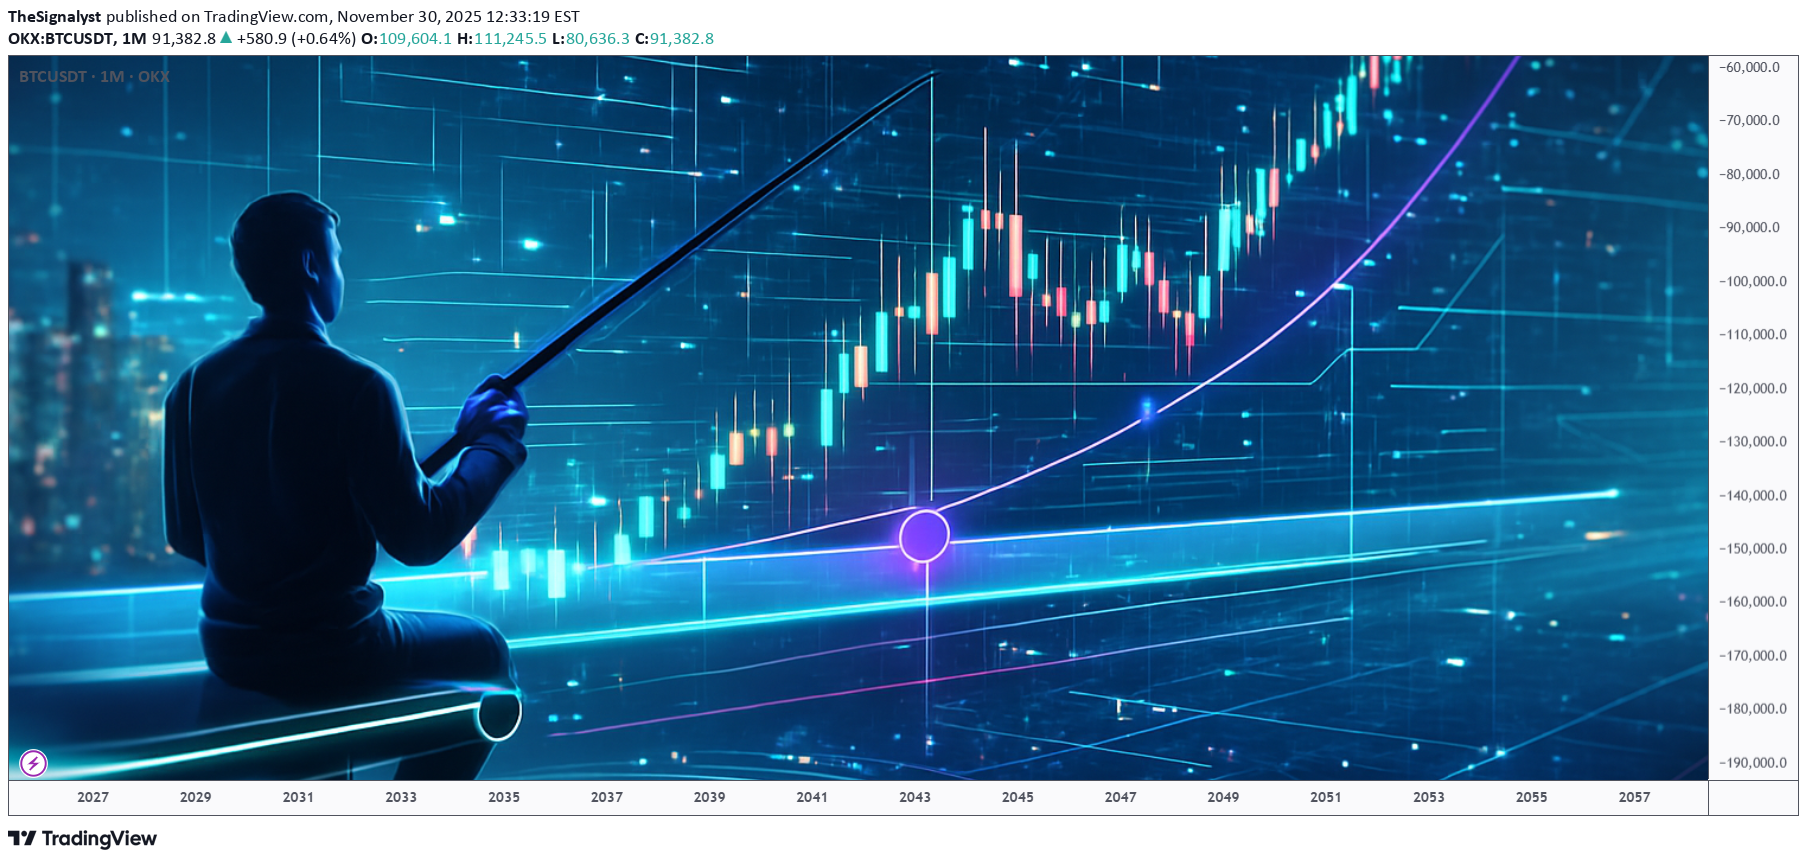
Most traders spend years perfecting chart patterns, indicators, and entries… Yet only a handful ever master the real skill that separates professionals from the rest, the art of waiting. 📉 Anyone can draw support and resistance. 📈 But not everyone can wait for price to reach them. The market rewards patience, not predictions. It’s not about catching every move, it’s about being ready when your setup aligns perfectly. That’s when you strike. That’s when probability works for you, not against you. Think of trading like fishing 🎣: You don’t chase the fish, you position your line where it’s most likely to bite, then you wait. So next time you feel the urge to jump in early, remind yourself: You’re not just a trader. You’re a waiter, paid in precision and patience. 📚 Key takeaway: Great traders don’t predict, they prepare. They let the market move first, then respond with clarity. ⚠️ Disclaimer: This is not financial advice. Always do your own research and manage risk properly. All Strategies Are Good; If Managed Properly! ~Richard Nasr
TheSignalyst
اتریوم در آستانه خیزش بزرگ: منتظر حمایت کلیدی برای ورود صعودی!
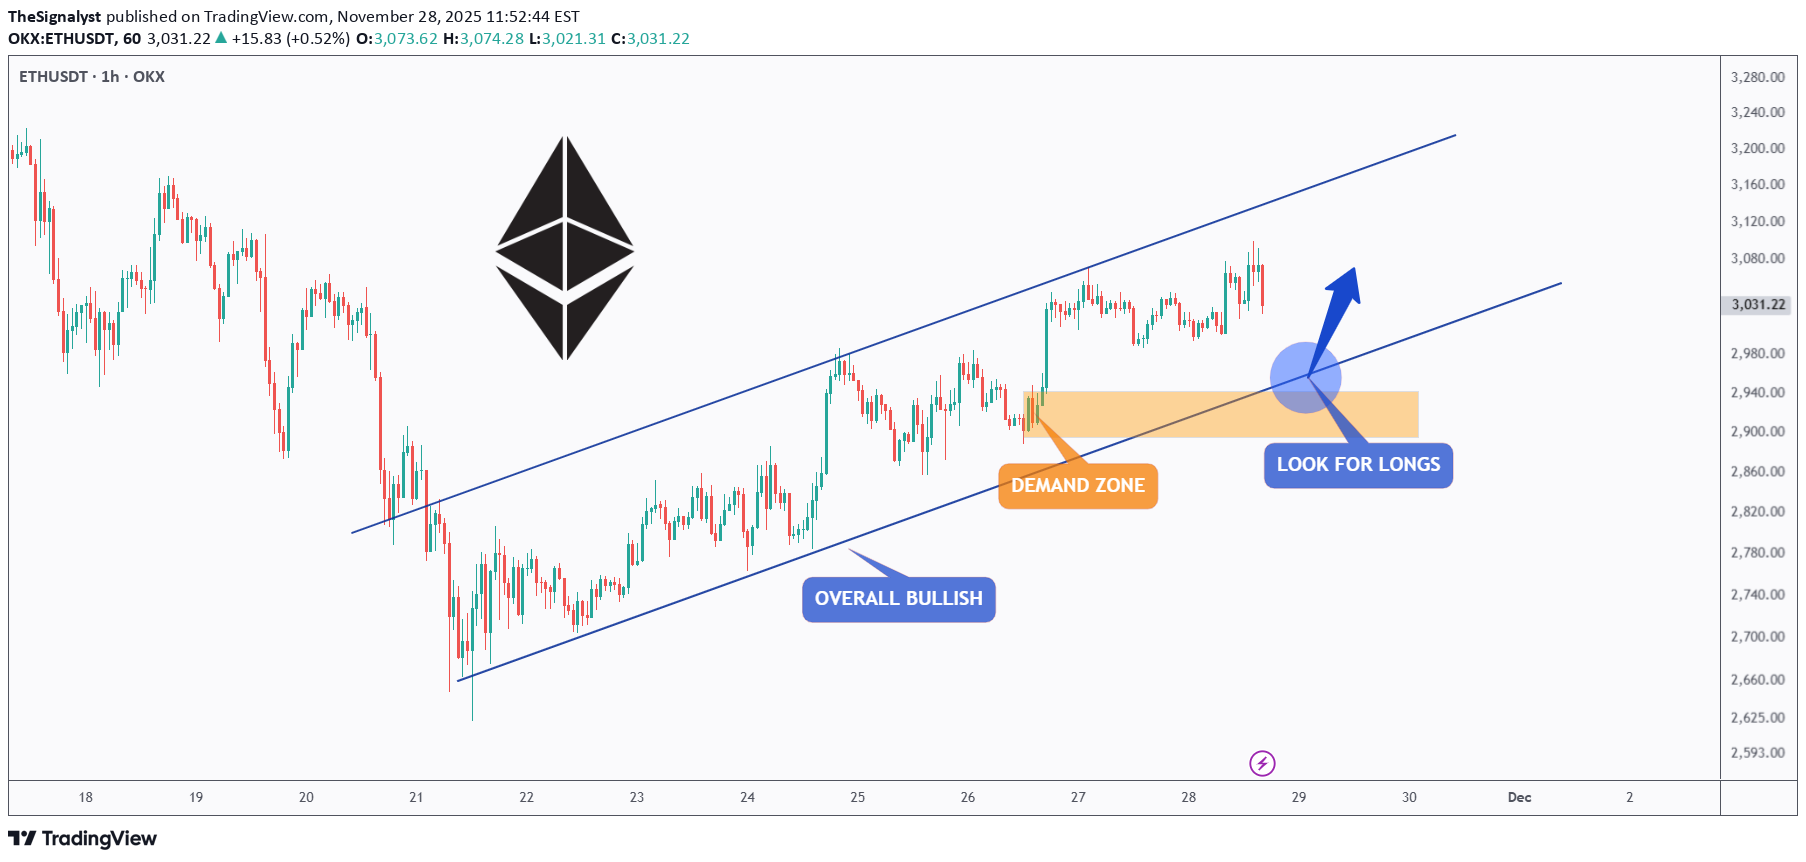
📈ETH remains overall bullish, moving steadily inside its rising channel. Every dip toward the lower bound has acted as a clean continuation point for the next push upward. 🏹As price pulls back , we will be looking for long setups once ETH retests the intersection of the lower trendline and the demand zone. This confluence area has been respected multiple times, making it a high-probability level for trend-following entries. ⚔️As long as ETH holds above this orange zone, the bullish structure remains intact, and the next impulse toward the upper channel boundary becomes the most likely scenario. Only a break below the demand zone would weaken the bullish outlook. Now we wait for the retest… then let the structure guide the entries. 🤔 ⚠️ Disclaimer: This is not financial advice. Always do your own research and manage risk properly. 📚 Stick to your trading plan regarding entries, risk, and management. Good luck! 🍀 All Strategies Are Good; If Managed Properly! ~Richard Nasr
TheSignalyst
حمایت تاریخی بیت کوین: آیا خریداران باز هم از این سطح دفاع میکنند؟
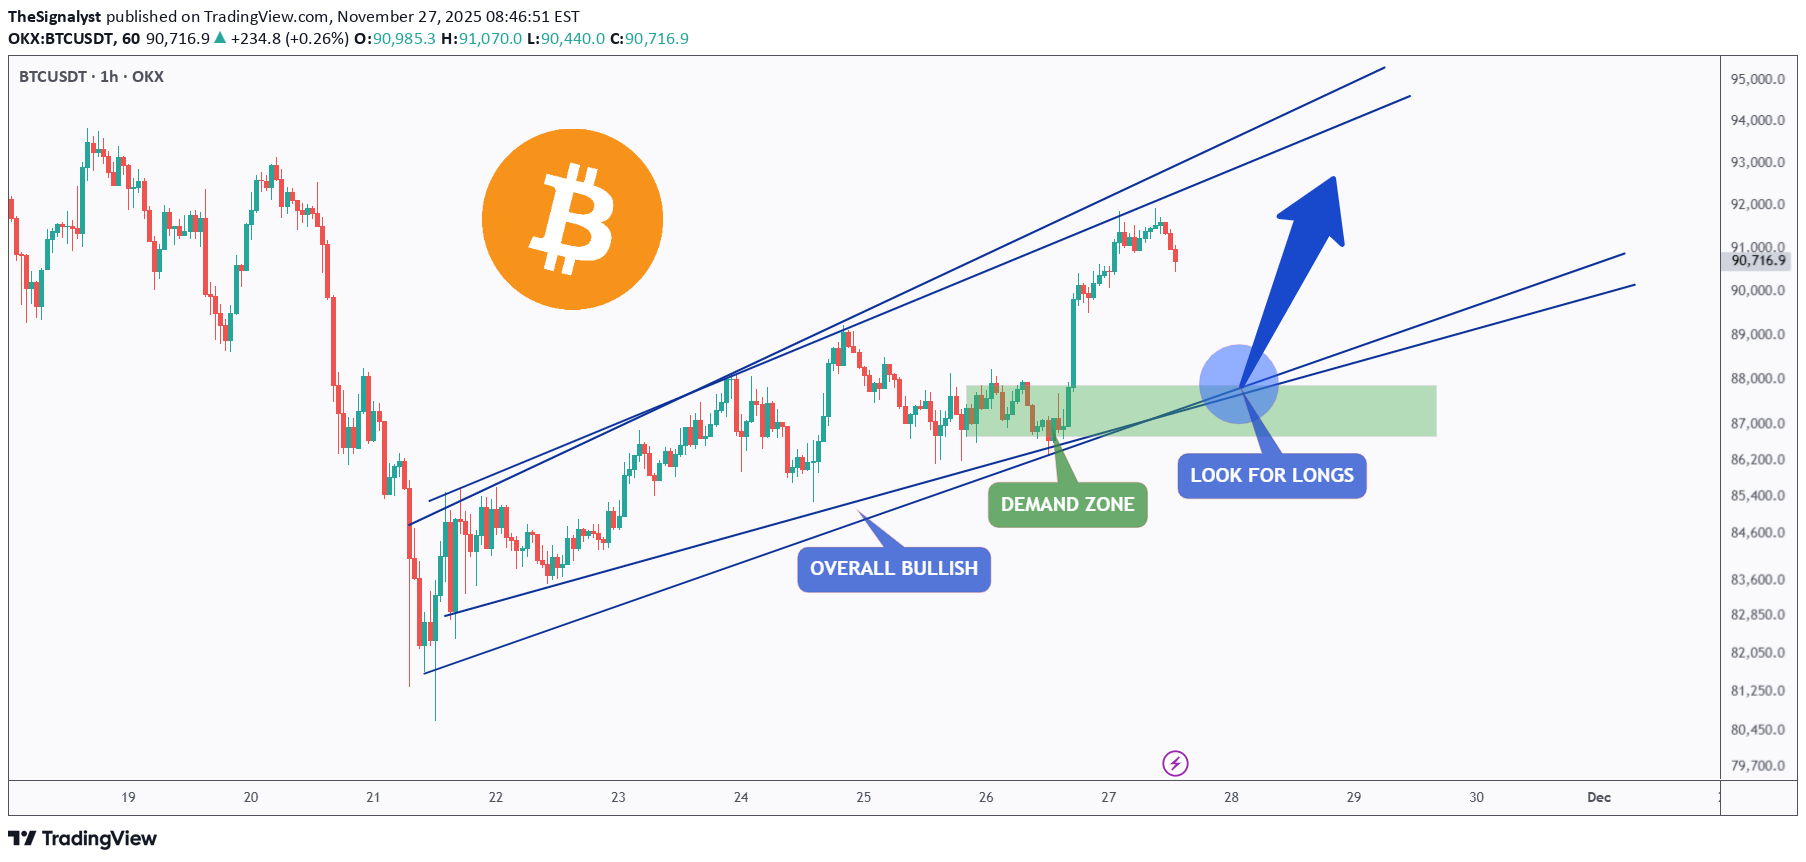
📈Bitcoin remains overall bullish, trading cleanly inside its rising channel. Each dip toward the lower bound has acted as a strong springboard for the next impulsive move, showing clear demand from buyers. ⚔️As BTC approaches the lower trendline of the channel and the green demand zone, we will be looking for trend-following longs. This confluence area has held multiple times and continues to act as a key decision point for market structure. 🏹As long as BTC remains above this zone , the bullish scenario remains intact, and another push toward higher highs becomes the most likely outcome. Only a break below the demand zone would weaken the bullish outlook. Now it’s all about the retest… will the bulls defend structure once again? 🤔 ⚠️ Disclaimer: This is not financial advice. Always do your own research and manage risk properly. 📚 Stick to your trading plan regarding entries, risk, and management. Good luck! 🍀 All Strategies Are Good; If Managed Properly! ~Richard Nasr
Disclaimer
Any content and materials included in Sahmeto's website and official communication channels are a compilation of personal opinions and analyses and are not binding. They do not constitute any recommendation for buying, selling, entering or exiting the stock market and cryptocurrency market. Also, all news and analyses included in the website and channels are merely republished information from official and unofficial domestic and foreign sources, and it is obvious that users of the said content are responsible for following up and ensuring the authenticity and accuracy of the materials. Therefore, while disclaiming responsibility, it is declared that the responsibility for any decision-making, action, and potential profit and loss in the capital market and cryptocurrency market lies with the trader.