
ibrahimakkaya
@t_ibrahimakkaya

What symbols does the trader recommend buying?
Purchase History
پیام های تریدر
Filter
ibrahimakkaya
تشکیل دوقلوی کف در اتریوم: آیا زمان بازگشت فرا رسیده است؟
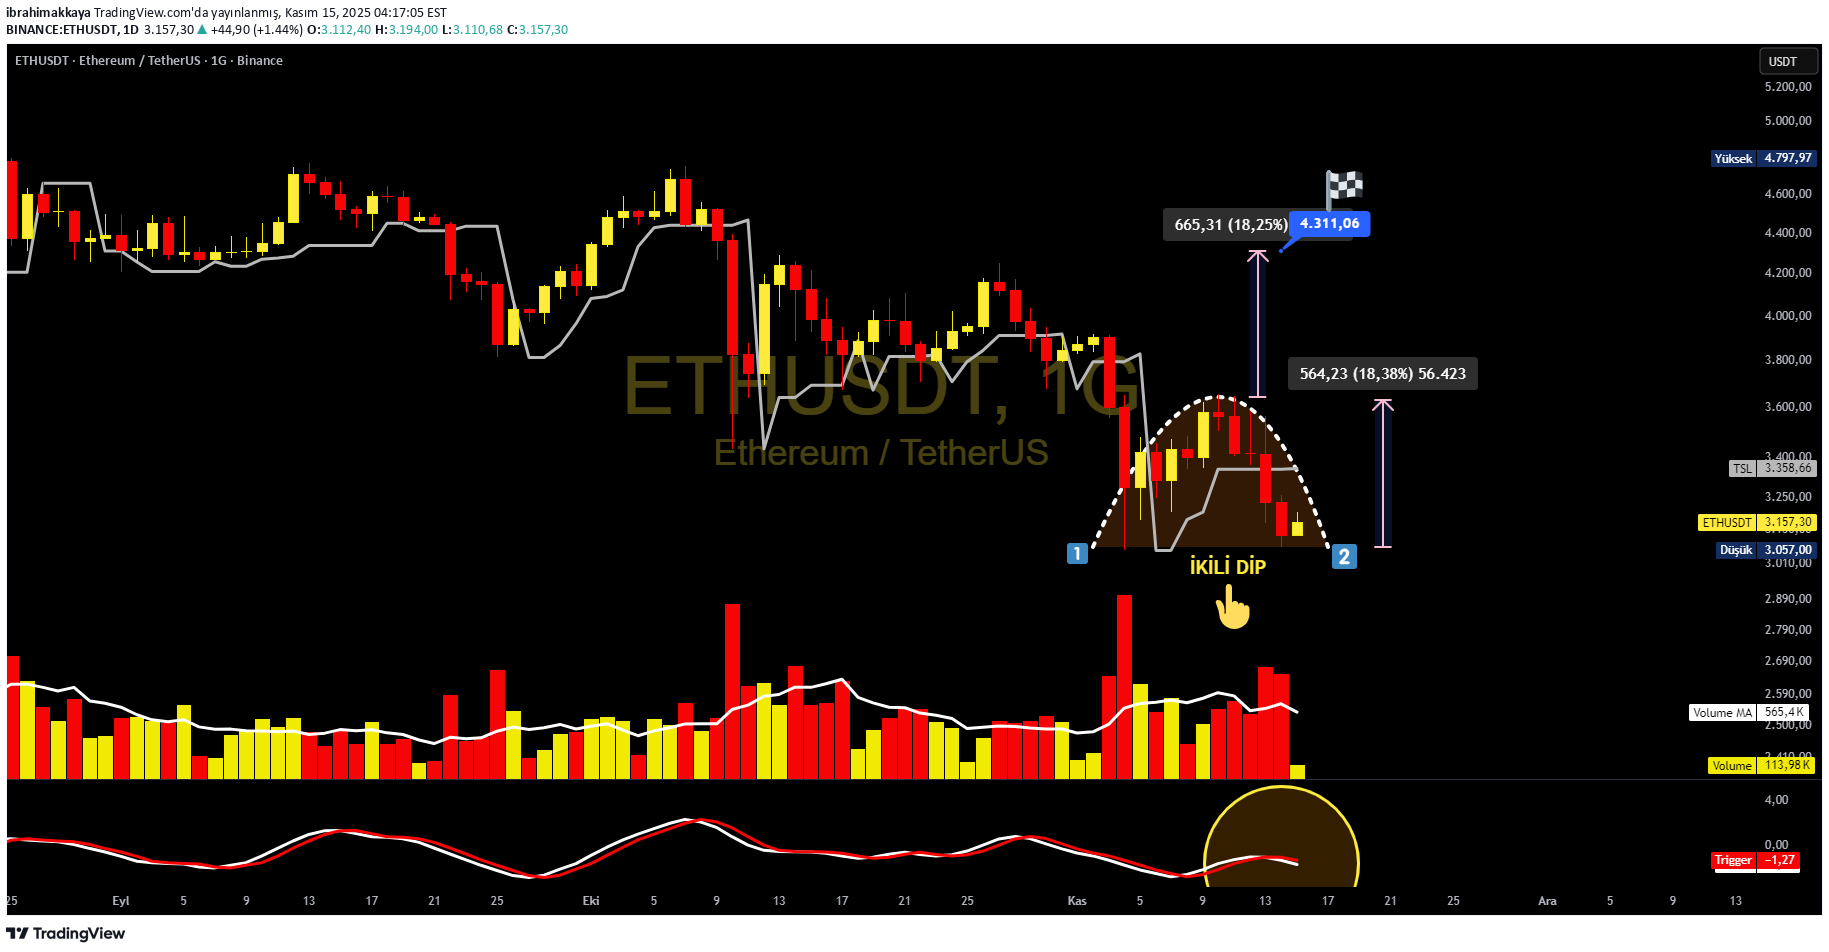
DOUBLE BOTTOM Formation stands out.. The return must be from these levels and the formation should also be completed..!!
ibrahimakkaya
PENDLE
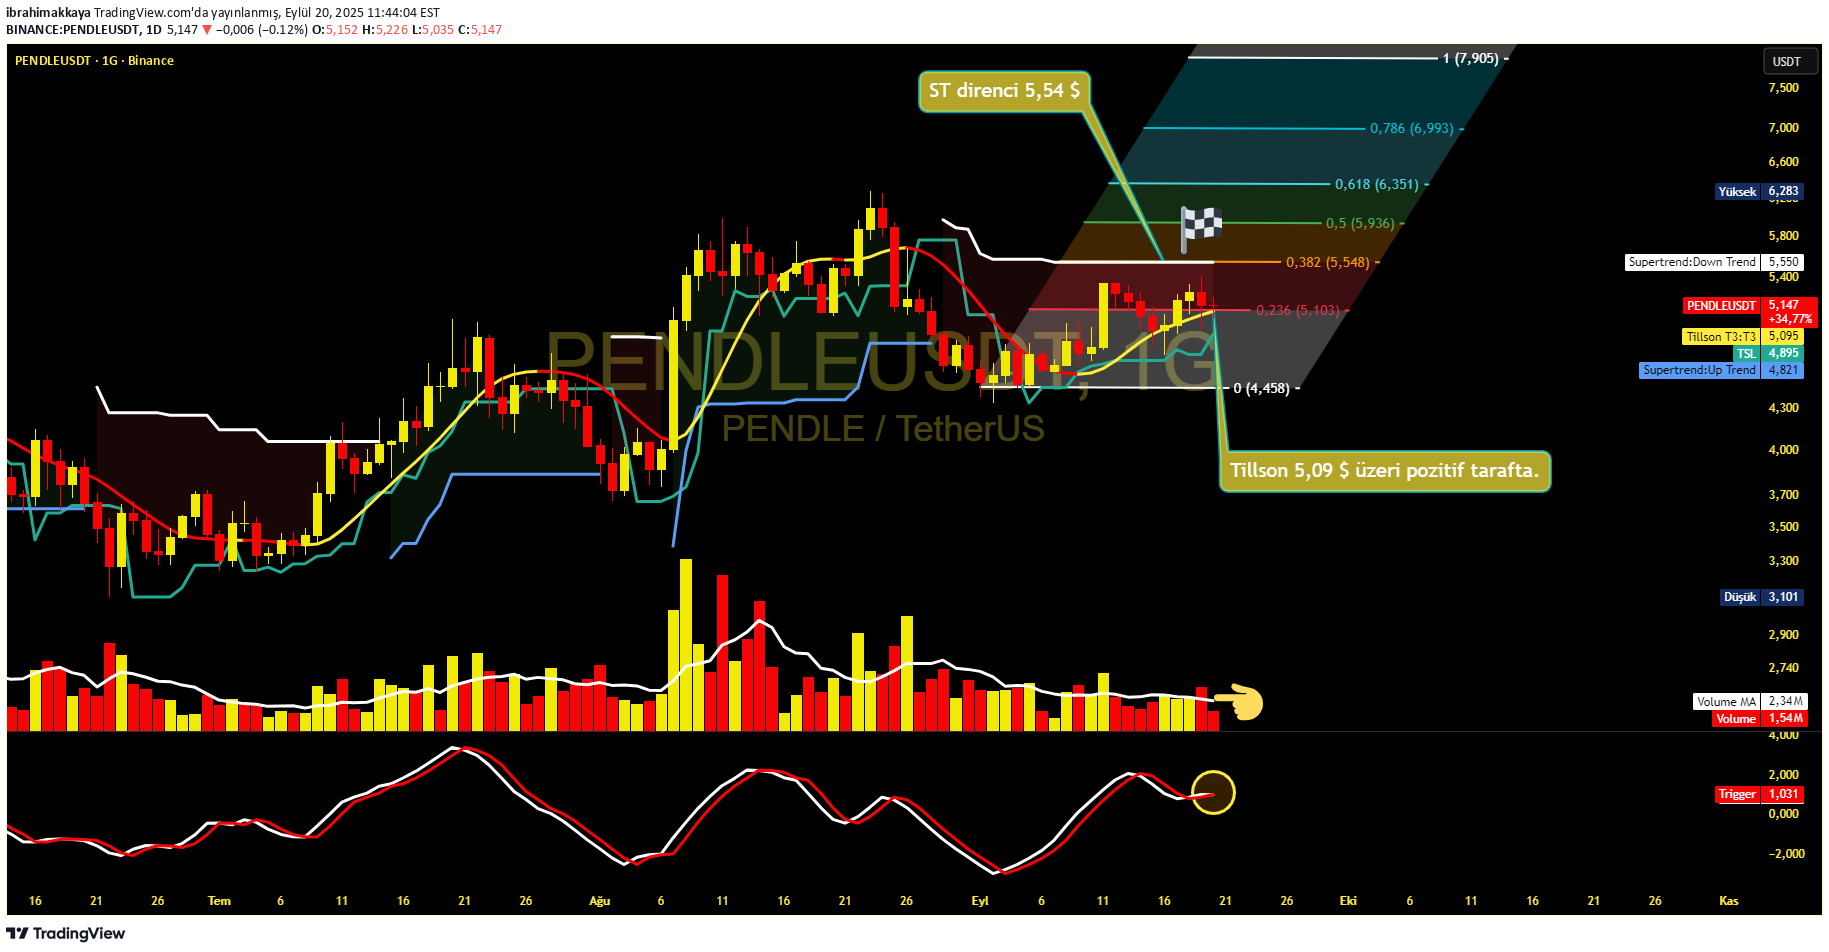
📊 Let's look at the technical analysis: #Pendle/USDT graph in a critical area. 📈 General view Tillson T3 level: $ 5.09 👉 👉 is now above the price. The fact that it remains above this level means positive signal. Supertrend resistance: 5,54 $ → If this level is exceeded, the rise confirmation is stronger. Gated flag target 🏁: $ 7,90 (Fibo 1.00 level). 🔎 Indicators Volume (Volume): There is a horizontal but recovery signal in recent days. Volume increase is required for upward movement 📌. Display: The intersection movement from the bottom has started 🚀. This shows that buyers are activated. Supertrend: Closing over $ 5,54 will be a sign of a new trend. ✅ Summary Izsüren stop (🛡️): $ 4,89 (TSL level). Positive view: It will continue at closing over $ 5.09. FIRST TARGETS: 5,54 → 6,35 → 7,90 $ 🏁 🔔 In short: When Tillson and Supertrend resistors are exceeded, a strong trend return will be confirmed. If the volume increase supports this movement, the target of $ 7,90 comes up.
ibrahimakkaya
NEARUSDT
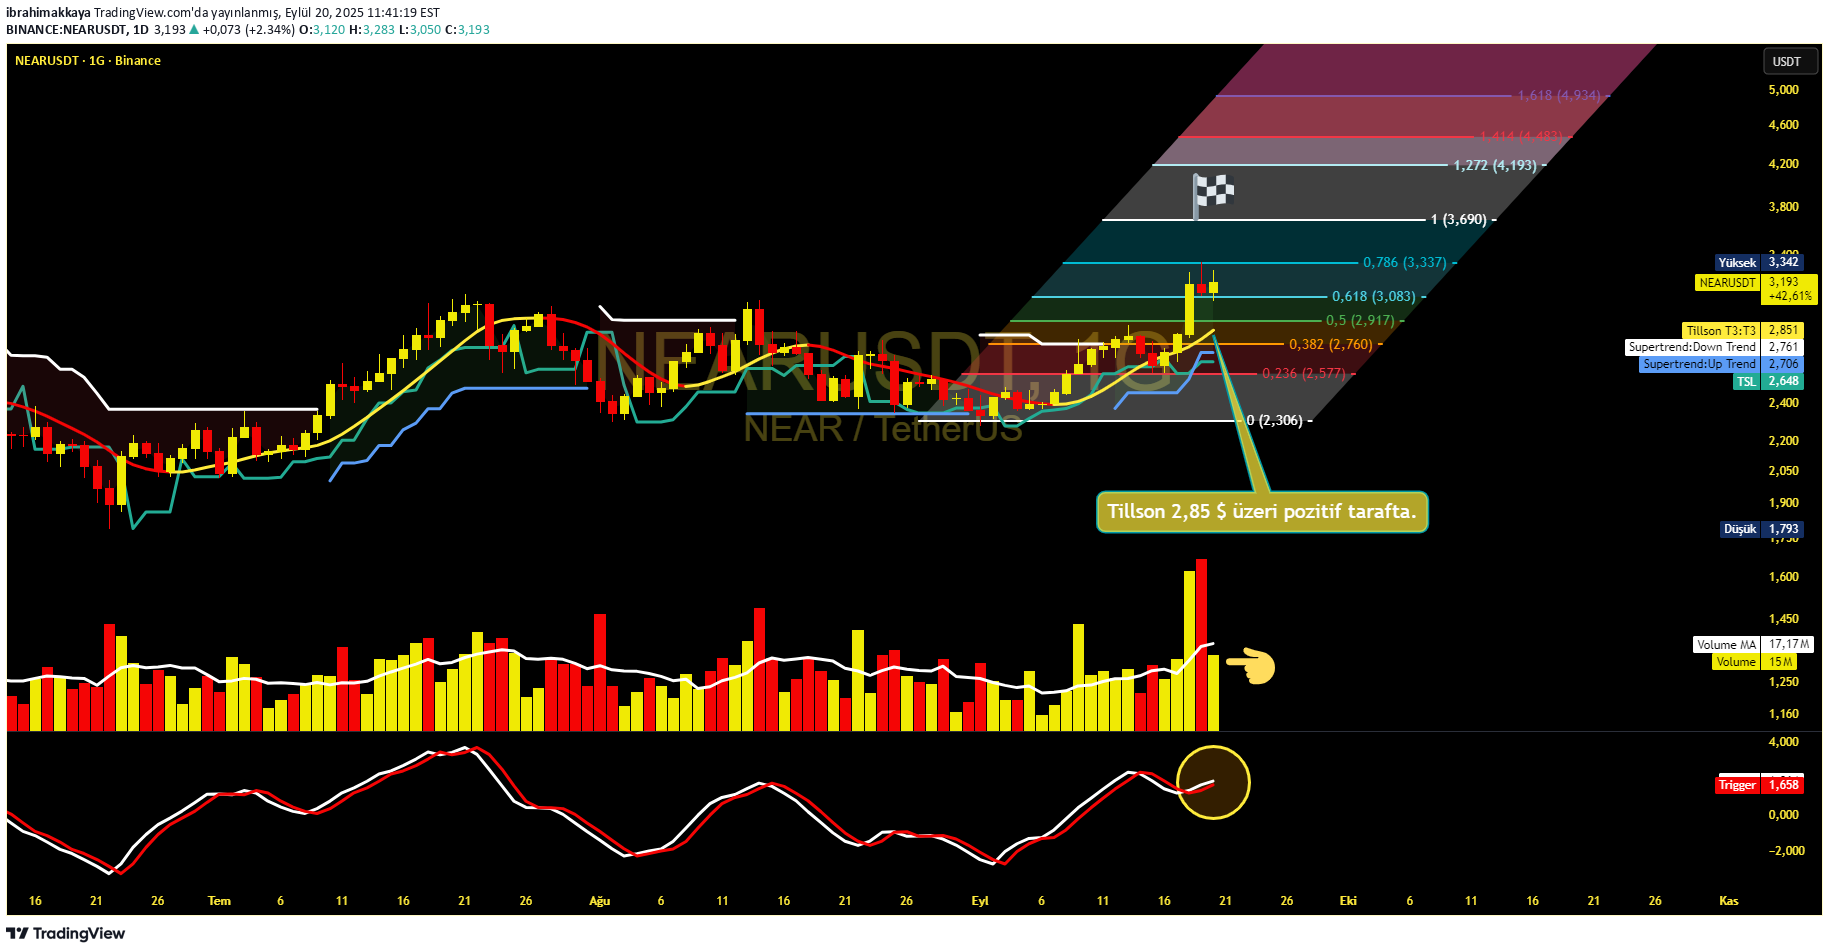
📊 Let's look at the technical analysis: #Near/USDT graph gives a very remarkable look. 📈 General view Tillson T3 level: $ 2.85 👉 The price ($ 3,19) is currently traded in the positive area. Supports: $ 2.64 (TSL) and $ 2.30 (Fibo Bottom). Resistances: $ 3.69 - $ 3.83 - $ 4,19 $ important. 🔎 Indicators Volume (Volume): There is a significant increase in the last candles 📌. This shows that the rise is supported by strong buyers. MACD (below): The upstairs intersection continues clearly 🚀. Momentum is on the positive side. Supertrend: Trend confirmation over $ 2.76 ✅. 🎯 Target & 🛡️ Stop Grand Flag Target (🎯🏁): $ 3,69 is the first target; The top levels of $ 4,19 and $ 4.93 at the top. IZSUREN STOP (🛡️): The positive appearance is maintained as long as it remains above the Tillson level of $ 2.85. ✅ Summary In the short term: Potential can continue up to $ 3.69. In the medium term: $ 4,19 and above can be targeted. Risk Management: Stop under $ 2.85. 🔔 In short: With the volume support, the rise trend is strengthened. The indicators support buyers.
ibrahimakkaya
#Bitcoin İkili Tepe Formasyonu içinde mi??

#Bitcoin 📊 BTCUSDT - Daily Graphic Analysis 1️⃣ Formation: The graph has a very clear double hill (double ball) formation. This formation usually gives a powerful trend return (from top to bottom) signal. 2️⃣ Critical levels: 112.516 $ → Tillson and formation neckline. It is negative to stay under this. $ 108,000 zone → short term intermediate support. 100.943 $ → Dual Hill Target Zone (marked in the graph). Sales pressure towards this level may increase. 3️⃣ volume analysis: The volume is weakened in the hill areas, which shows that buyers have lost their power. The increase in the volume of decrease candles confirms that sales are strong. 4️⃣ Indicators: The indicator below (probably Momentum/Trigger line) has made down, which supports the SAT signal. The decline tendency in the short term is stronger. 📈 Positive Scenario: If the price rises over $ 112,500 again, the dual hill will be wasted, then there is a new rise to the $ 120,000 - $ 124,000 band. 📉 Negative scenario (Right now): If closes under $ 108,000 arrive, a decrease in the $ 100,900 - $ 101,000 band with a formation target may accelerate.
ibrahimakkaya
ETHEREUM tekrar pozitif tarafta..!!

📊 #ethereum (ETH/USDT) - Daily Graphic Analysis 📍 MEET STATUS: ETH is currently trading at $ 4,600. The graph generally maintains the rise trend, but short -term fluctuations are remarkable. 📍 DEPARTMENT - Resistance levels: Main Support: $ 4,492 (Critical level, decrease below can be accelerated to $ 4.244) Second Support: $ 4,048 (Fibo 0.618 Support) Resistance 1: 📍4.808 $ (Important intermediate resistance) Resistance 2: $ 4,956 (Last summit) Resistance 3: 5.210 $ (Fibo 1,618 target zone) 📍Hacim analysis: With the increase in volume in recent days, it is seen that the purchase pressure is alive. However, red volume sticks show that sales pressure is also active. 📍 Regions: Tillson T 3: As long as it remains above $ 4.589, the positive appearance is maintained. Supertrend: As long as it stays above $ 4.042, the rise trend applies. Alt The indicator has an upward intersection signal, but the momentum is not yet strong. 🔎 Summary: ETH continues to rise as it holds on $ 4,492. If it breaks $ 4,808 in the short term, it can be targeted $ 4,956 and then $ 5.210. However, the sales pressure increases at closes of $ 4,492 and the first target is $ 4.244. 👉 For now, we can say that there is a strong trend confirmation on support.
ibrahimakkaya
Bitcoin de İkili Tepe Çalışır mı??

Binary Tepe Formation ... !! Neckline is broken ... !!!! Does the shaped flag work ?? This is #crypto everything happens ...
ibrahimakkaya
SUI

There are technical conditions for the upward trend. Tillson switched to a positive side over $ 3.65. Indicator positive .. On volume averages ...
ibrahimakkaya
TİA
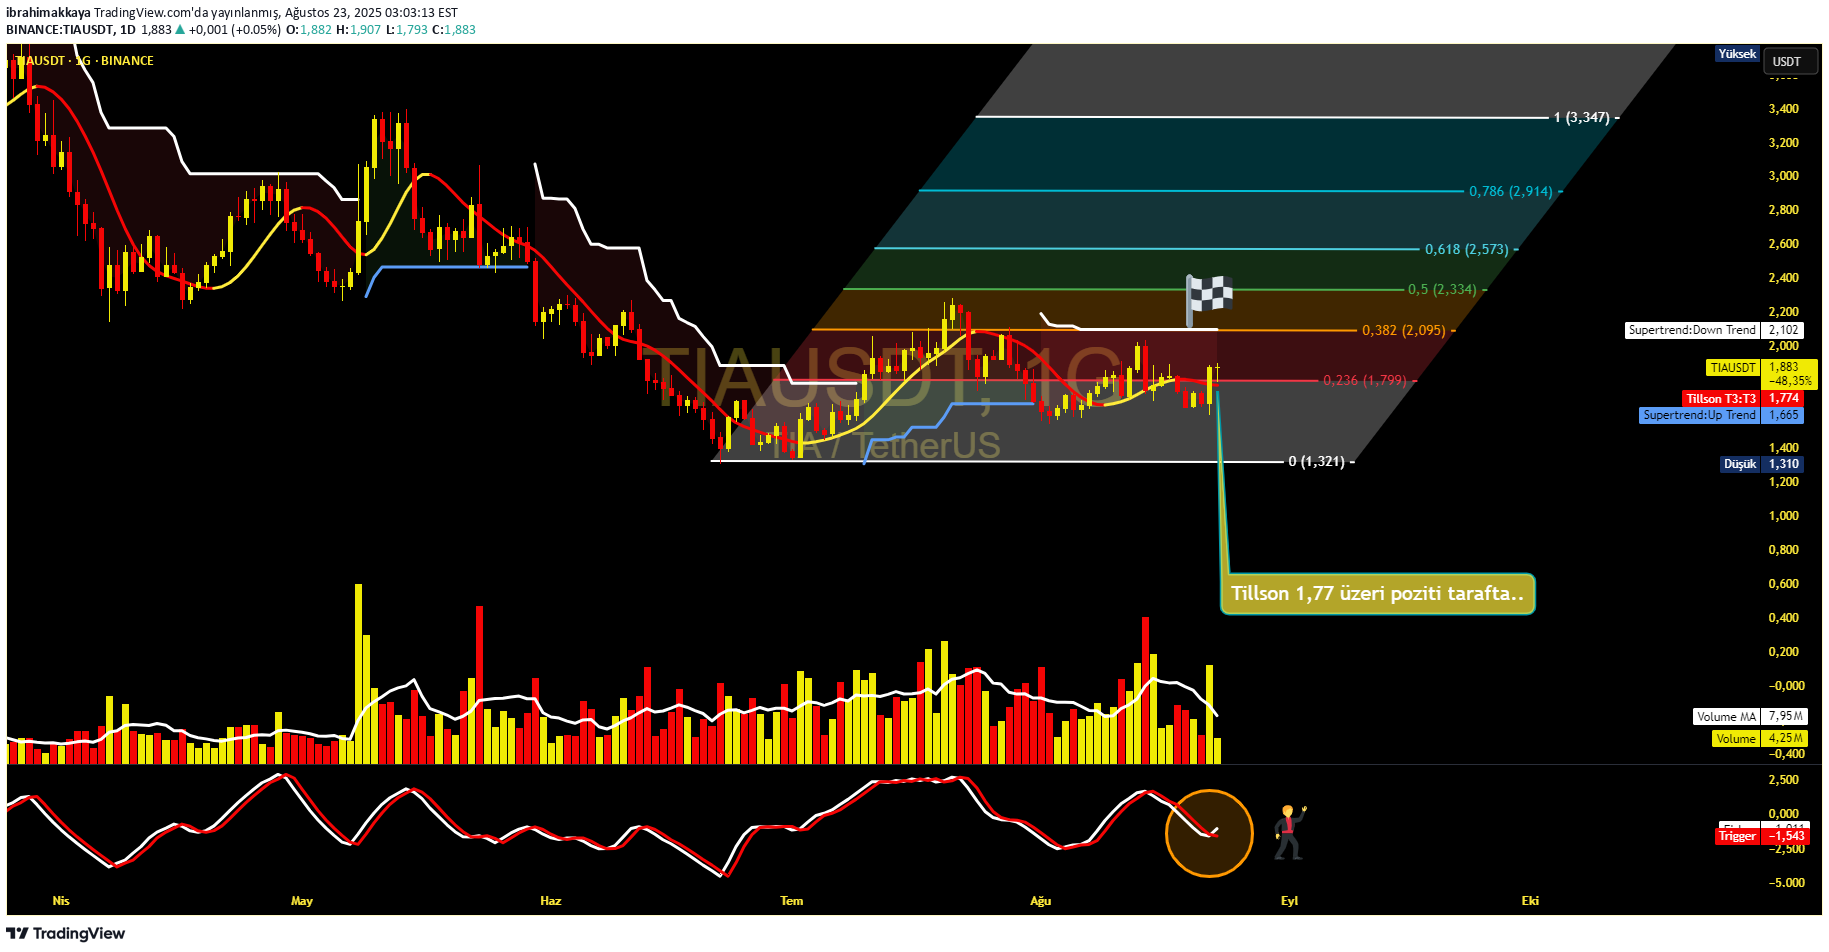
There are technical conditions for the upward trend. Tillson switched to a positive side over $ 1.77. Indicator positive .. On volume averages ...
ibrahimakkaya
EİGEN

There are technical conditions for the upward trend. Tillson switched to a positive side over $ 1.38. Indicator positive .. On volume averages ...
ibrahimakkaya
ARBUSDT

There are technical conditions for the upward trend. Tillson switched to a positive side over $ 0.52. Indicator positive .. On volume averages ...
Disclaimer
Any content and materials included in Sahmeto's website and official communication channels are a compilation of personal opinions and analyses and are not binding. They do not constitute any recommendation for buying, selling, entering or exiting the stock market and cryptocurrency market. Also, all news and analyses included in the website and channels are merely republished information from official and unofficial domestic and foreign sources, and it is obvious that users of the said content are responsible for following up and ensuring the authenticity and accuracy of the materials. Therefore, while disclaiming responsibility, it is declared that the responsibility for any decision-making, action, and potential profit and loss in the capital market and cryptocurrency market lies with the trader.