
AlvinDeo96
@t_AlvinDeo96

What symbols does the trader recommend buying?
Purchase History
پیام های تریدر
Filter
AlvinDeo96
Relief Rally Inbound?
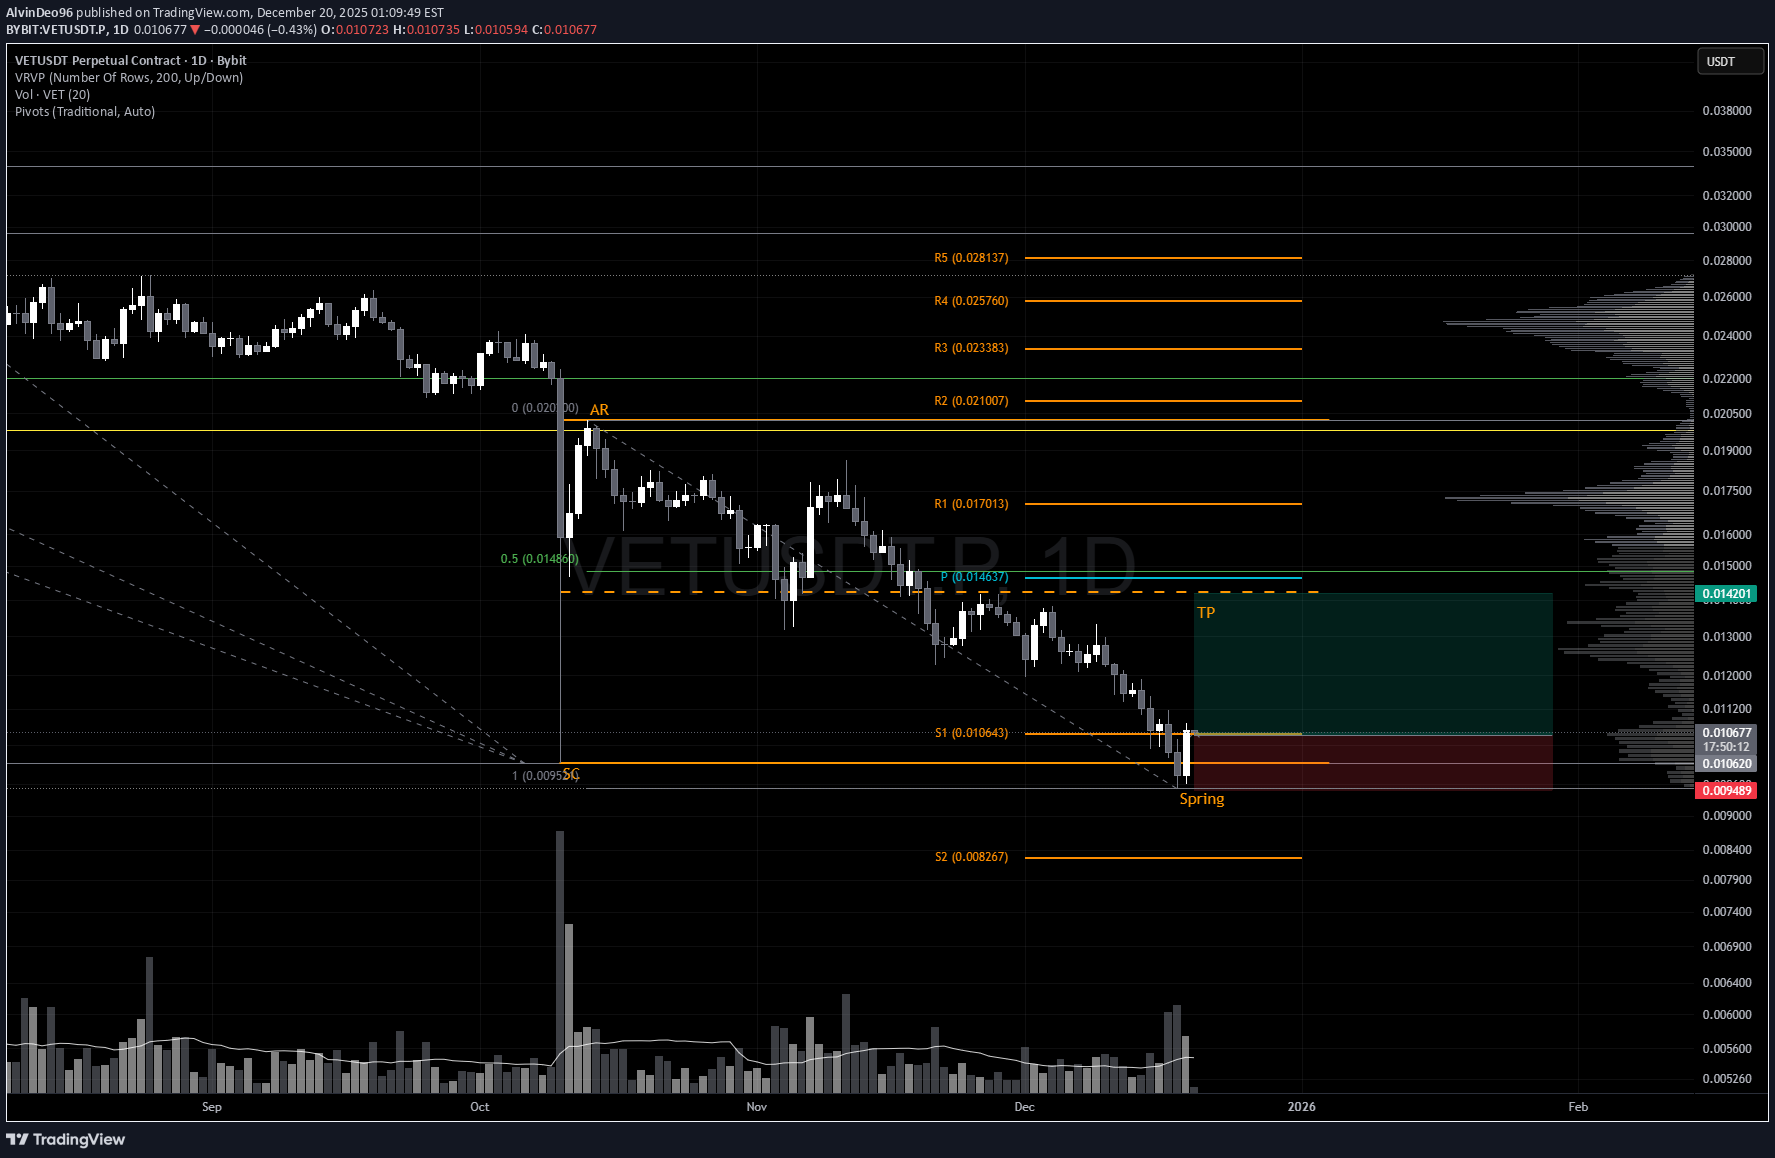
VET is shaping up for a potential reversal. After the aggressive October 10 sell‑off, price responded with a clean Automatic Rally (AR) before rolling over into a controlled pullback. This latest dip appears to be sweeping the October 10 lows, and the December 19 bullish engulfing candle is the first meaningful sign of demand stepping back in. Crucially, price closed back inside the prior range, which keeps the structure constructive. While heavier volume on the reversal would’ve added confidence, the low‑volume nature of the sweep actually supports a spring narrative — supply has been drying up for weeks, and there’s been no evidence of aggressive selling pressure. That’s exactly what you want to see heading into a potential Wyckoff spring. Trade Scenario Initial TP would be just below the range EQ which lines up with the yearly pivot and 50% of the range retracement. From here, if the price can close, hold and form higher lows above this level, would strongly suggest that a bottom is in. The next meaningful upside target sits around $0.0194, where prior resistance and structural alignment converge. Market Context A surprising number of alts are printing similar spring‑like structures right now: • Washed‑out lows • Diminishing volume • Reclaims back into range • Early signs of demand returningwith BTC struggling at a key resistance and now VET hitting the weekly r1 pivot for the first time (not shown on this chart) I'm happy to exit. The price may continue to rally but overall looks pretty weak.
AlvinDeo96
Relief Rally Inbound?
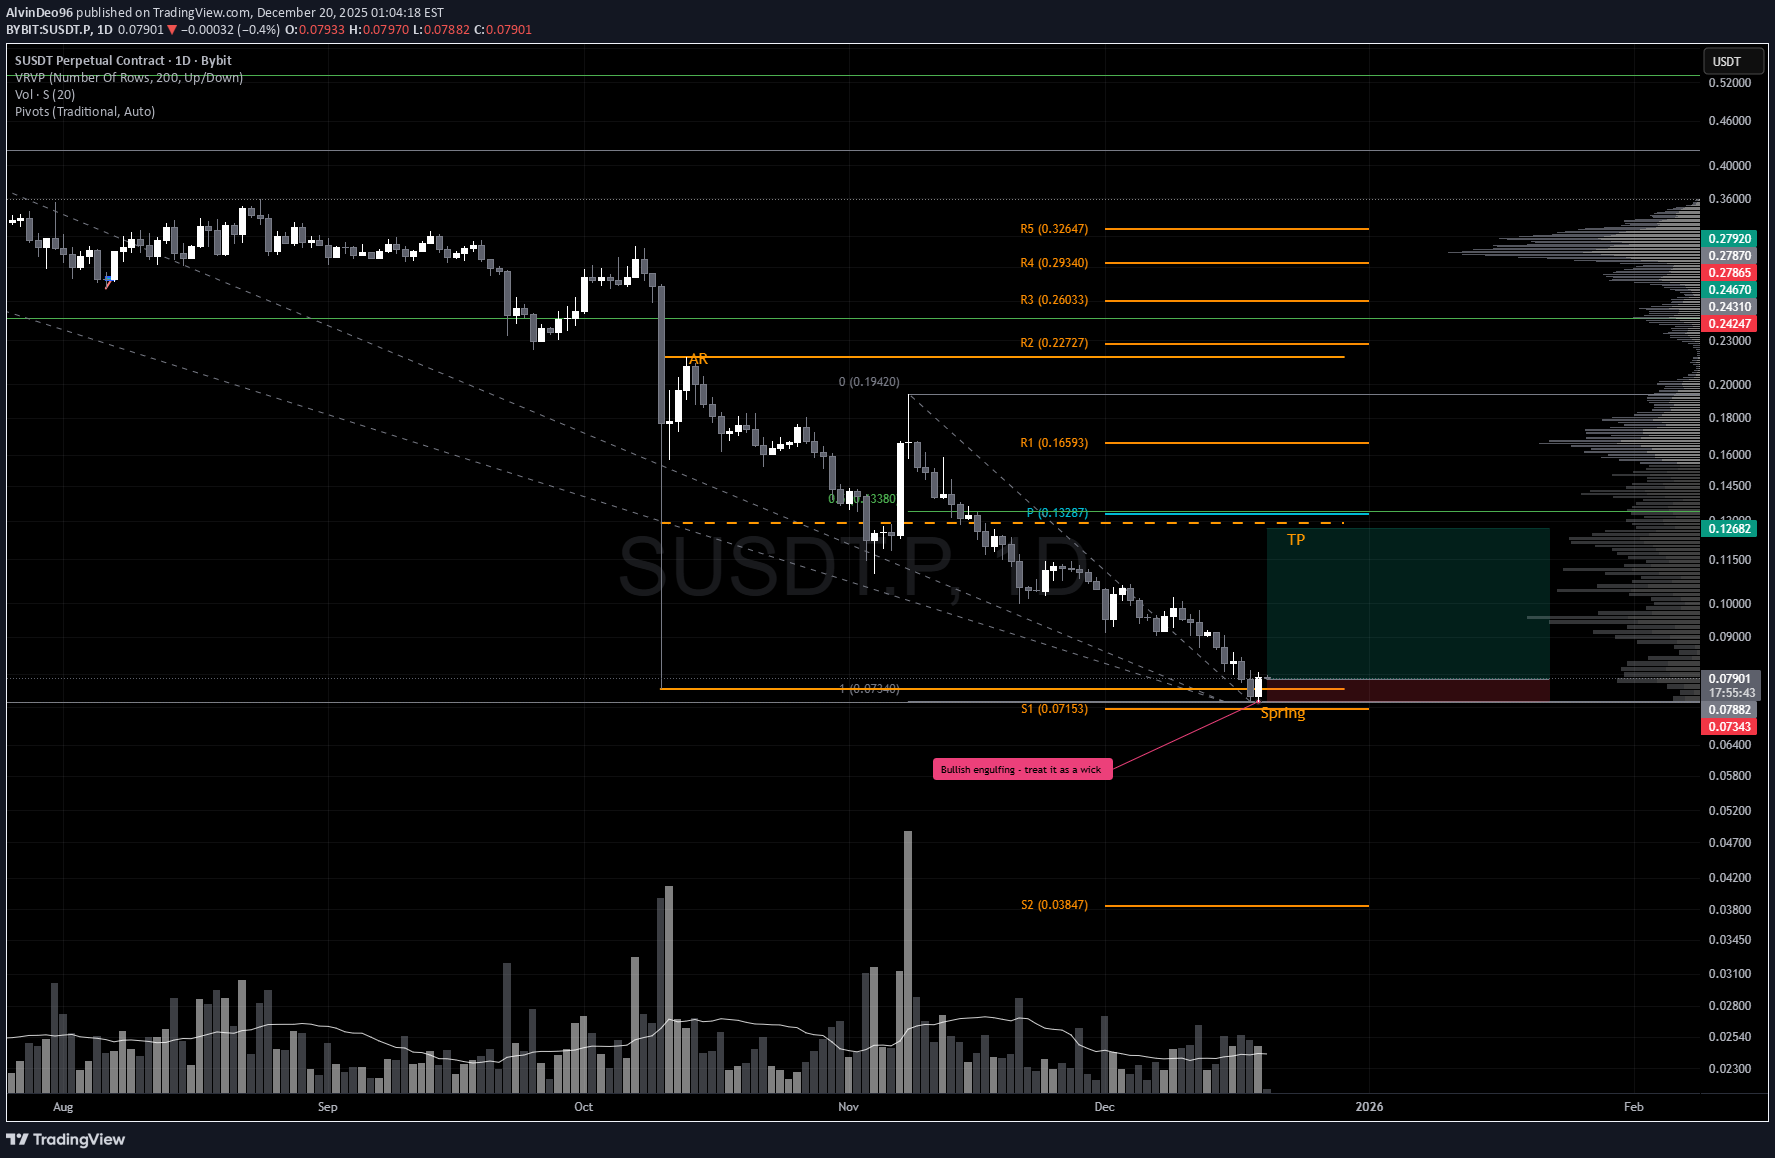
S is shaping up for a potential reversal. After the aggressive October 10 sell‑off, price responded with a clean Automatic Rally (AR) before rolling over into a controlled pullback. This latest dip appears to be sweeping the October 10 lows, and the December 19 bullish engulfing candle is the first meaningful sign of demand stepping back in. Crucially, price closed back inside the prior range, which keeps the structure constructive. While heavier volume on the reversal would’ve added confidence, the low‑volume nature of the sweep actually supports a spring narrative — supply has been drying up for weeks, and there’s been no evidence of aggressive selling pressure. That’s exactly what you want to see heading into a potential Wyckoff spring. Trade Scenario Initial TP would be just below the range EQ which lines up with the yearly pivot and 50% of the range retracement. From here, if the price can close, hold and form higher lows above this level, would strongly suggest that a bottom is in. The next meaningful upside target sits around $0.16593, where prior resistance and structural alignment converge. Market Context A surprising number of alts are printing similar spring‑like structures right now: • Washed‑out lows • Diminishing volume • Reclaims back into range • Early signs of demand returningwith BTC struggling at a key resistance and now S hitting the weekly r1 pivot for the first time (not shown on this chart) I'm happy to exit. The price may continue to rally but overall looks pretty weak.with BTC struggling at a key resistance and now VET hitting the weekly r1 pivot for the first time (not shown on this chart) I'm happy to exit. The price may continue to rally but overall looks pretty weak.
AlvinDeo96
Relief rally Inbound?

IMX is shaping up for a potential reversal. After the aggressive October 10 sell‑off, price responded with a clean Automatic Rally (AR) before rolling over into a controlled pullback. This latest dip appears to be sweeping the October 10 lows, and the December 19 bullish engulfing candle is the first meaningful sign of demand stepping back in. Crucially, price closed back inside the prior range, which keeps the structure constructive. While heavier volume on the reversal would’ve added confidence, the low‑volume nature of the sweep actually supports a spring narrative — supply has been drying up for weeks, and there’s been no evidence of aggressive selling pressure. That’s exactly what you want to see heading into a potential Wyckoff spring. Trade Scenario Initial TP would be just below the range EQ which lines up with the yearly pivot and 50% of the range retracement. From here, if the price can close, hold and form higher lows above this level, would strongly suggest that a bottom is in. The next meaningful upside target sits around $0.58, where prior resistance and structural alignment converge. Market Context A surprising number of alts are printing similar spring‑like structures right now: • Washed‑out lows • Diminishing volume • Reclaims back into range • Early signs of demand returningwith BTC struggling at a key resistance and now IMX hitting the weekly r1 pivot for the first time (not shown on this chart) I'm happy to exit. The price may continue to rally but overall looks pretty weak.
AlvinDeo96
Relief Rally Inbound?

S is shaping up for a potential reversal. After the aggressive October 10 sell‑off, price responded with a clean Automatic Rally (AR) before rolling over into a controlled pullback. This latest dip appears to be sweeping the October 10 lows, and the December 19 bullish engulfing candle is the first meaningful sign of demand stepping back in. Crucially, price closed back inside the prior range, which keeps the structure constructive. While heavier volume on the reversal would’ve added confidence, the low‑volume nature of the sweep actually supports a spring narrative — supply has been drying up for weeks, and there’s been no evidence of aggressive selling pressure. That’s exactly what you want to see heading into a potential Wyckoff spring. Trade Scenario Initial TP would be just below the range EQ which lines up with the yearly pivot and 50% of the range retracement. From here, if the price can close, hold and form higher lows above this level, would strongly suggest that a bottom is in. The next meaningful upside target sits around $0.16593, where prior resistance and structural alignment converge. Market Context A surprising number of alts are printing similar spring‑like structures right now: • Washed‑out lows • Diminishing volume • Reclaims back into range • Early signs of demand returning
AlvinDeo96
Relief Rally Inbound?
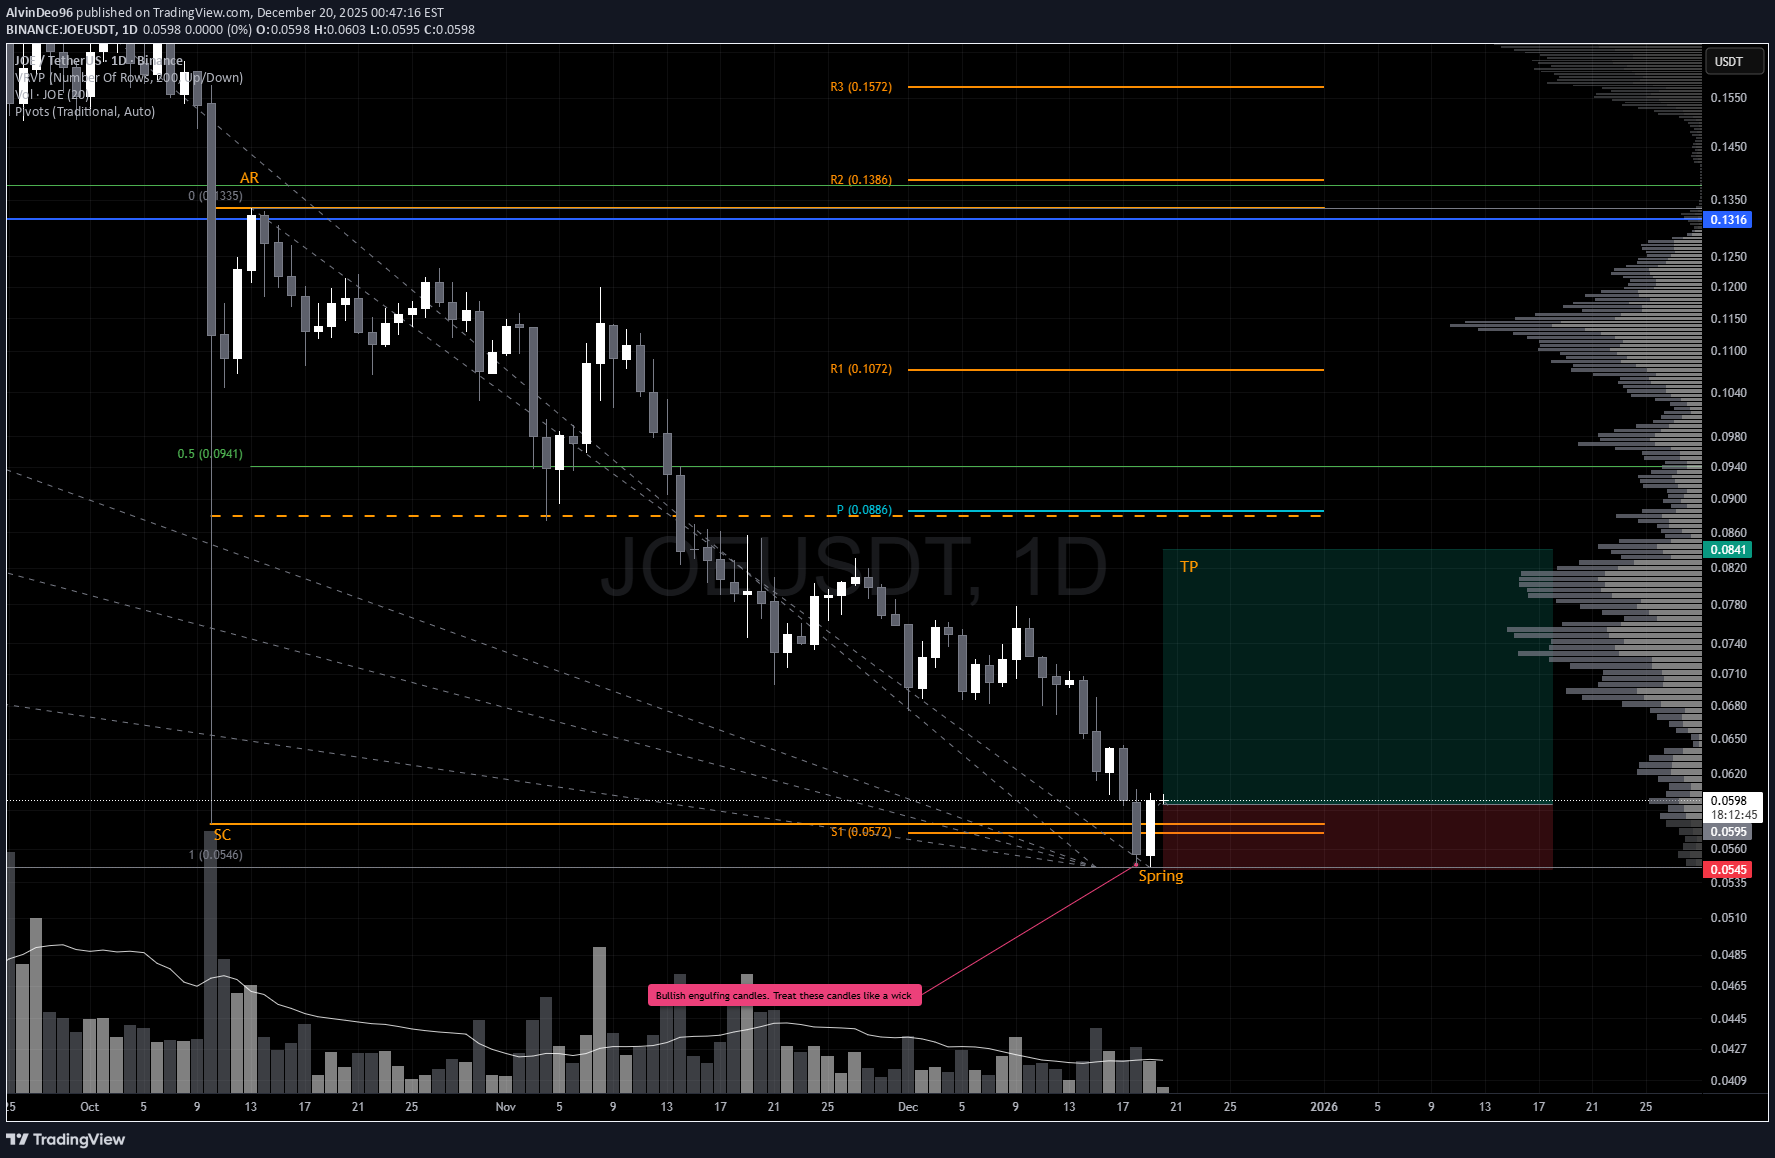
JOE is shaping up for a potential reversal. After the aggressive October 10 sell‑off, price responded with a clean Automatic Rally (AR) before rolling over into a controlled pullback. This latest dip appears to be sweeping the October 10 lows, and the December 19 bullish engulfing candle is the first meaningful sign of demand stepping back in. Crucially, price closed back inside the prior range, which keeps the structure constructive. While heavier volume on the reversal would’ve added confidence, the low‑volume nature of the sweep actually supports a spring narrative — supply has been drying up for weeks, and there’s been no evidence of aggressive selling pressure. That’s exactly what you want to see heading into a potential Wyckoff spring. Trade Scenario Initial TP would be just below the range EQ which lines up with the yearly pivot and 50% of the range retracement. From here, if the price can close, hold and form higher lows above this level, would strongly suggest that a bottom is in. The next meaningful upside target sits around $0.1296, where prior resistance and structural alignment converge. Market Context A surprising number of alts are printing similar spring‑like structures right now: • Washed‑out lows • Diminishing volume • Reclaims back into range • Early signs of demand returningwith BTC struggling at a key resistance and now JOE hitting the weekly r1 pivot for the first time (not shown on this chart) I'm happy to exit. The price may continue to rally but overall looks pretty weak.
AlvinDeo96
آیا سهم CORE آماده انفجار قیمتی است؟ فرصت خرید در کف!
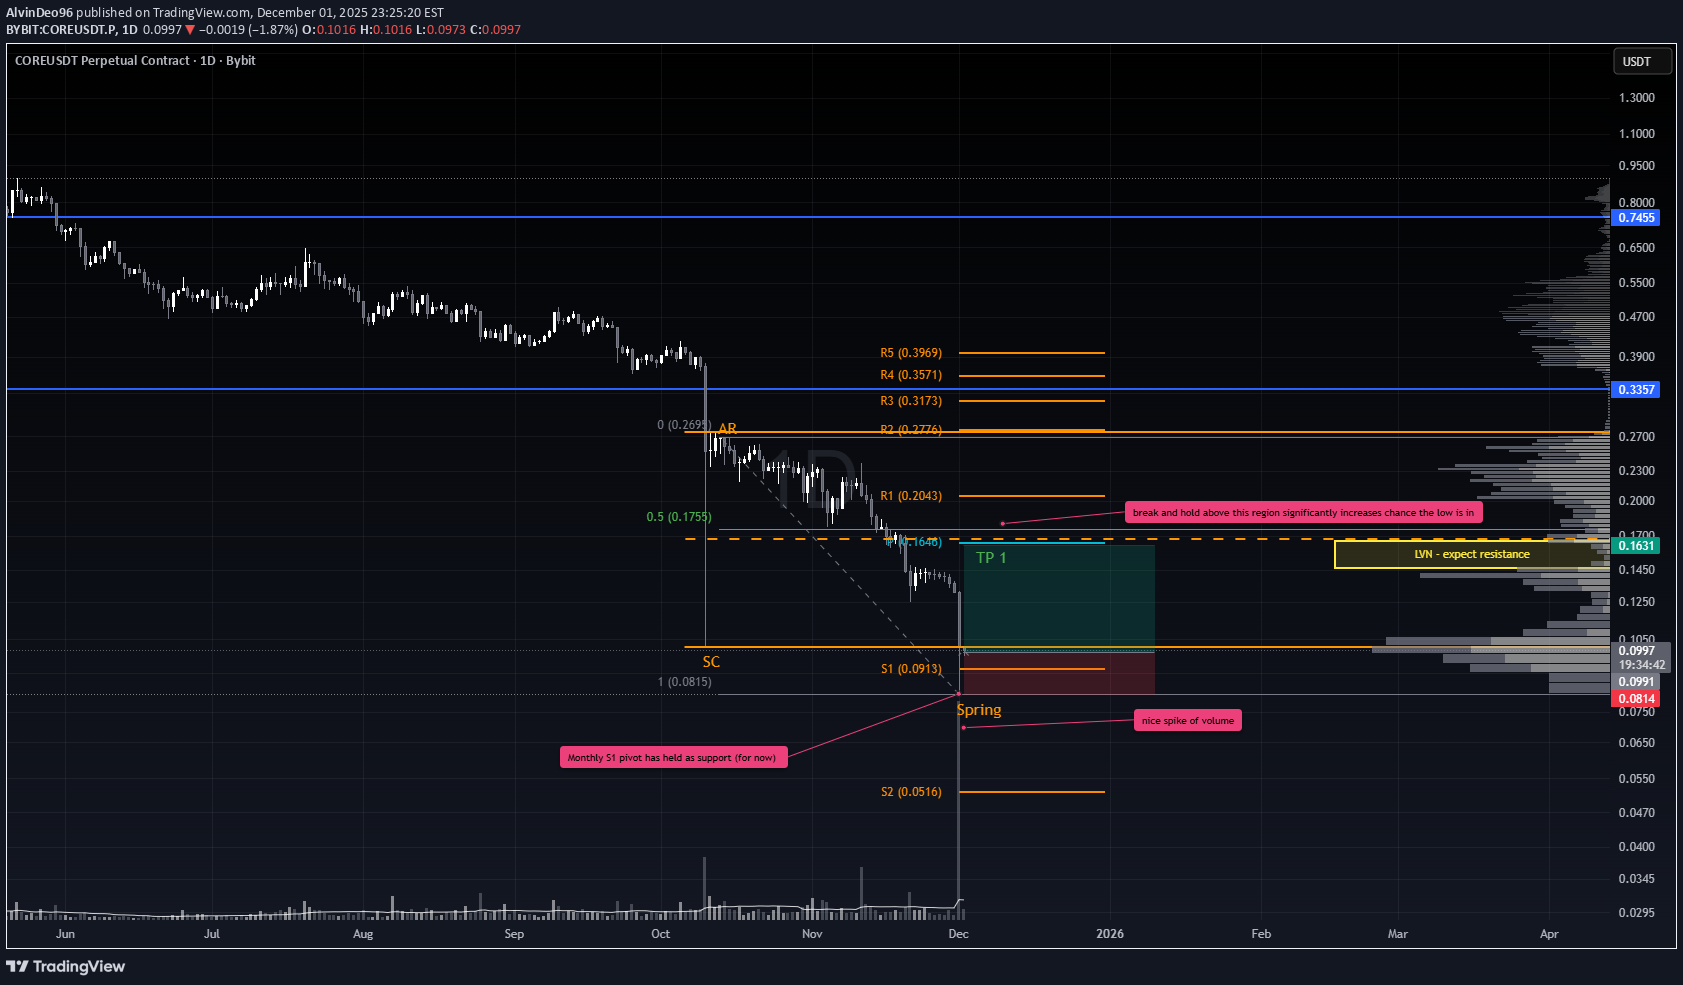
CORE looks poised for a potential rally. After the sharp October 10 sell-off, price staged an Automatic Rally (AR) before pulling back, now potentially sweeping the October 10 lows. The December 1 candle managed to close back within the prior range on what appears to be capitulative volume a constructive sign. The immediate focus is the monthly pivot. A decisive close above this level, followed by a sequence of higher lows, would strongly suggest that the bottom is in place. From there, the next key resistance sits around $0.26. One step at a time: first reclaim the pivot, then build structure above it.
AlvinDeo96
تثبیت موقعیت خرید: فرصت سودآوری پس از اصلاح حجم در محدوده قیمتی!
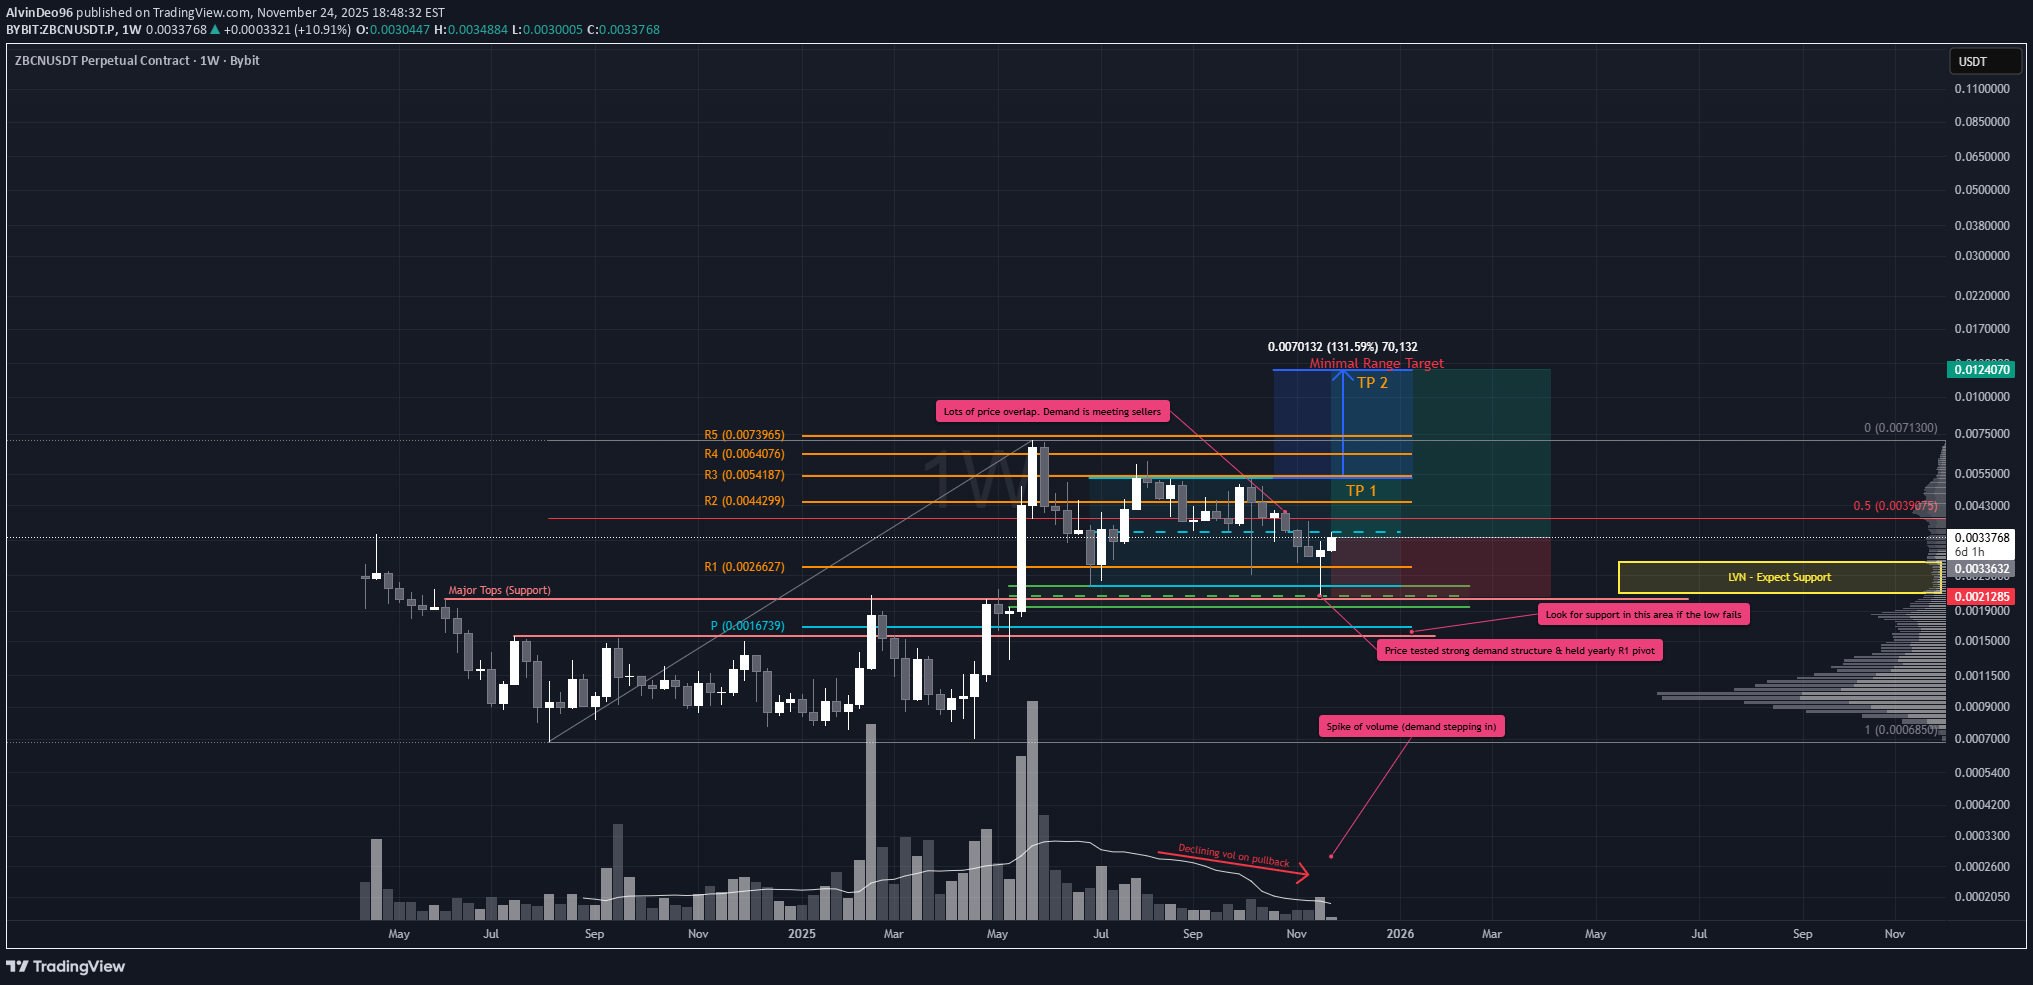
ZBCN looking very clean here. After breaking out of the range, price has retraced roughly 70% back toward the range tops. Despite the heavy bearish sentiment across crypto, the chart structure is telling a different story. The pullback shows declining volume with overlapping price action, a classic sign of buyers quietly absorbing supply. In the week ending 23 November, price drove sharply into a key support zone before closing back inside the range. The weekly candle printed a bullish hammer on elevated volume, signaling potential strength. Yes, further downside is always possible if sellers return with conviction, but right now the setup is constructive. Trade Scenario • Entry: Position can be initiated here. • Stop Loss (SL): Use the hammer candle low as invalidation. • If that level fails, look for the next major support highlighted on the chart. • Take Profit (TP): • First target: range tops. • Trail SL as price moves, aiming for a full 100% range extension. Reminder: No setup is guaranteed. Risk management is non‑negotiable. Protect capital first, profits second.
AlvinDeo96
تحلیل تکنیکال پندل (PENDLE): آیا برگشت قیمت قطعی است یا در دام خرسها خواهیم افتاد؟
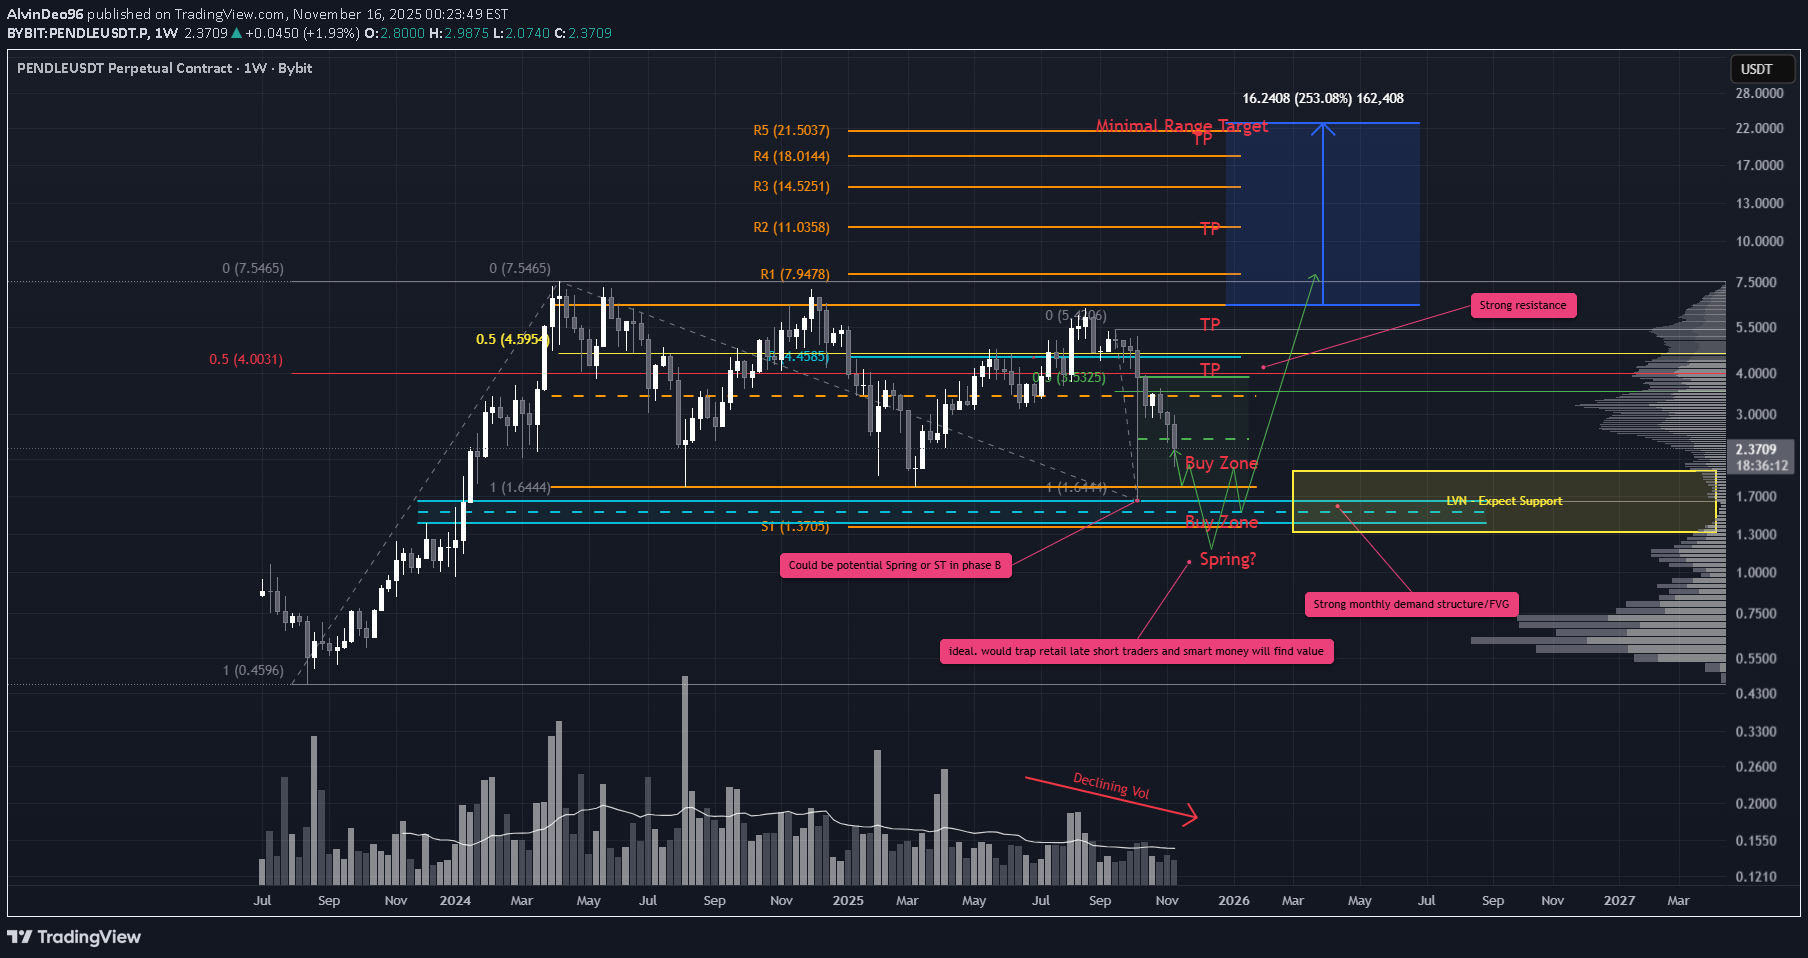
PENDLE’s chart is loaded with nuance right now. There’s a lot in play, and multiple paths could unfold from here so staying nimble and managing risk is key. The October 10 flash crash left a deep wick at the bottom of the range. Price initially bounced back to ~$3.87 but has since retraced heavily into that wick. Candle spreads are widening, which suggests selling pressure is still present, but volume hasn’t picked up. That leans me toward accumulation rather than distribution. We’re currently hovering around the EQ of that wick. If price pushes out strongly from here, the pullback may be complete and we can treat the October 10 low as a low-volume spring. If price continues to pull back, we may sweep those October lows and form the actual spring. The ideal confirmation would be a weekly move below the range on volume, followed by a close back inside the range preferably with a doji or hammer. Psychologically, that would be the cleanest setup, injecting liquidity and setting the stage for reversal. Just below the range sits the yearly S1 pivot and a major monthly FVG both worth watching. Trade Scenario 1 – Early Entry with Spring Add-on Entry • Start layering in now (as outlined above) • Add again if we get the spring confirmation Stop Loss • No hard SL yet. This setup leans advanced. • If we see large bearish candles on rising volume, the thesis is invalidated and we exit. Trade Scenario 2 – Wait for Spring Confirmation Entry • Wait for price to sweep the lows and print the spring candle • Enter on confirmation (weekly close back in range with volume) Targets for Both Scenarios Keep it simple: • EQ of the range • Range highs • Minimal range extension if price breaks out above This is a contrarian view. Many expect crypto to roll over into a broader bear phase. But if this spring plays out, PENDLE could offer a clean bounce setup with strong psychological structure with most retail traders left behind.
AlvinDeo96
بمب قدرتمند بیت کوین ترکید! حرکت انفجاری TAO پس از ریزش ۲۰ میلیارد دلاری

TAO is showing serious strength following the $20B crypto dump on Friday, October 10th. That event triggered a high-volume Spring out of the range, closing strong and decisively. Volume on the Spring exceeded that of the Selling Climax (SC), which suggests we should now expect a Test of demand. Two key zones are in play for this test, but given the size of the wick, we may not see a deep pullback being nimble is key. Most Bullish Scenario Price finds support near the local 50% level (green line) Reaccumulation occurs Price targets the top of the range, forming a Jump Across the Creek (JAC) If price pulls back on declining volume with overlapping candles (BU/LPS), expect a strong continuation The minimal range target is ambitious, but that’s what the structure tells us. Respect the setup, manage the risk, and most importantly don't tell the chart what to do.
AlvinDeo96
تحلیل شگفتانگیز نمودار GRT: راز جذب هوشمند پول در ساختار بهاری!

GRT is showing a fantastic range structure with a clean spring—an ideal case study in Wyckoff volume analysis. Despite the historic $20B crypto liquidation on October 10th, GRT’s wick printed on lower volume than the Selling Climax (SC), suggesting no need for a Spring retest. Price closed decisively back inside the range and above the yearly S1 pivot classic signs of smart money absorption. Trade Scenarios Option 1: Immediate Entry Entry: Current price Stop Loss: Just below the Spring Targets: TP1: ~$0.26 — strong resistance zone TP2: ~$1.53 — projected range target aligned with macro 50% level These targets may seem ambitious, but they’re structurally derived. This is what the chart is telling us. Option 2: Pullback Entry Entry: Wait for a pullback near the EQ of the Spring wick on the daily TF Stop Loss: Based on daily structure Targets: Same as Option 1
Disclaimer
Any content and materials included in Sahmeto's website and official communication channels are a compilation of personal opinions and analyses and are not binding. They do not constitute any recommendation for buying, selling, entering or exiting the stock market and cryptocurrency market. Also, all news and analyses included in the website and channels are merely republished information from official and unofficial domestic and foreign sources, and it is obvious that users of the said content are responsible for following up and ensuring the authenticity and accuracy of the materials. Therefore, while disclaiming responsibility, it is declared that the responsibility for any decision-making, action, and potential profit and loss in the capital market and cryptocurrency market lies with the trader.