
MKR
Maker
| تریدر | نوع سیگنال | حد سود/ضرر | زمان انتشار | مشاهده پیام |
|---|---|---|---|---|
No results found. | ||||
Price Chart of Maker
سود 3 Months :
سیگنالهای Maker
Filter
Sort messages by
Trader Type
Time Frame

FalconLineTrading
MKR
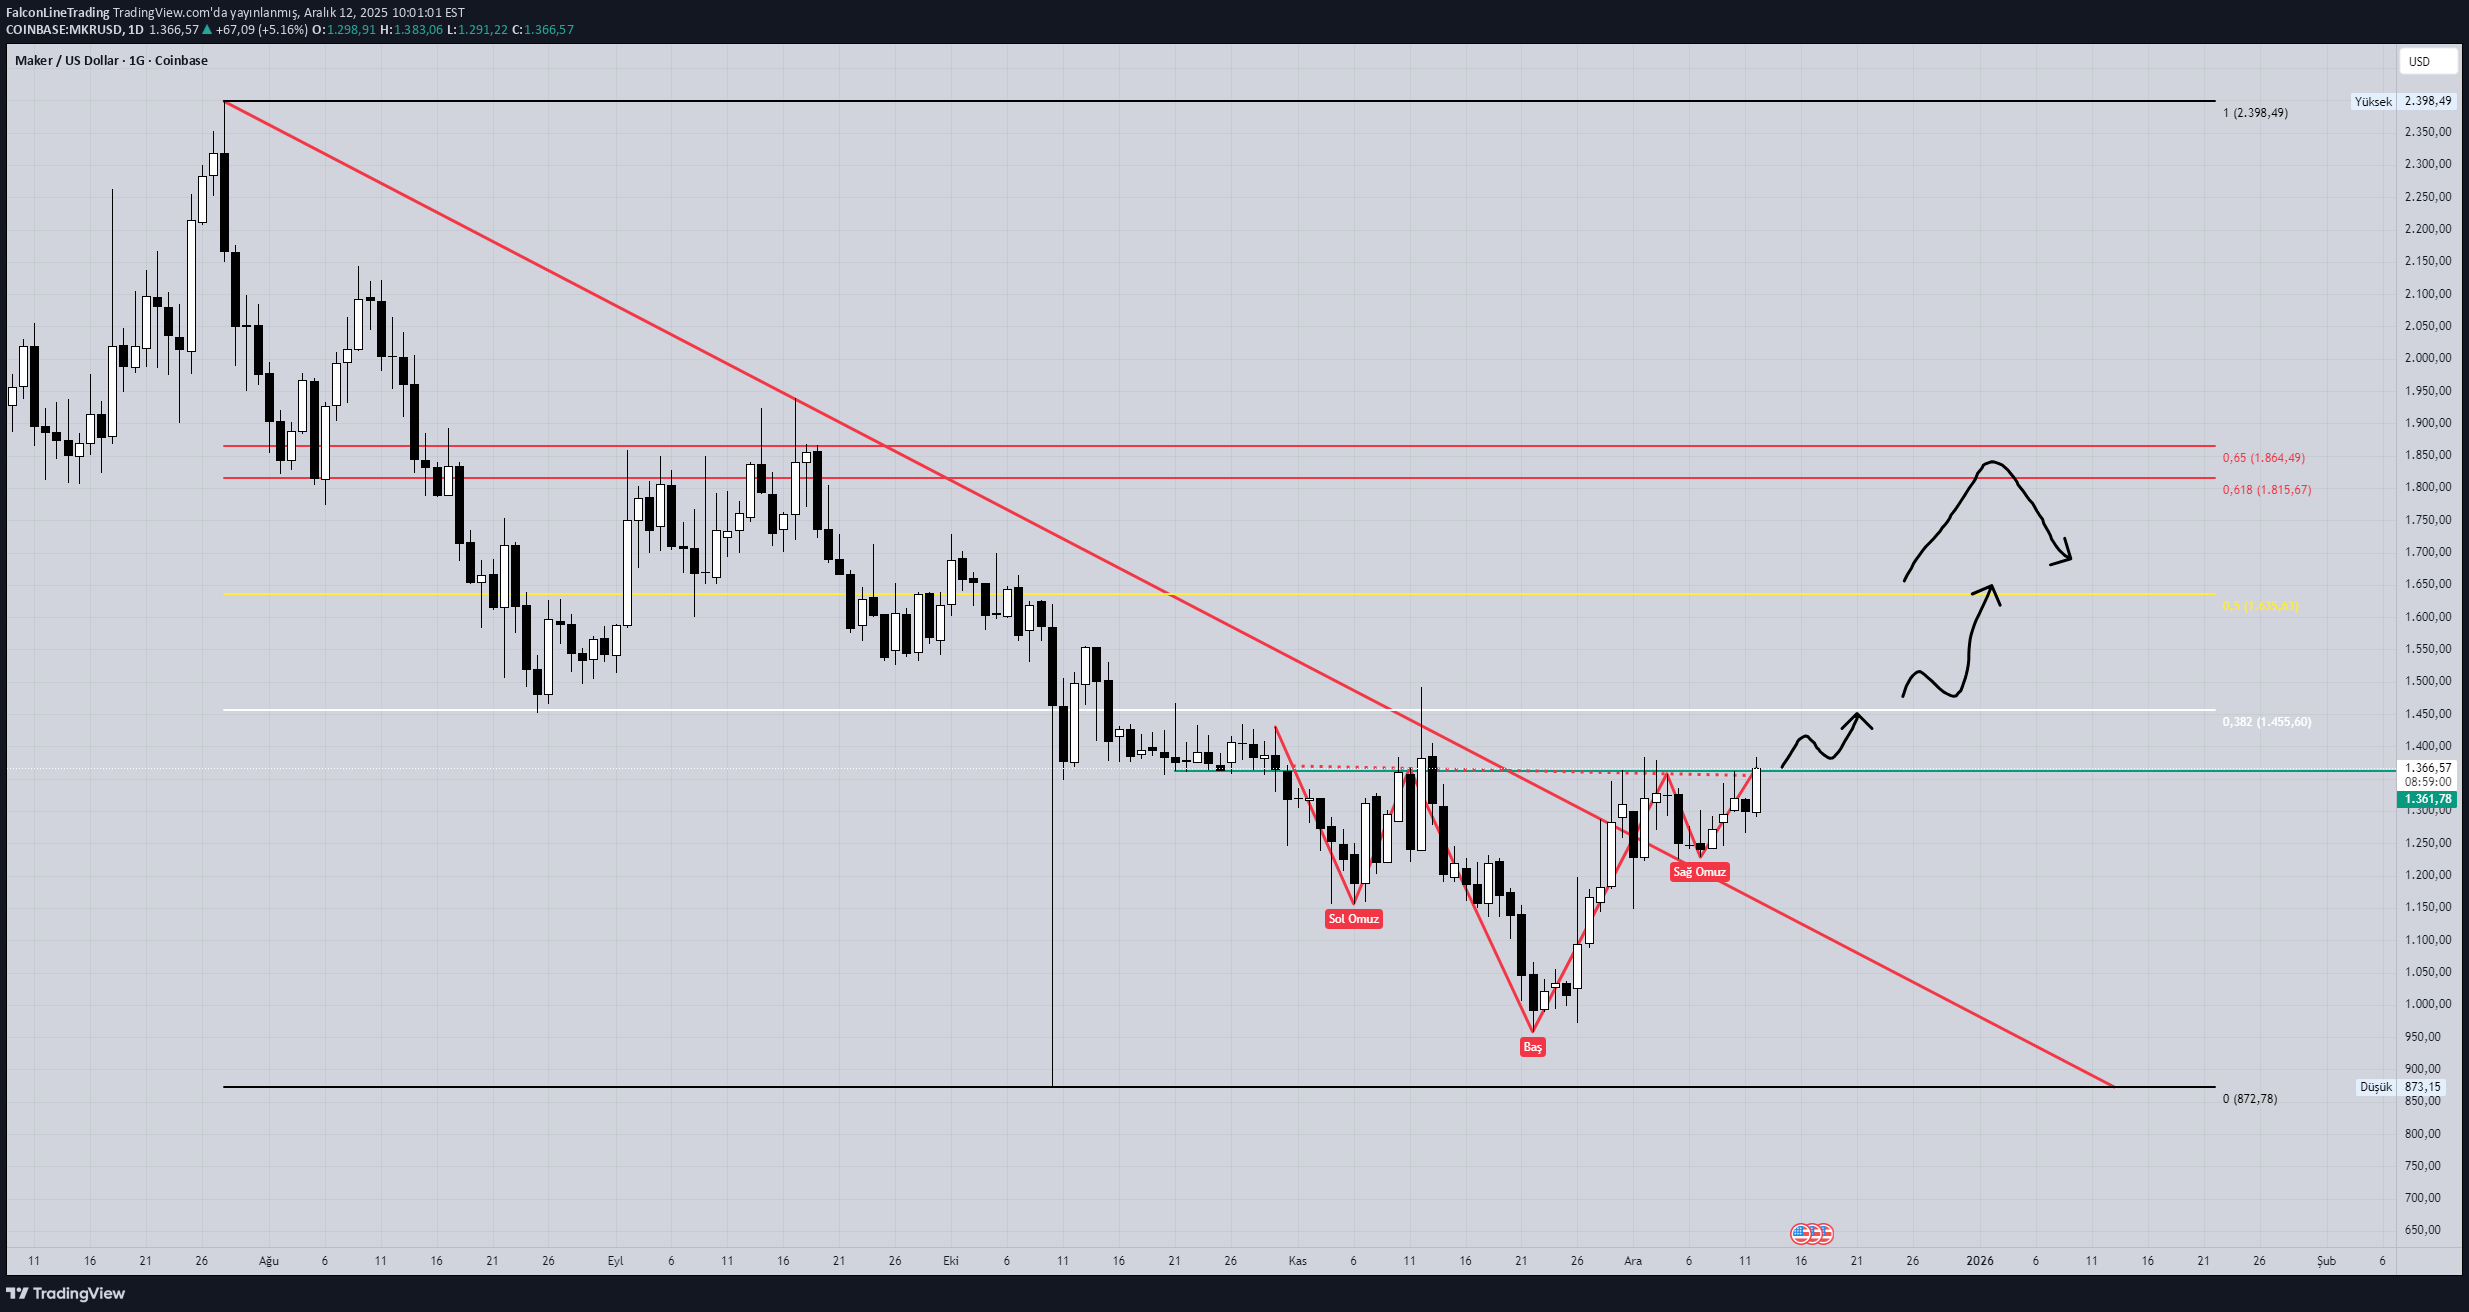
MKR It broke the falling trend that lasted for 5 months. TOBO formation occurred on the daily chart. I drew on the chart the price movements that I predicted would follow as the resistance levels were broken.

candle_crafts
MKRUSDT — Locked in the 1.7k Auction House
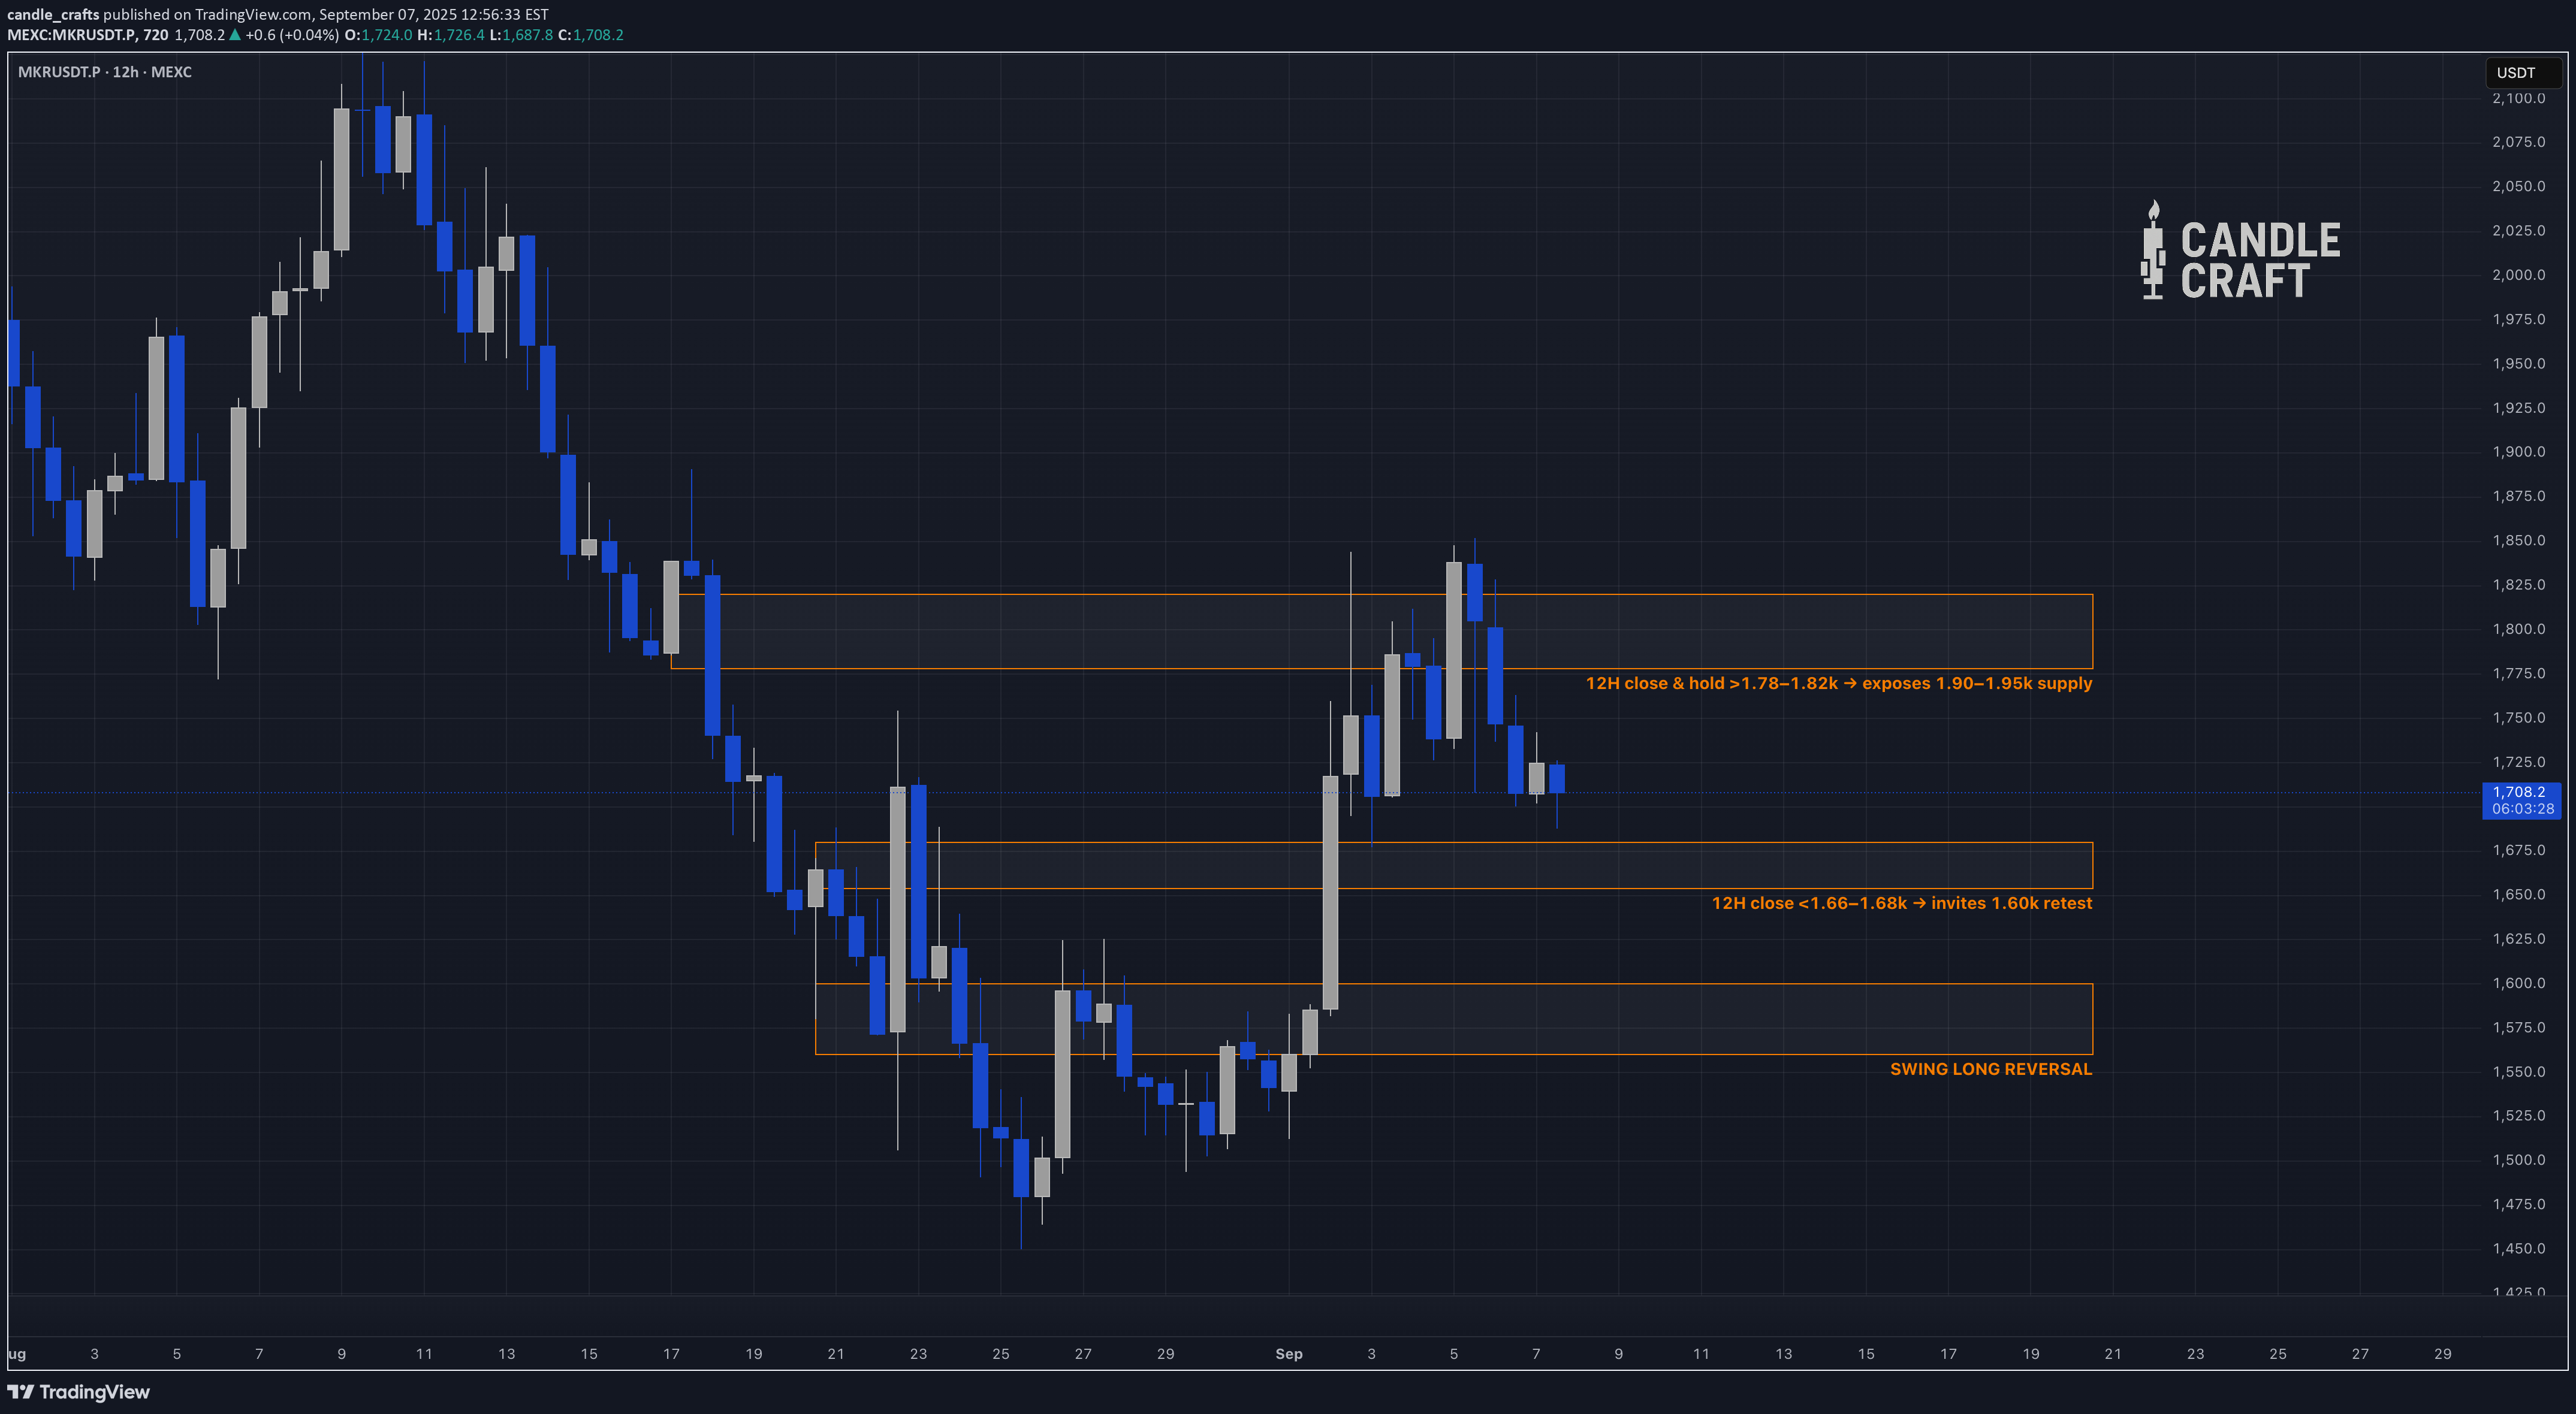
MKR feels like an old NFT collection nobody wants to delist — stuck in the same value band, waiting for someone to blink. Let’s break down the ranges before the next move. High Timeframes (Weekly → 2D → 12H) – Weekly HL carved 1.55–1.60k. Supply 1.95–2.15k, demand 1.50–1.60k. Pullback lighter volume = corrective. – 2D: Selloff 2.35k → 1.56k, bounce capped 1.78–1.80k. Still LH sequence unless >1.82k accepted. FVGs: 1.66–1.70k, 1.72–1.75k. – 12H: Range 1.66–1.79k, mid ~1.72–1.73k. Sweep + impulse, now balanced. • Bullish = close >1.78–1.82k → 1.90–1.95k. • Bearish = close <1.66–1.68k → 1.60k. Orderflow / Profile – POC 1.72–1.73k. – VAL 1.68–1.69k, VAH 1.76–1.77k. – Sellers active 1.76–1.79k, buyers defend 1.68–1.70k. – Auction balanced 1.69–1.77k. Derivatives Context – OI steady-to-down, funding ~0, CVD soft → spot-driven. – Liquidations modest, balanced. Inter-Market – BTC mid-range, BTC.D <60% → alt backdrop supportive. MKR profile still locked until value migrates. Conclusion MKR is boxed 1.69–1.77k with POC ~1.72–1.73k. Break outside VAH/VAL defines the next leg. Until then → two-sided grind. 💡 Pro Tip: In profiles like this, where price is auctioning inside a tight band, grid bots shine. They automate the “buy support / sell resistance” rotation, turning range chop into consistent profit while most traders overtrade. Candle Craft | Signal. Structure. Execution.

mehdishirian
MKR-USDT
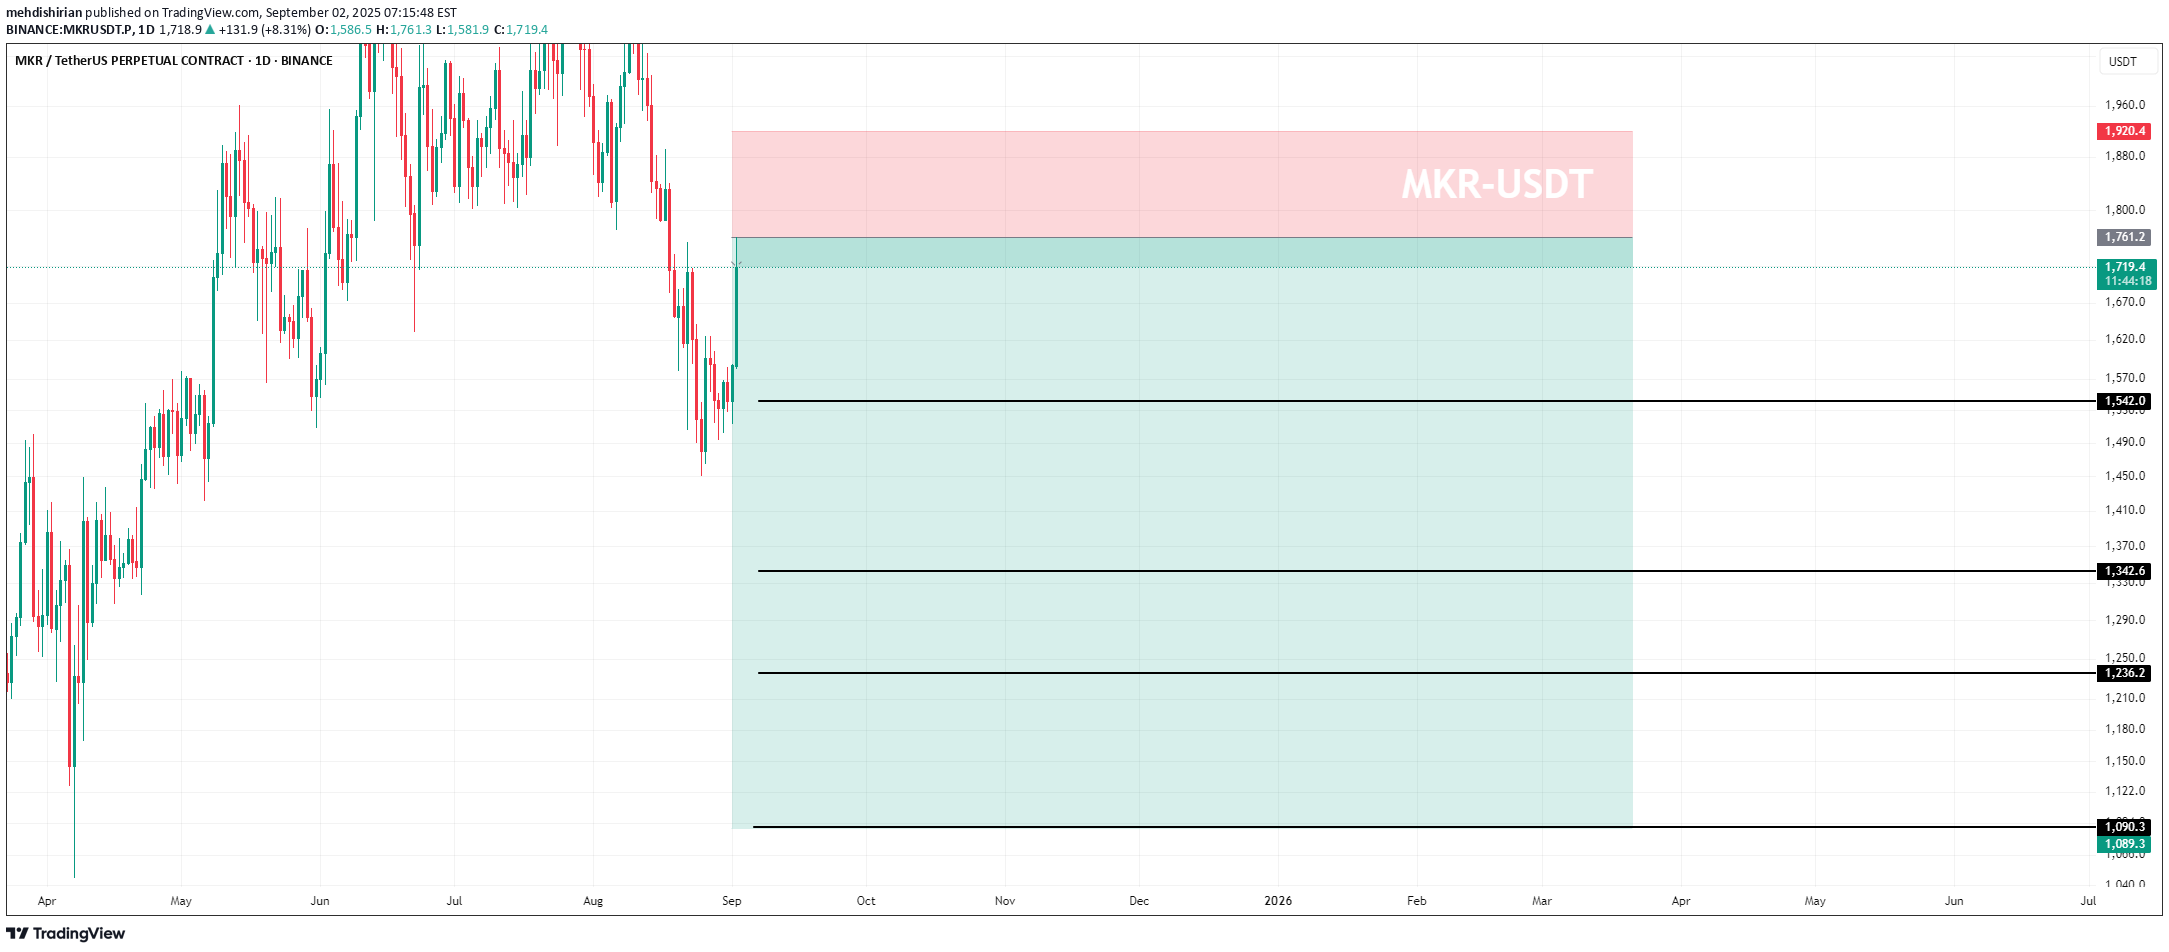
Hello everyone 😍 💁♂️I want to present you a new analysis of the MKR cryptocurrency. 👉The stop loss for this analysis is 9% and big, so be careful when entering a trade and don't forget about capital management. 👉The targets are marked with black lines. ⚠️The analysis may not reach the final target, so at each target, if you make a good profit and see signs of a trend change, you can exit the trade or manage your capital. To support me, I would appreciate it if you boost the analysis and share it with your friends so that I can analyze it with more energy for you, my dears. Thank you all. 💖

shahmir1000
MKRUSDT.P

Price has broken a trend. I am waiting for a retest at my marked level. Retest should be solid bullish momentum. Always take your 505 profit at 50% level and rest bring s.l to the entry. I Really wish for a support from you guys in form of followers. keep following me trying to give you the best analysis.i hope you guys enjoying it.. But i am not getting that much support which i was expecting.Guys show some love cmon

burhanercan2828
mkrusdt

4 H In this way, I follow the important resistance and formation target.

c_views
MKR faces pressure after delisting news while forming a triangle
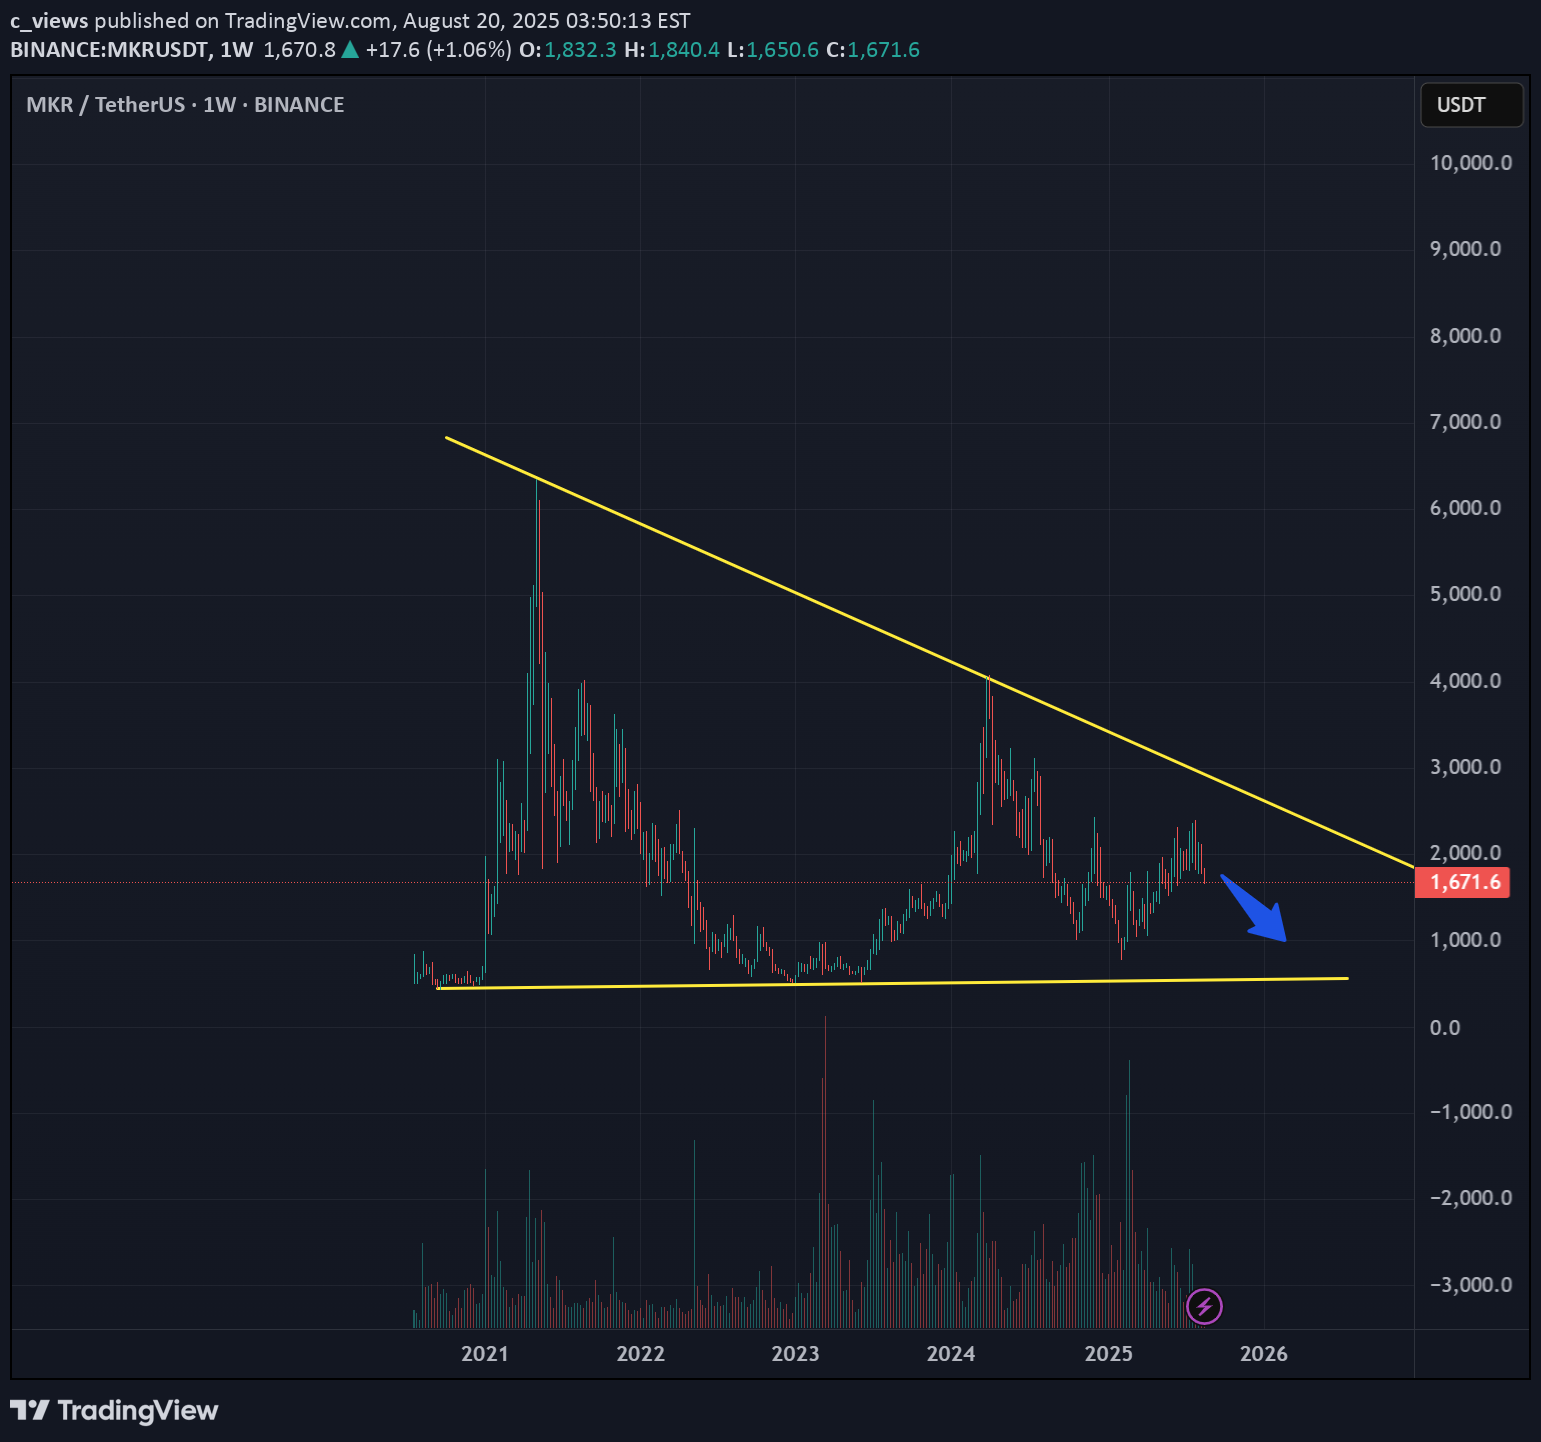
MKR was removed from the buybit, then other exchanges, by this point the asset had already lost a decent amount of value Globally, the coin is forming a triangle pattern, this pattern has the possibility of breaking the price both up and down, but against the background of news about delisting, MKR is more likely to go down Current price: $1683 Against the background of negative news about delisting, the price may fall to the level of $1620 and below the level of $1550 According to the pattern, a rebound may be inside the triangle to the level of $1750 or $1820

xWindx
MKR Weekly Outlook – Short-Term & Macro Perspectives
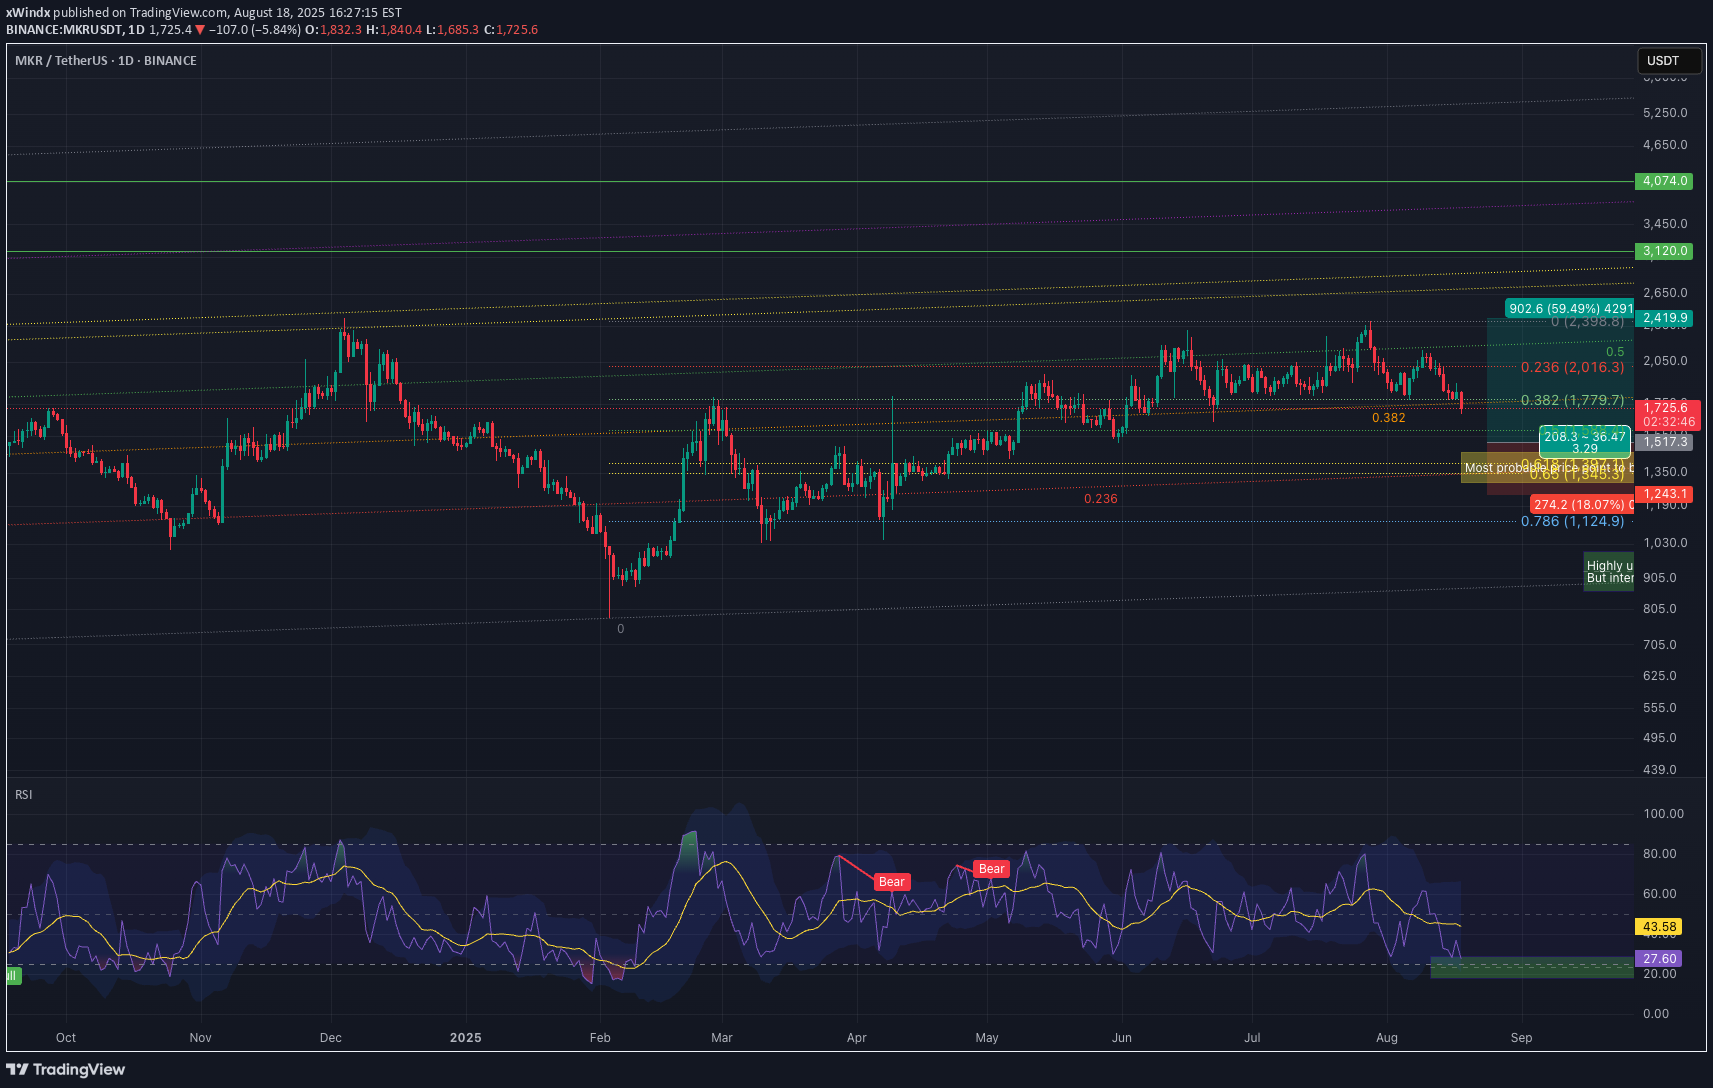
MKR stalled around the $2,400 resistance zone and is now retracing into key Fibonacci levels. In my view, this correction looks healthy and could set up the next strong move higher. Short-Term Trader Focus (next 1–4 weeks) Currently, $1,722 (0.382 Fib) level is being tested. With daily RSI already in oversold territory, this level could provide a bounce toward $1,950–$2,050. If $1,722 fails, next strong levels are $1,588 (0.5 Fib) and $1,362 (0.618 Fib). Both are strong buy-the-dip zones for swing traders. ⚡ Trading idea is to look for bullish reversal signals in the $1,588–$1,362 zone for swing long entries. High probability that the 0.618 Fib (~$1,362) will hold, so I plan to scale in gradually rather than waiting for the perfect entry. Macro Investor Focus (multi-month horizon) The macro trend remains bullish as long as MKR stays above $1,124. Current retracement is likely just a mid-cycle cooldown before MKR attempts higher levels. Macro upside targets are $3,120 (next major resistance) $4,074 (strong long-term target) Yes, $1,124 is so far away. If price ever returns there, the broader market would already be in severe distress. It is highly unlikely to get there at the moment. Hence, we are going to gauge our long-term spot entry with RSI (weekly). Currently it is cooling off from elevated levels, nearly resetting around 40–45, which historically aligns with strong long-term accumulation zones. 📌 Strategy: Scale into positions now and between $1,588–$1,362 for long-term holds. If RSI dips into oversold territory by Feb 2025, I’ll go in with full size at spot for a multi-month hold. Expect eventual move toward $3,120+ once correction completes. 📝 Summary Traders -> Watch $1,722, $1,588, $1,362 for bounce setups. Investors -> Treat this retracement as an opportunity to accumulate before MKR makes its next leg higher. Long-term bullish structure intact unless MKR breaks below $1,124 which is almost impossible at the current market condition. Not financial advice. Just my technical view. Manage risk accordingly!

SILICIDE
MKRUSDT Approaching Key Support — High R:R Opportunity Ahead
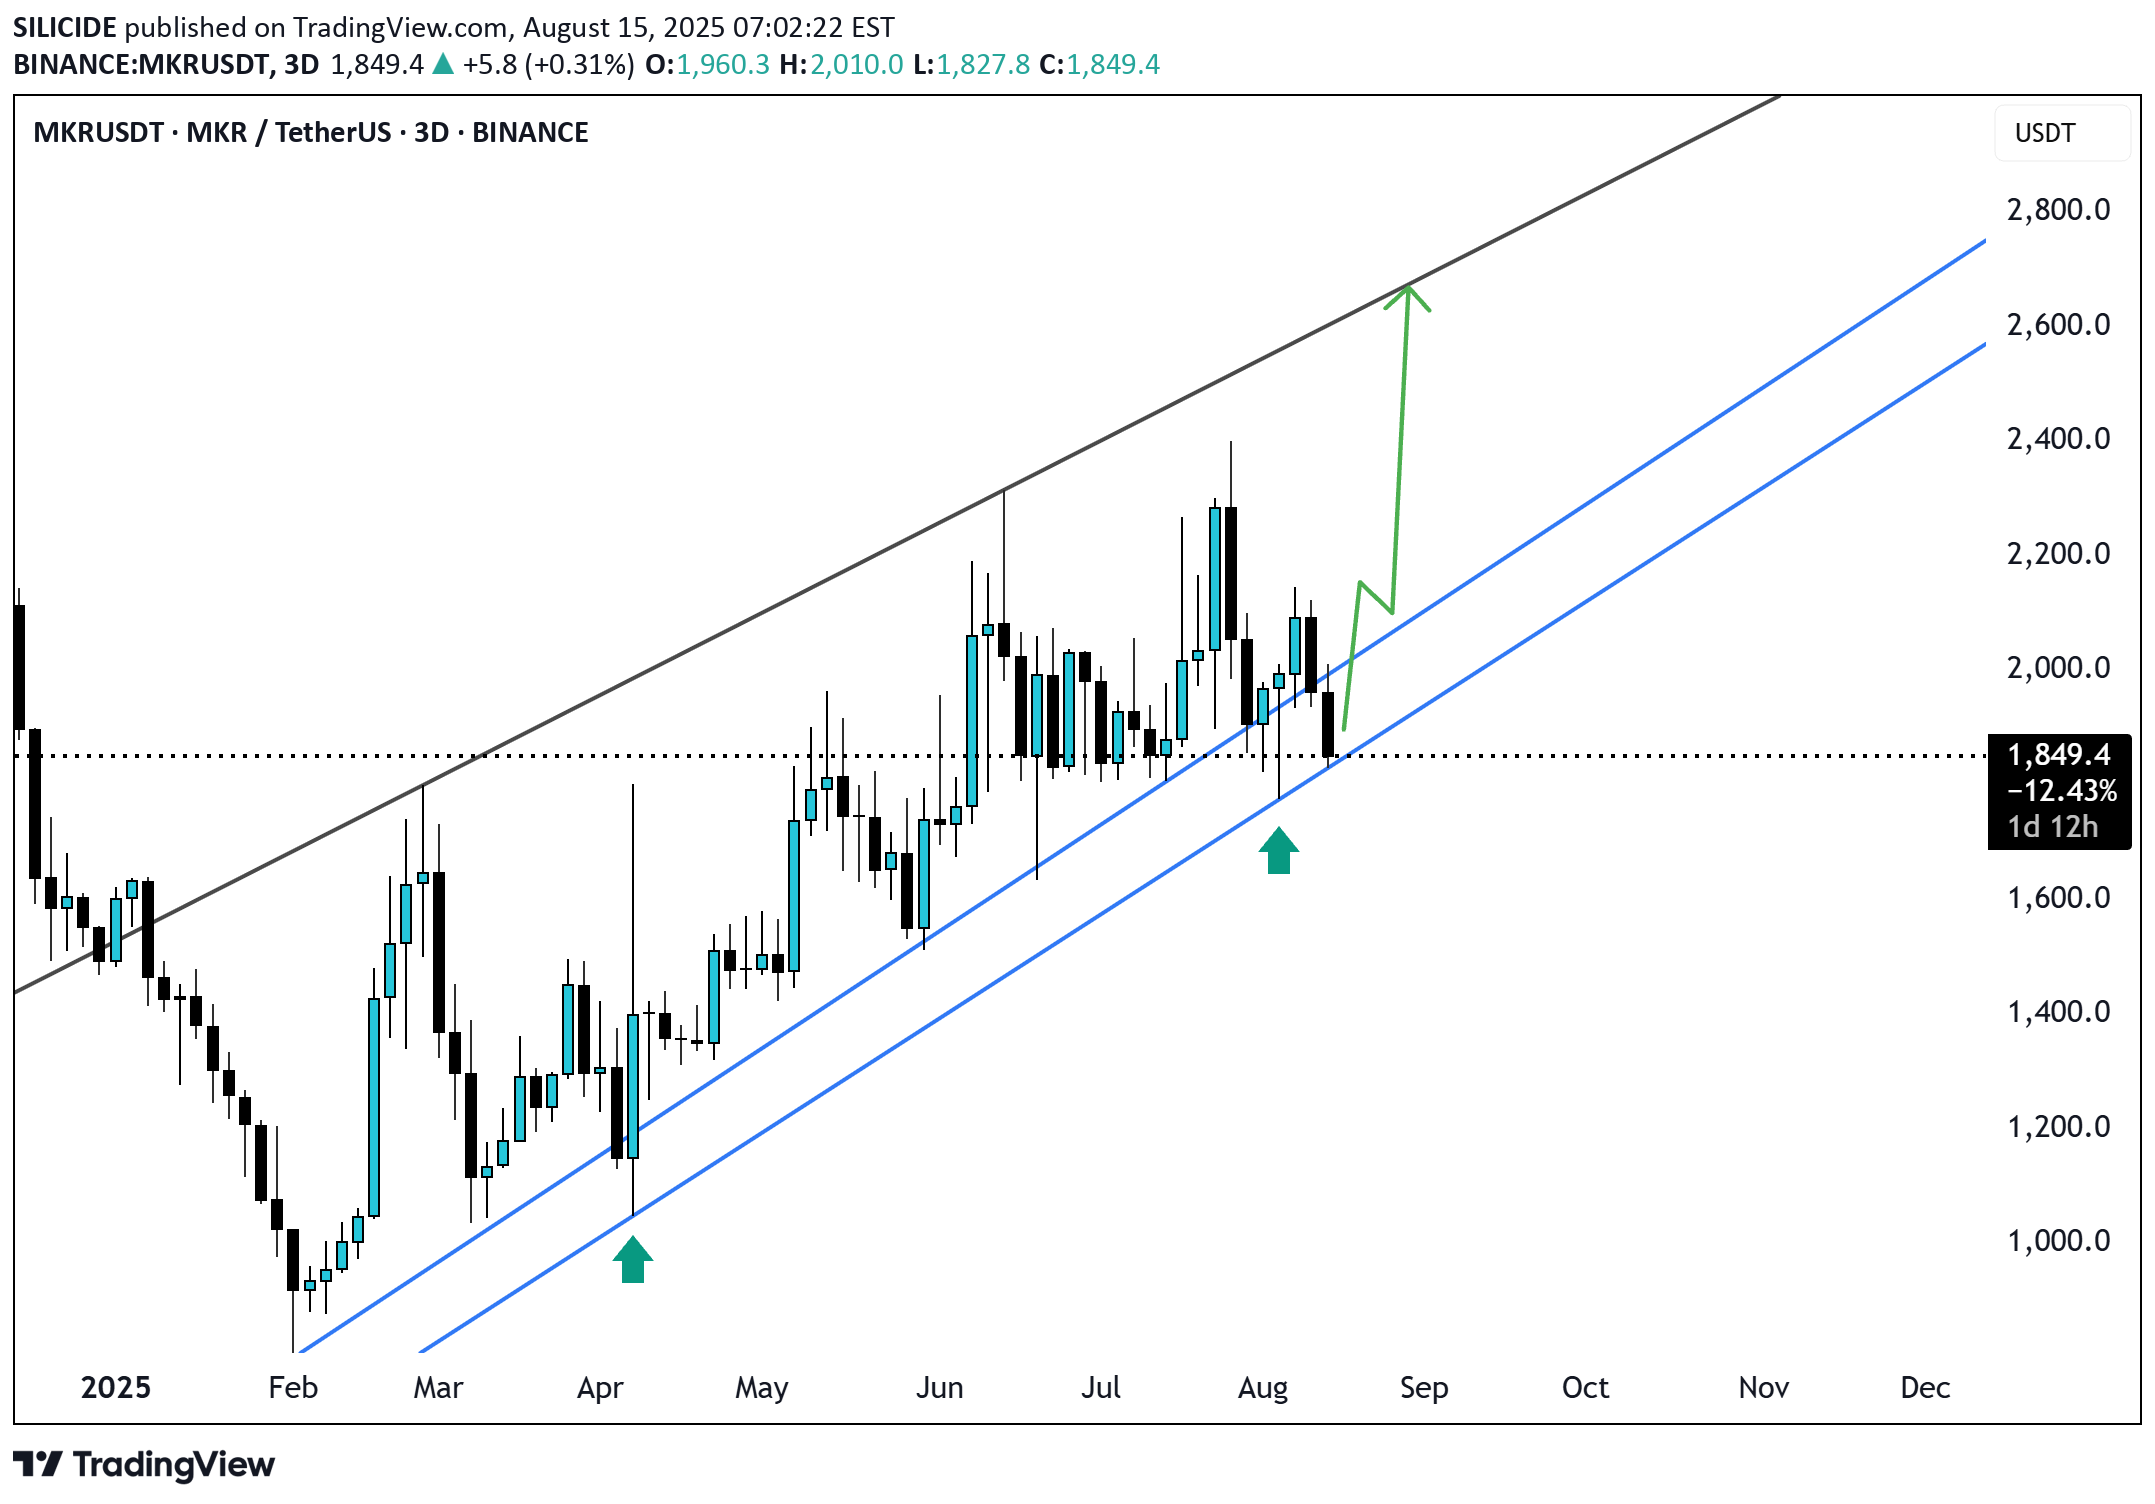
MKRUSDT is currently trading within a channel and has reached the outer support level — a zone from which the price has bounced twice in the past. If history repeats, a third upward move from this level is possible, offering a strong risk-to-reward (R:R) opportunity. A stop-loss can be placed around 1800 or 1750. If the price breaks below this level, wait for a retest of the broken support before entering a sell position. Until then, the market outlook remains bullish.

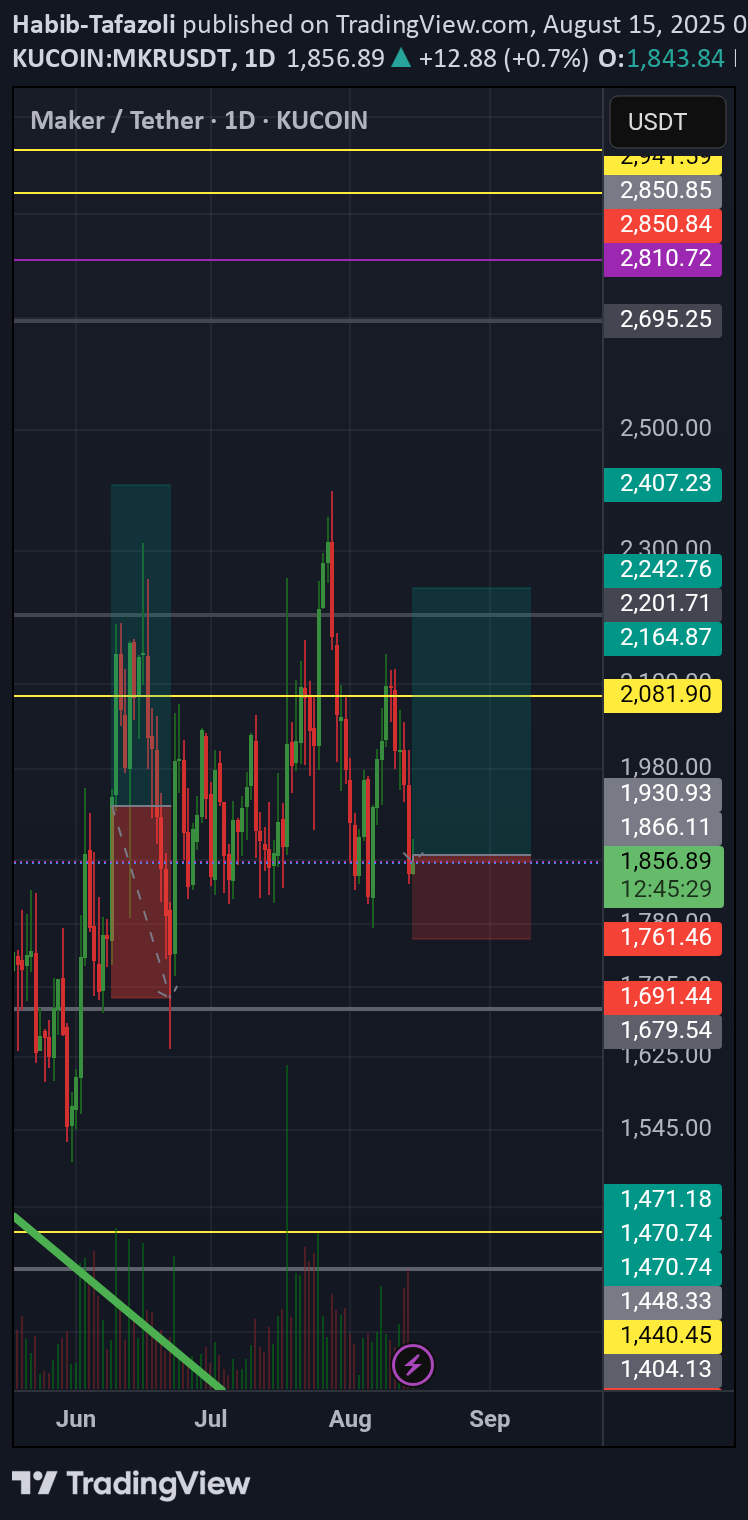
Habib-Tafazoli
Maker

CompoundingGain
$MKR

safe to get back in this bubba seems to be lagging others invalid below 200 ema for now run it all back then maybe wee dip before daily close wed is for full send1.45% risk here
Disclaimer
Any content and materials included in Sahmeto's website and official communication channels are a compilation of personal opinions and analyses and are not binding. They do not constitute any recommendation for buying, selling, entering or exiting the stock market and cryptocurrency market. Also, all news and analyses included in the website and channels are merely republished information from official and unofficial domestic and foreign sources, and it is obvious that users of the said content are responsible for following up and ensuring the authenticity and accuracy of the materials. Therefore, while disclaiming responsibility, it is declared that the responsibility for any decision-making, action, and potential profit and loss in the capital market and cryptocurrency market lies with the trader.