SILICIDE
@t_SILICIDE

What symbols does the trader recommend buying?
Purchase History
پیام های تریدر
Filter
SILICIDE
پیشبینی حرکت بعدی بیت کوین: آیا قیمت به ۱۰۰,۰۰۰ دلار میرسد؟
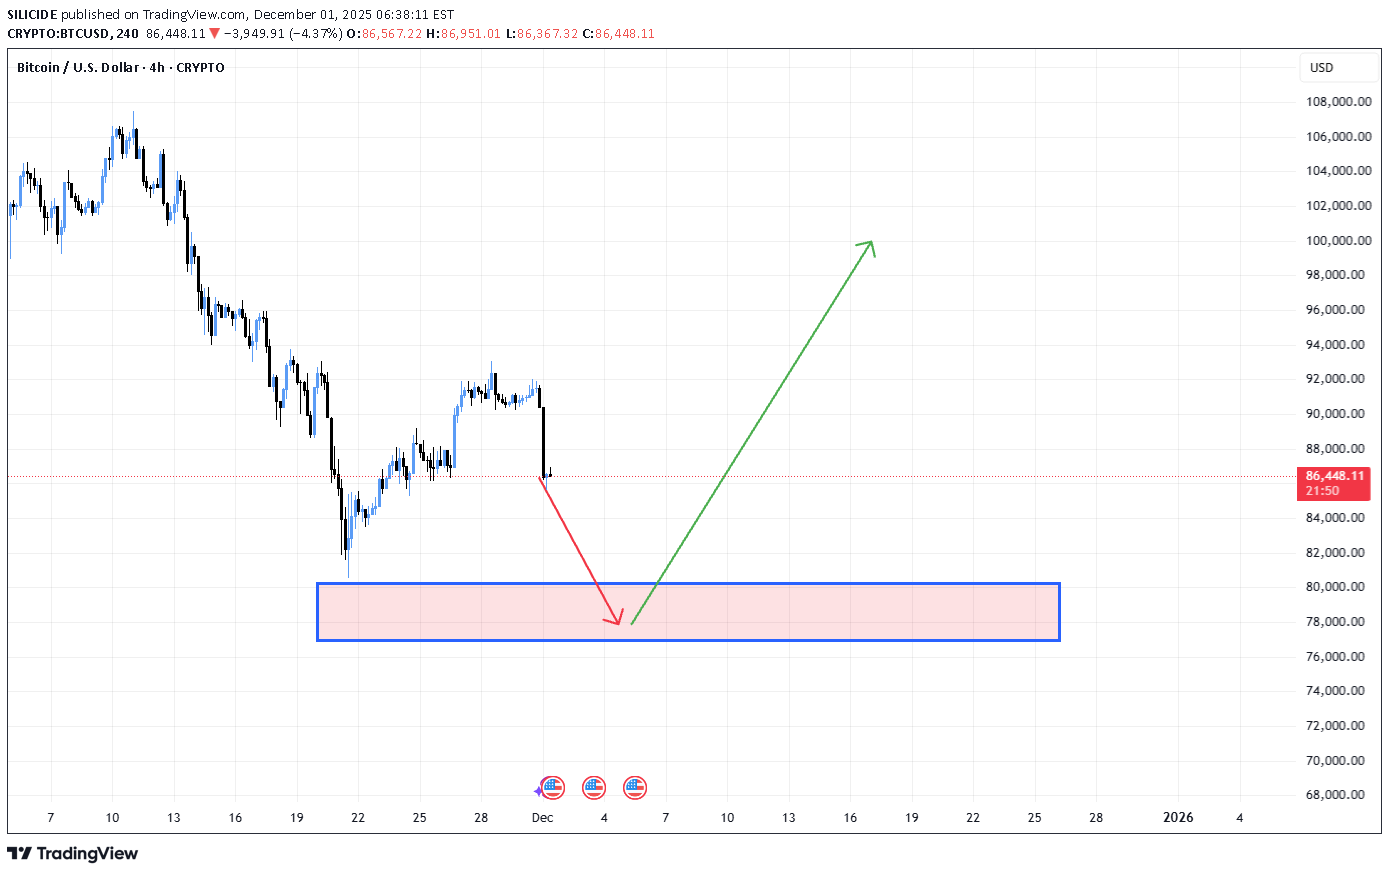
BTCUSD in correction phase and soon the Price will pullback from 75000-80000 range and again price may reach the target of 100000. let us see how it plays out
SILICIDE
سقوط بزرگ بیت کوین: آیا اصلاح قیمت به مرحله برگشت رسیده است؟
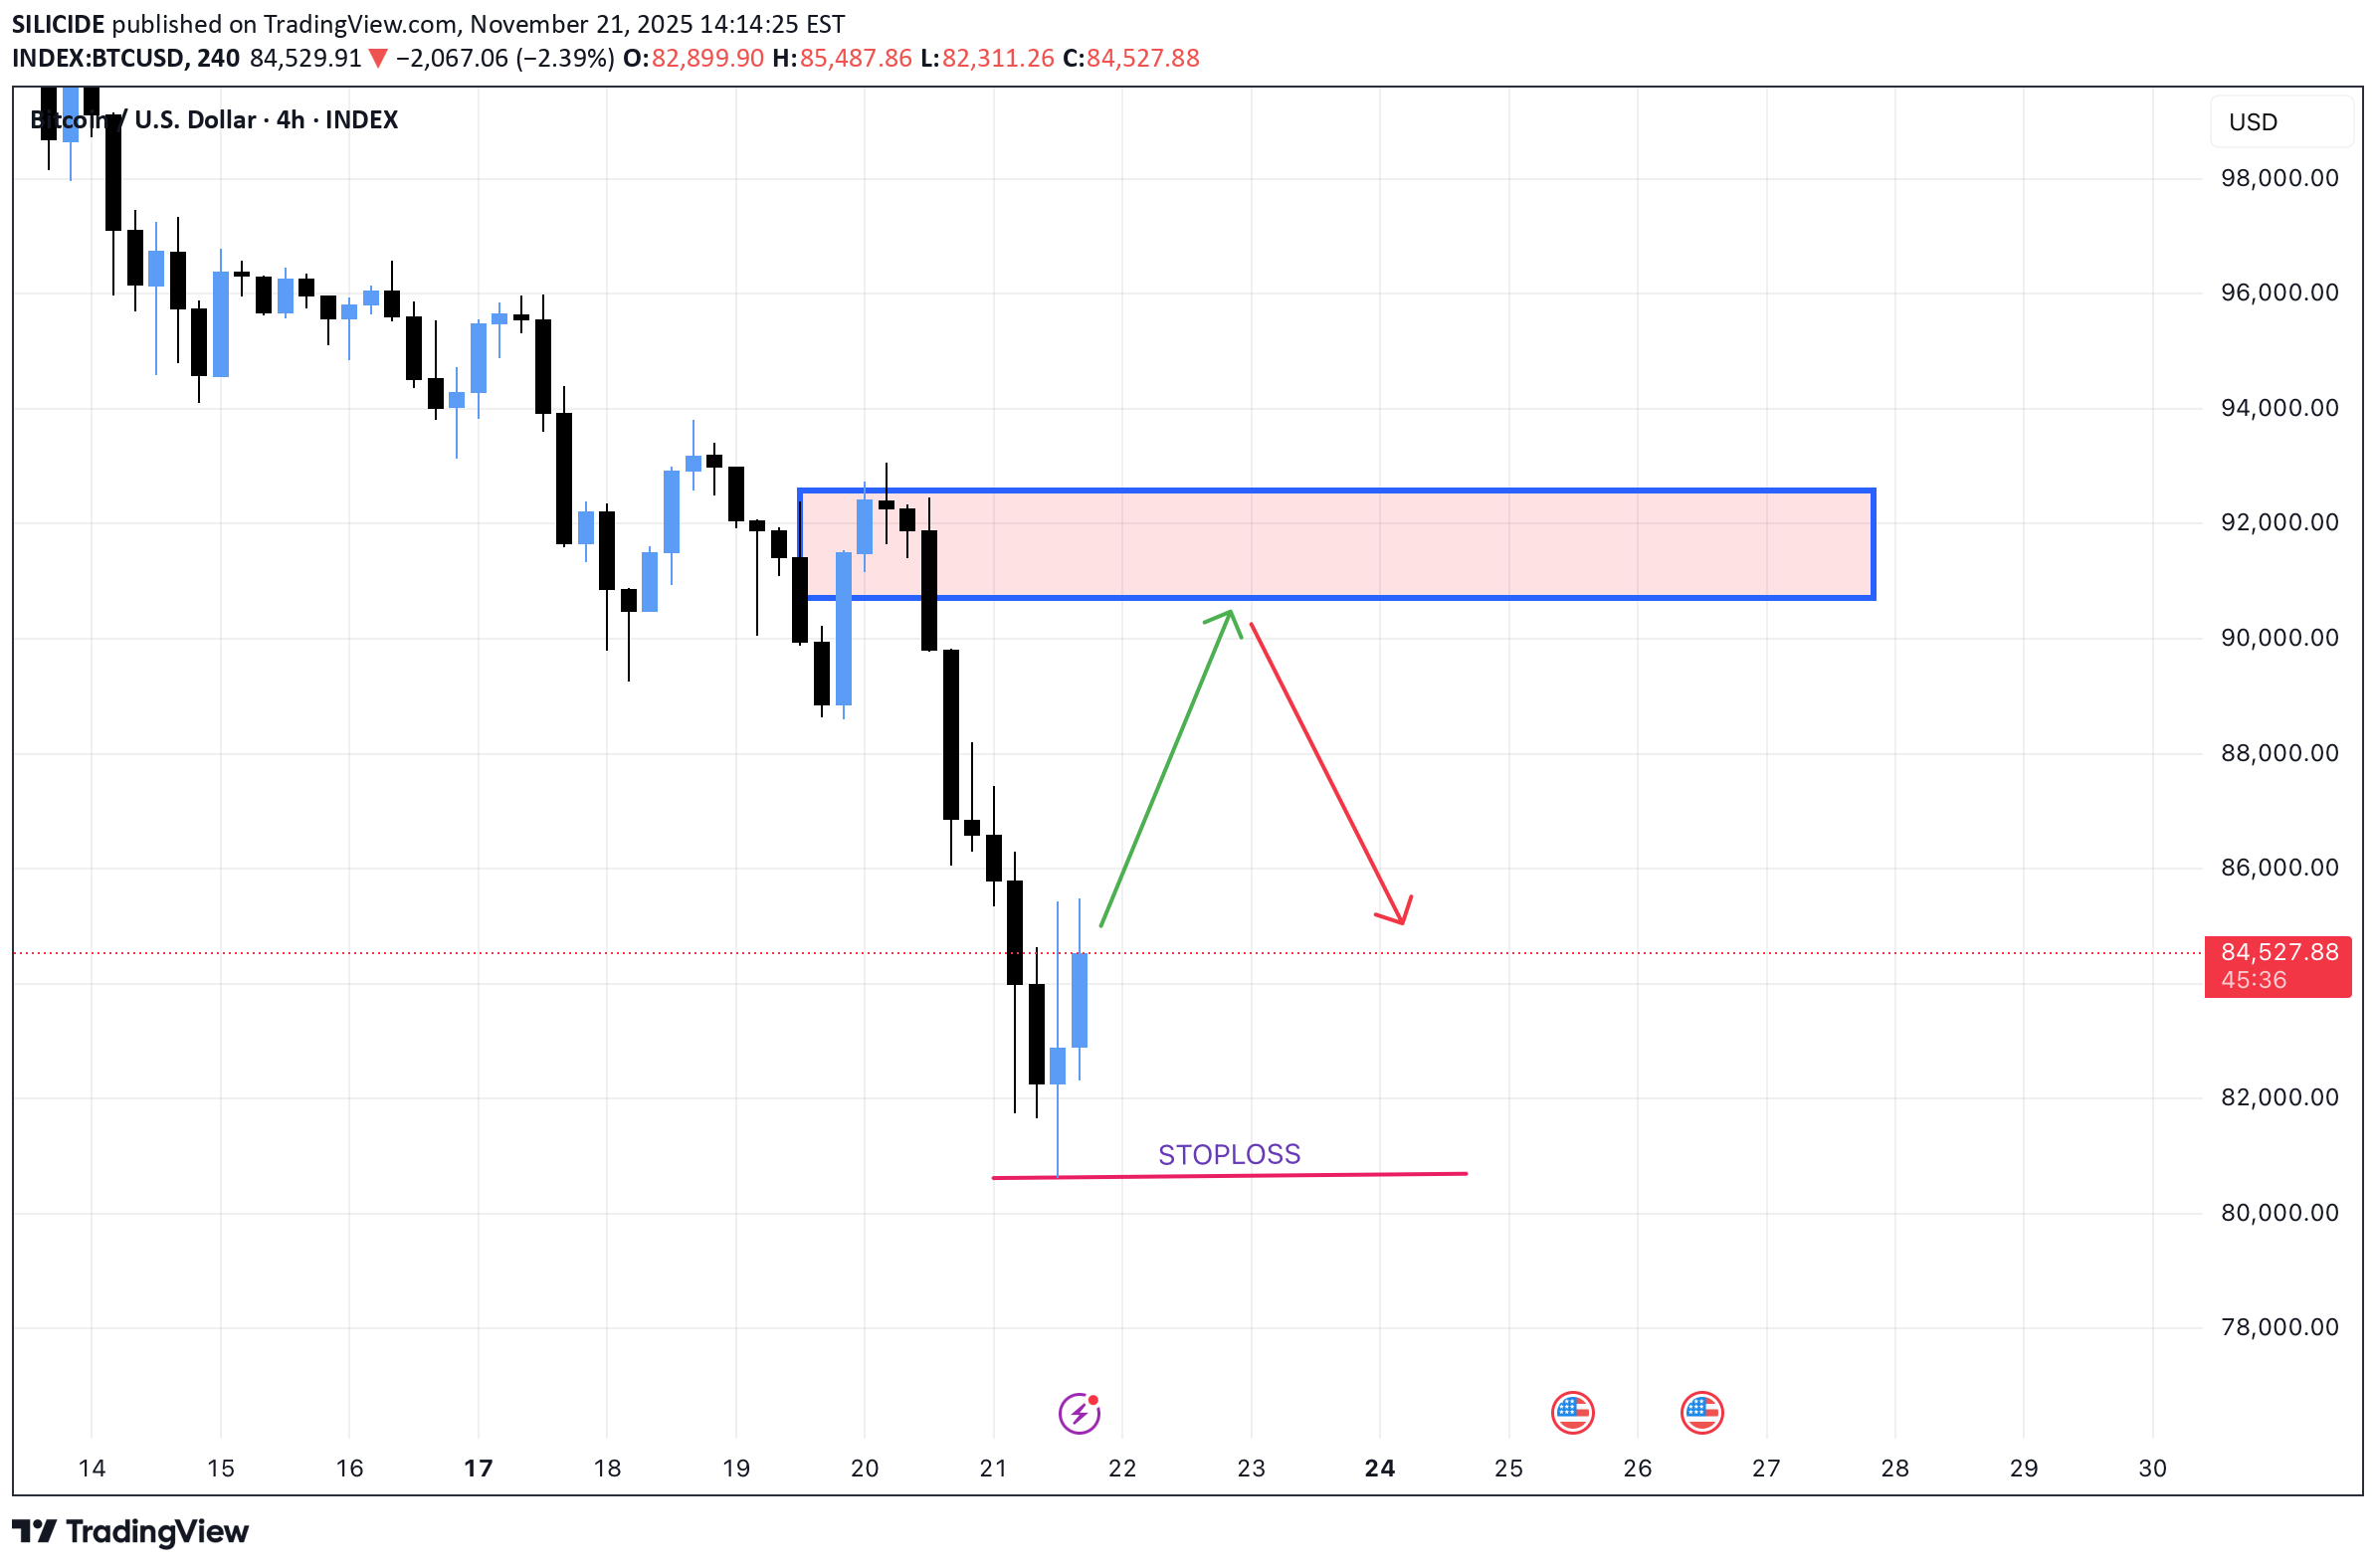
After big fall btcusd in correction phase and price may reach again resistance area and then fall again let us see how it plays out ,./,Wownow go for short long is over
SILICIDE
احتمال جهش بزرگ بیت کوین: آیا زمان خرید BTCUSD فرا رسیده است؟
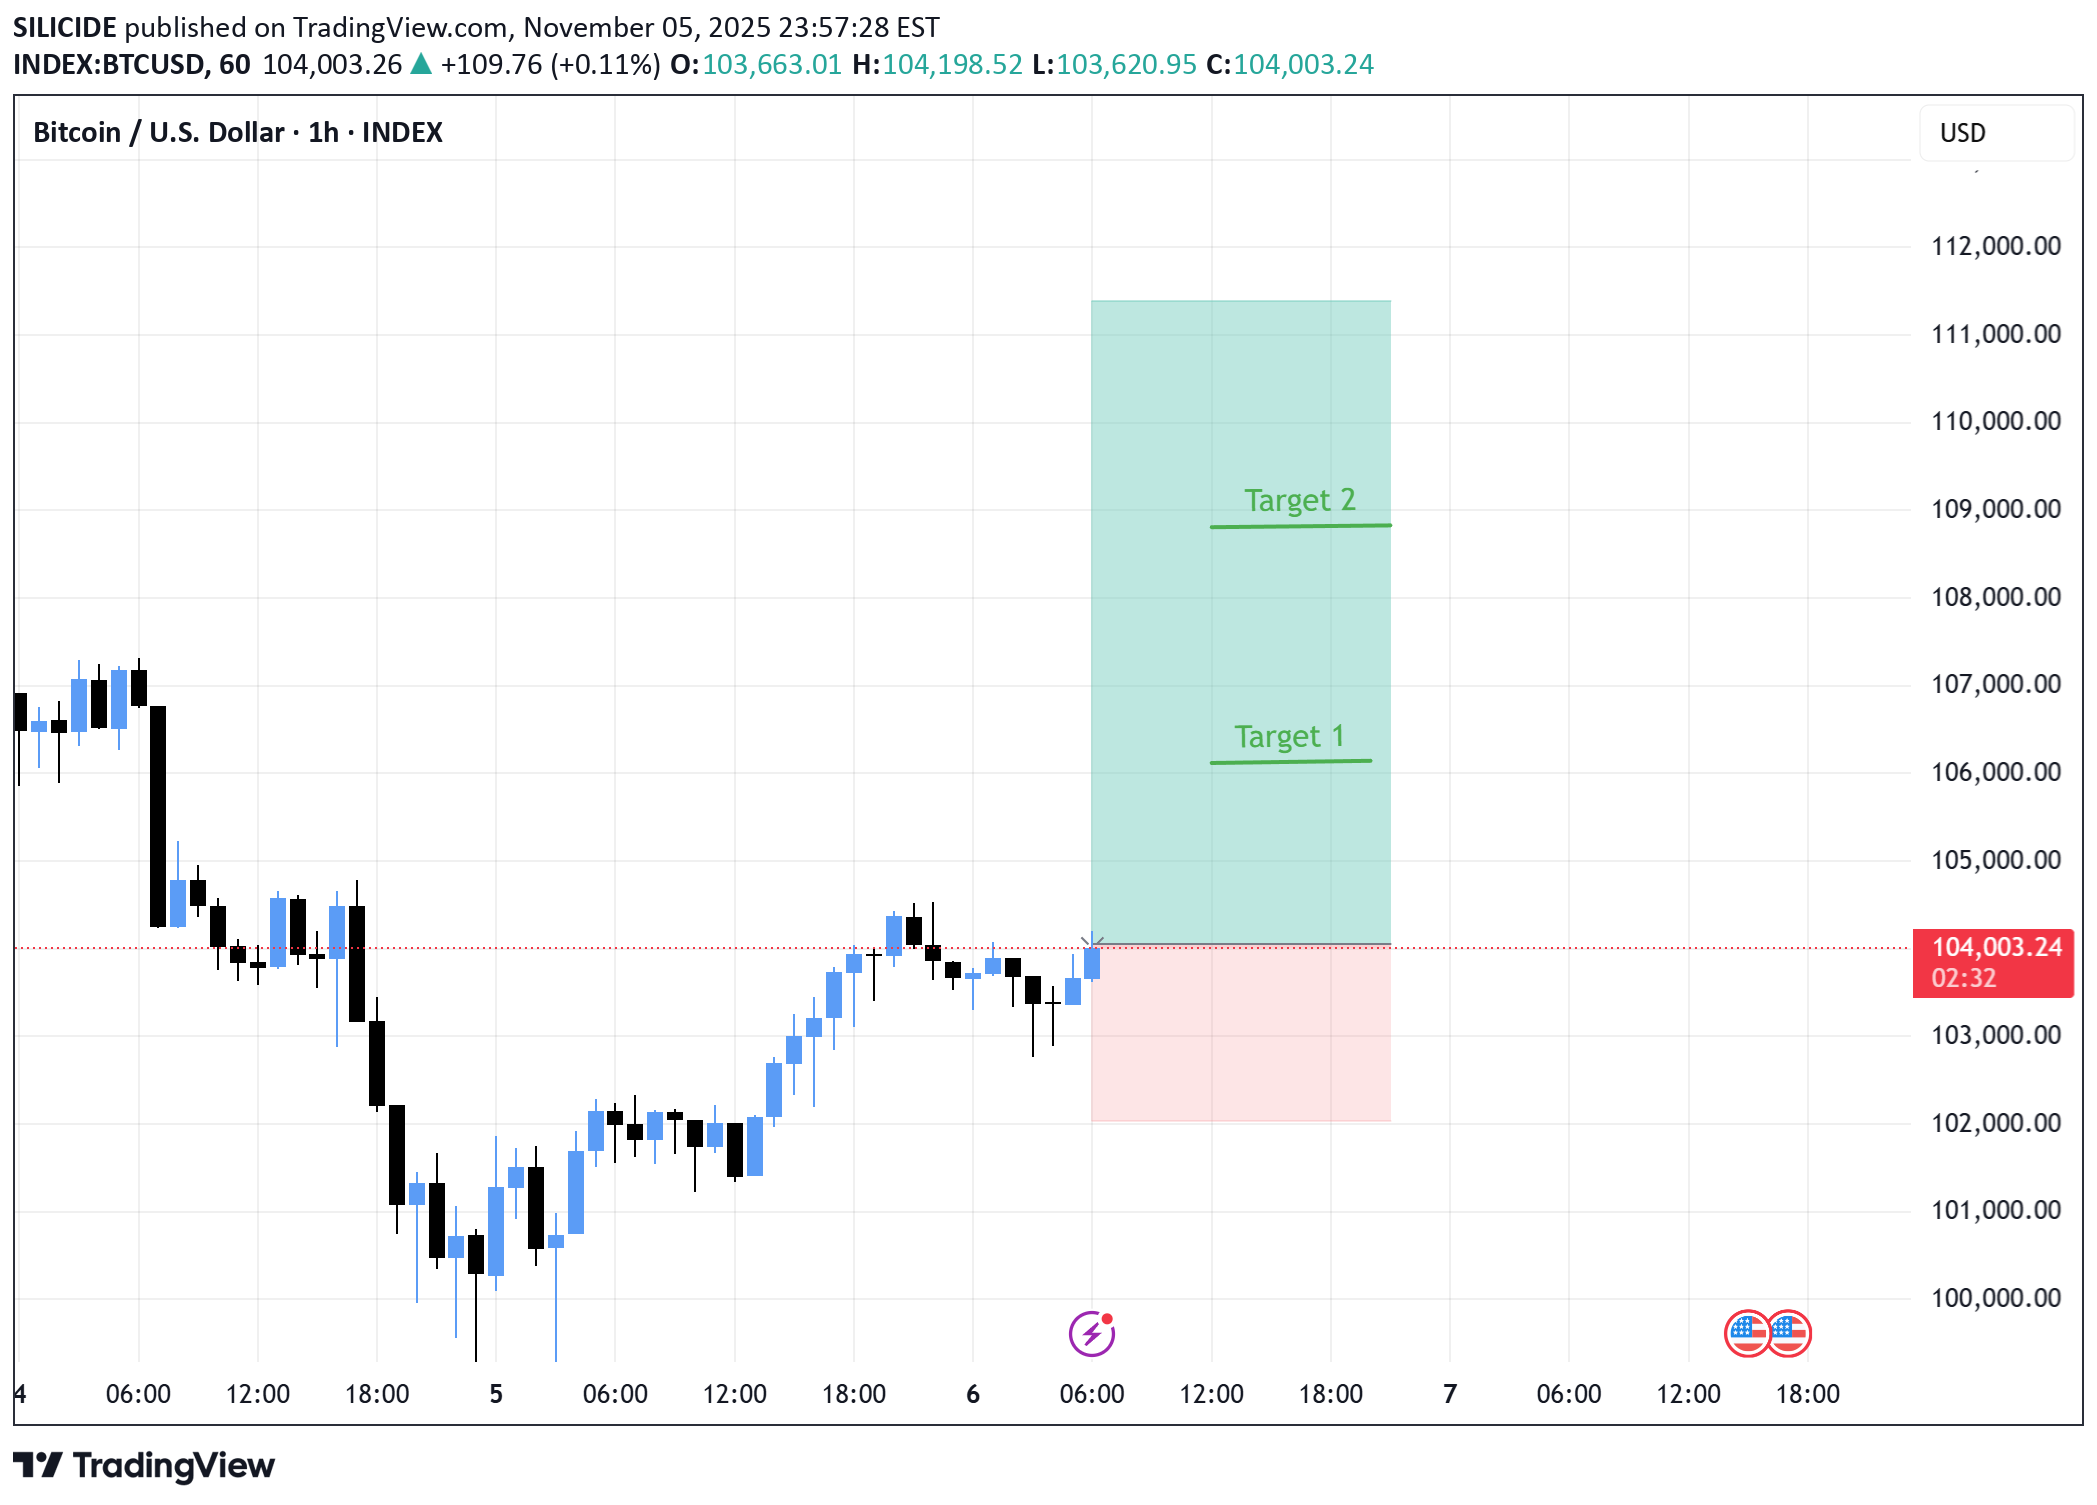
BTCUSD Recenlty fell drastically from 124 to 100 and now pullback of price is possible. LEt us see how it plays out
SILICIDE
سناریوهای احتمالی طلا (XAUUSD) هفته آینده: آیا به 4200 میرسد یا سقوط میکند؟
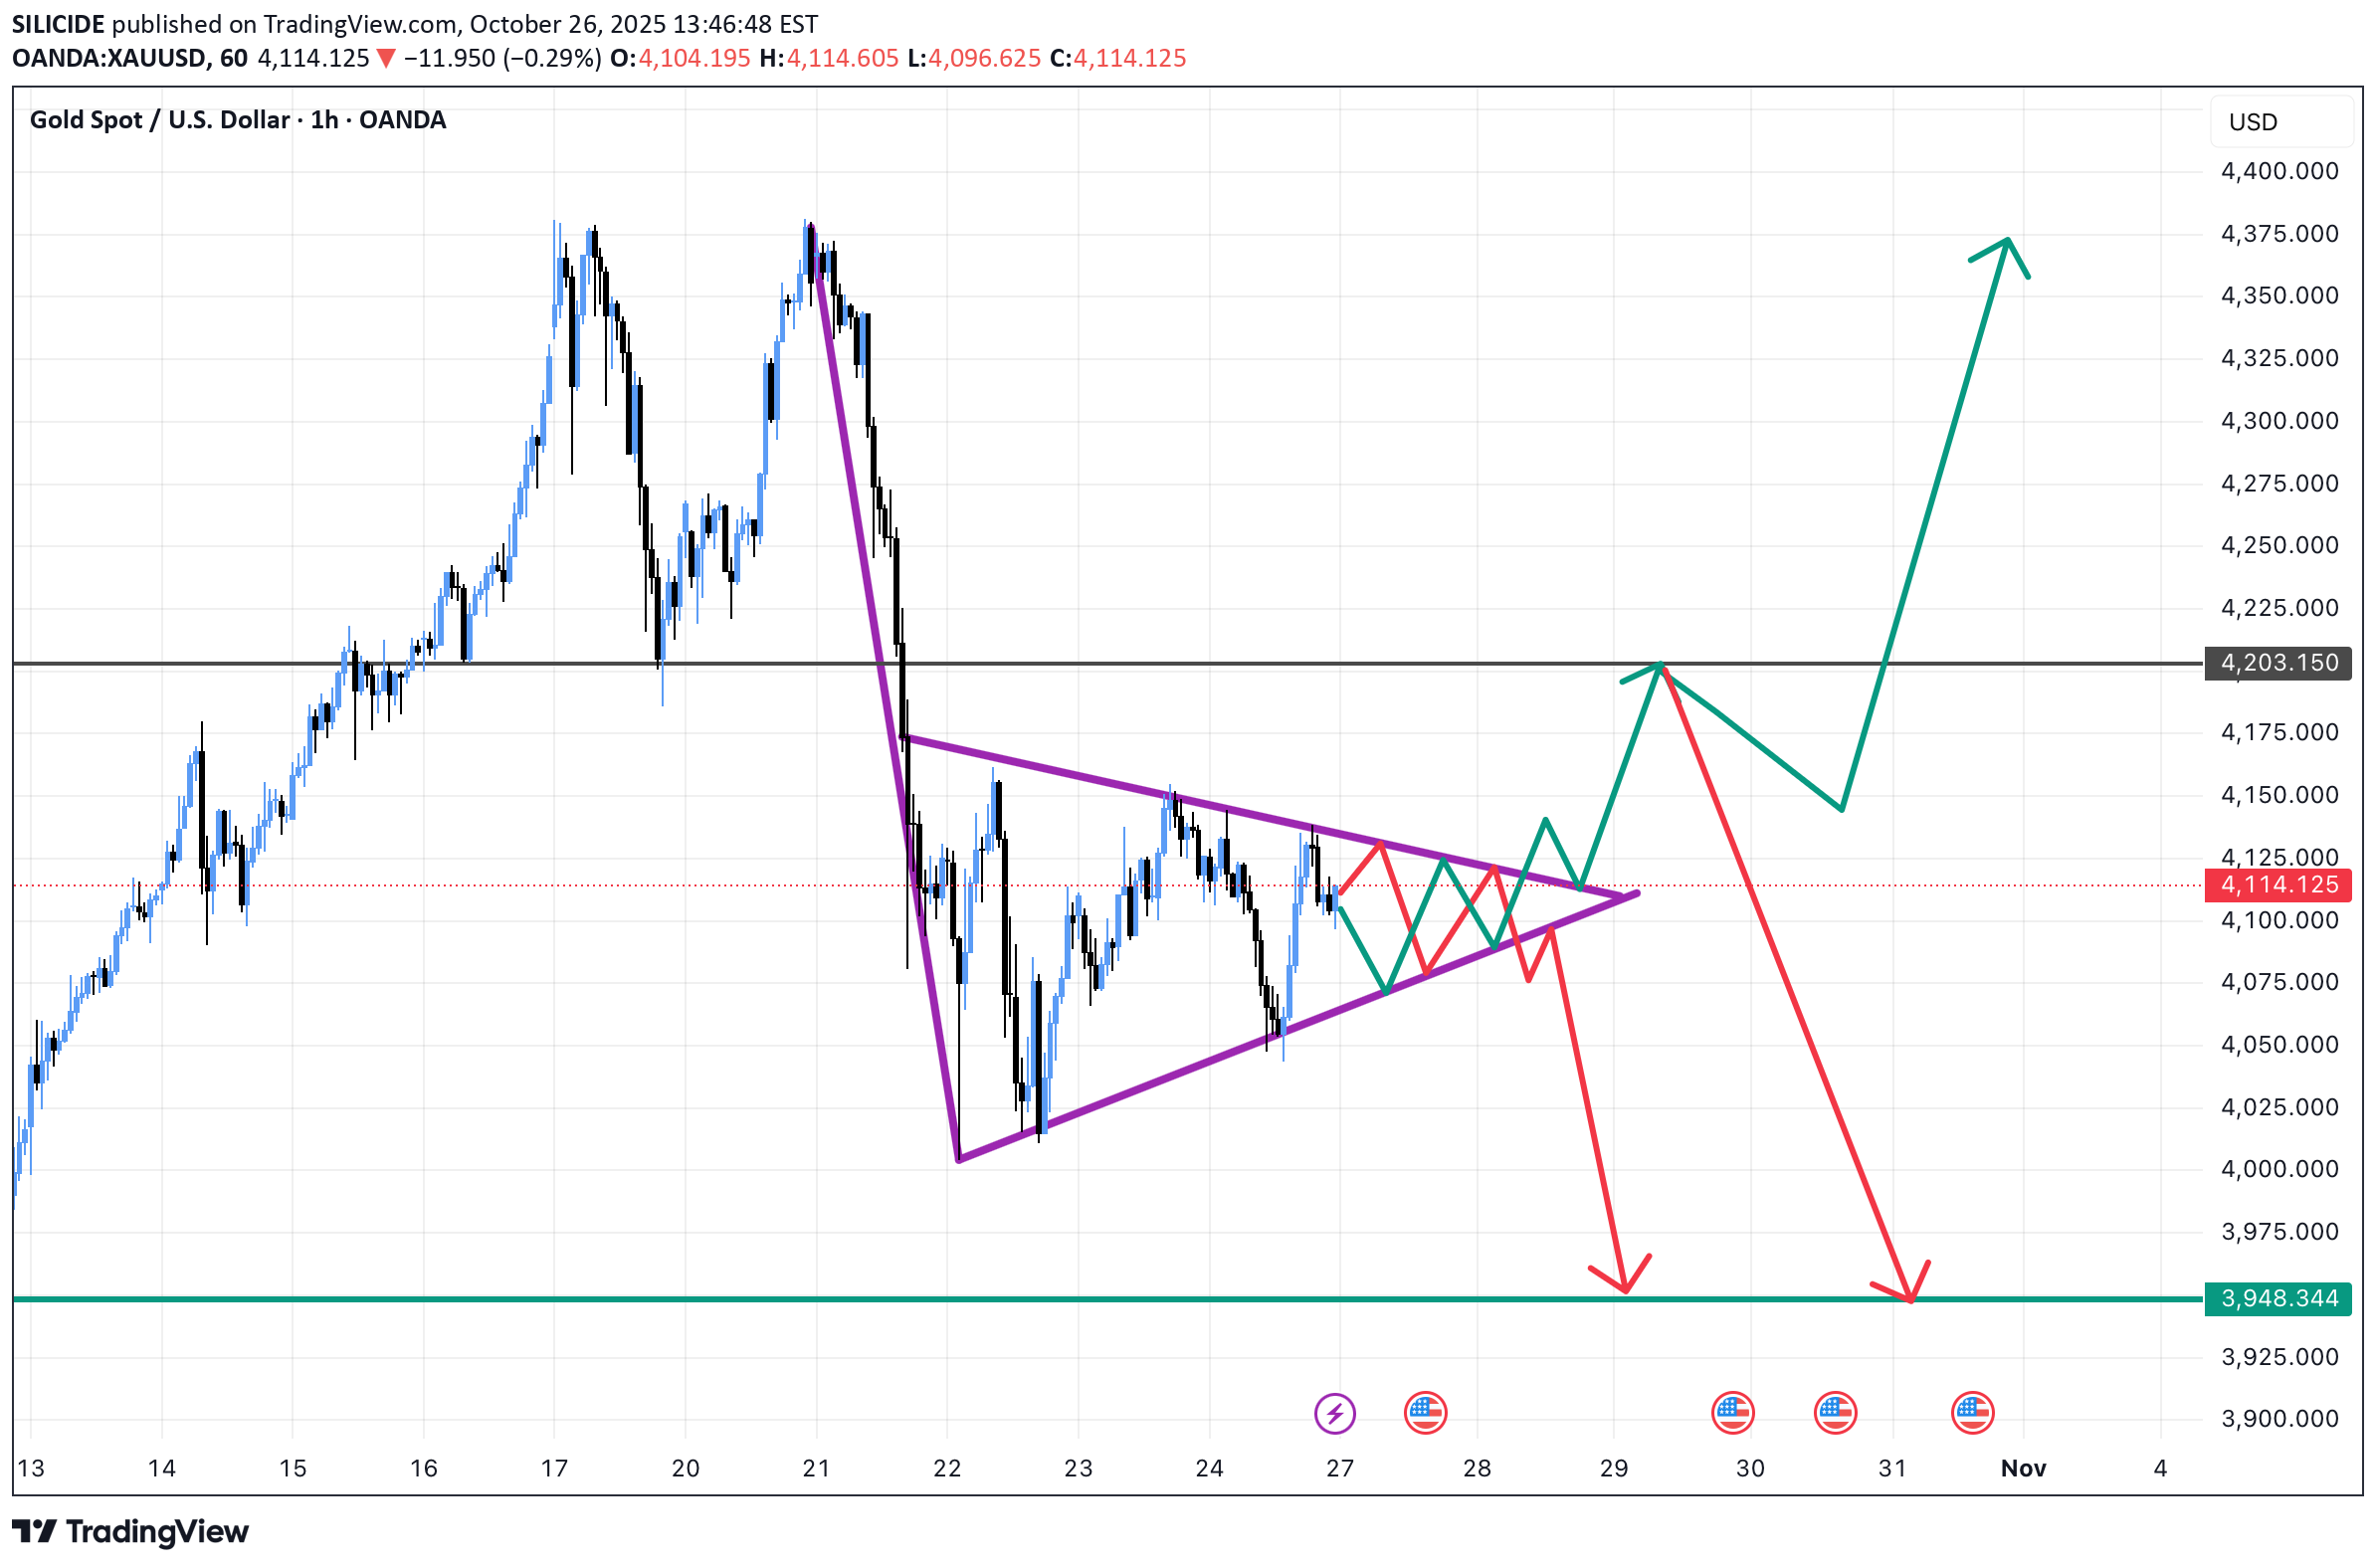
I have shown possible movement that can trigger next week … I personally feel it can go 4200 and then fall below 4000 , let us see how it plays out
SILICIDE
دستکاری قیمت بیت کوین در تایم هفتگی: آیا صعود به ۱۱۶۰۰۰ قطعی است؟
Bicuspid showed weekly cls candle manipulation looks like price will go up till the range of 115000 to 116000 tendon let us see playsonait
SILICIDE
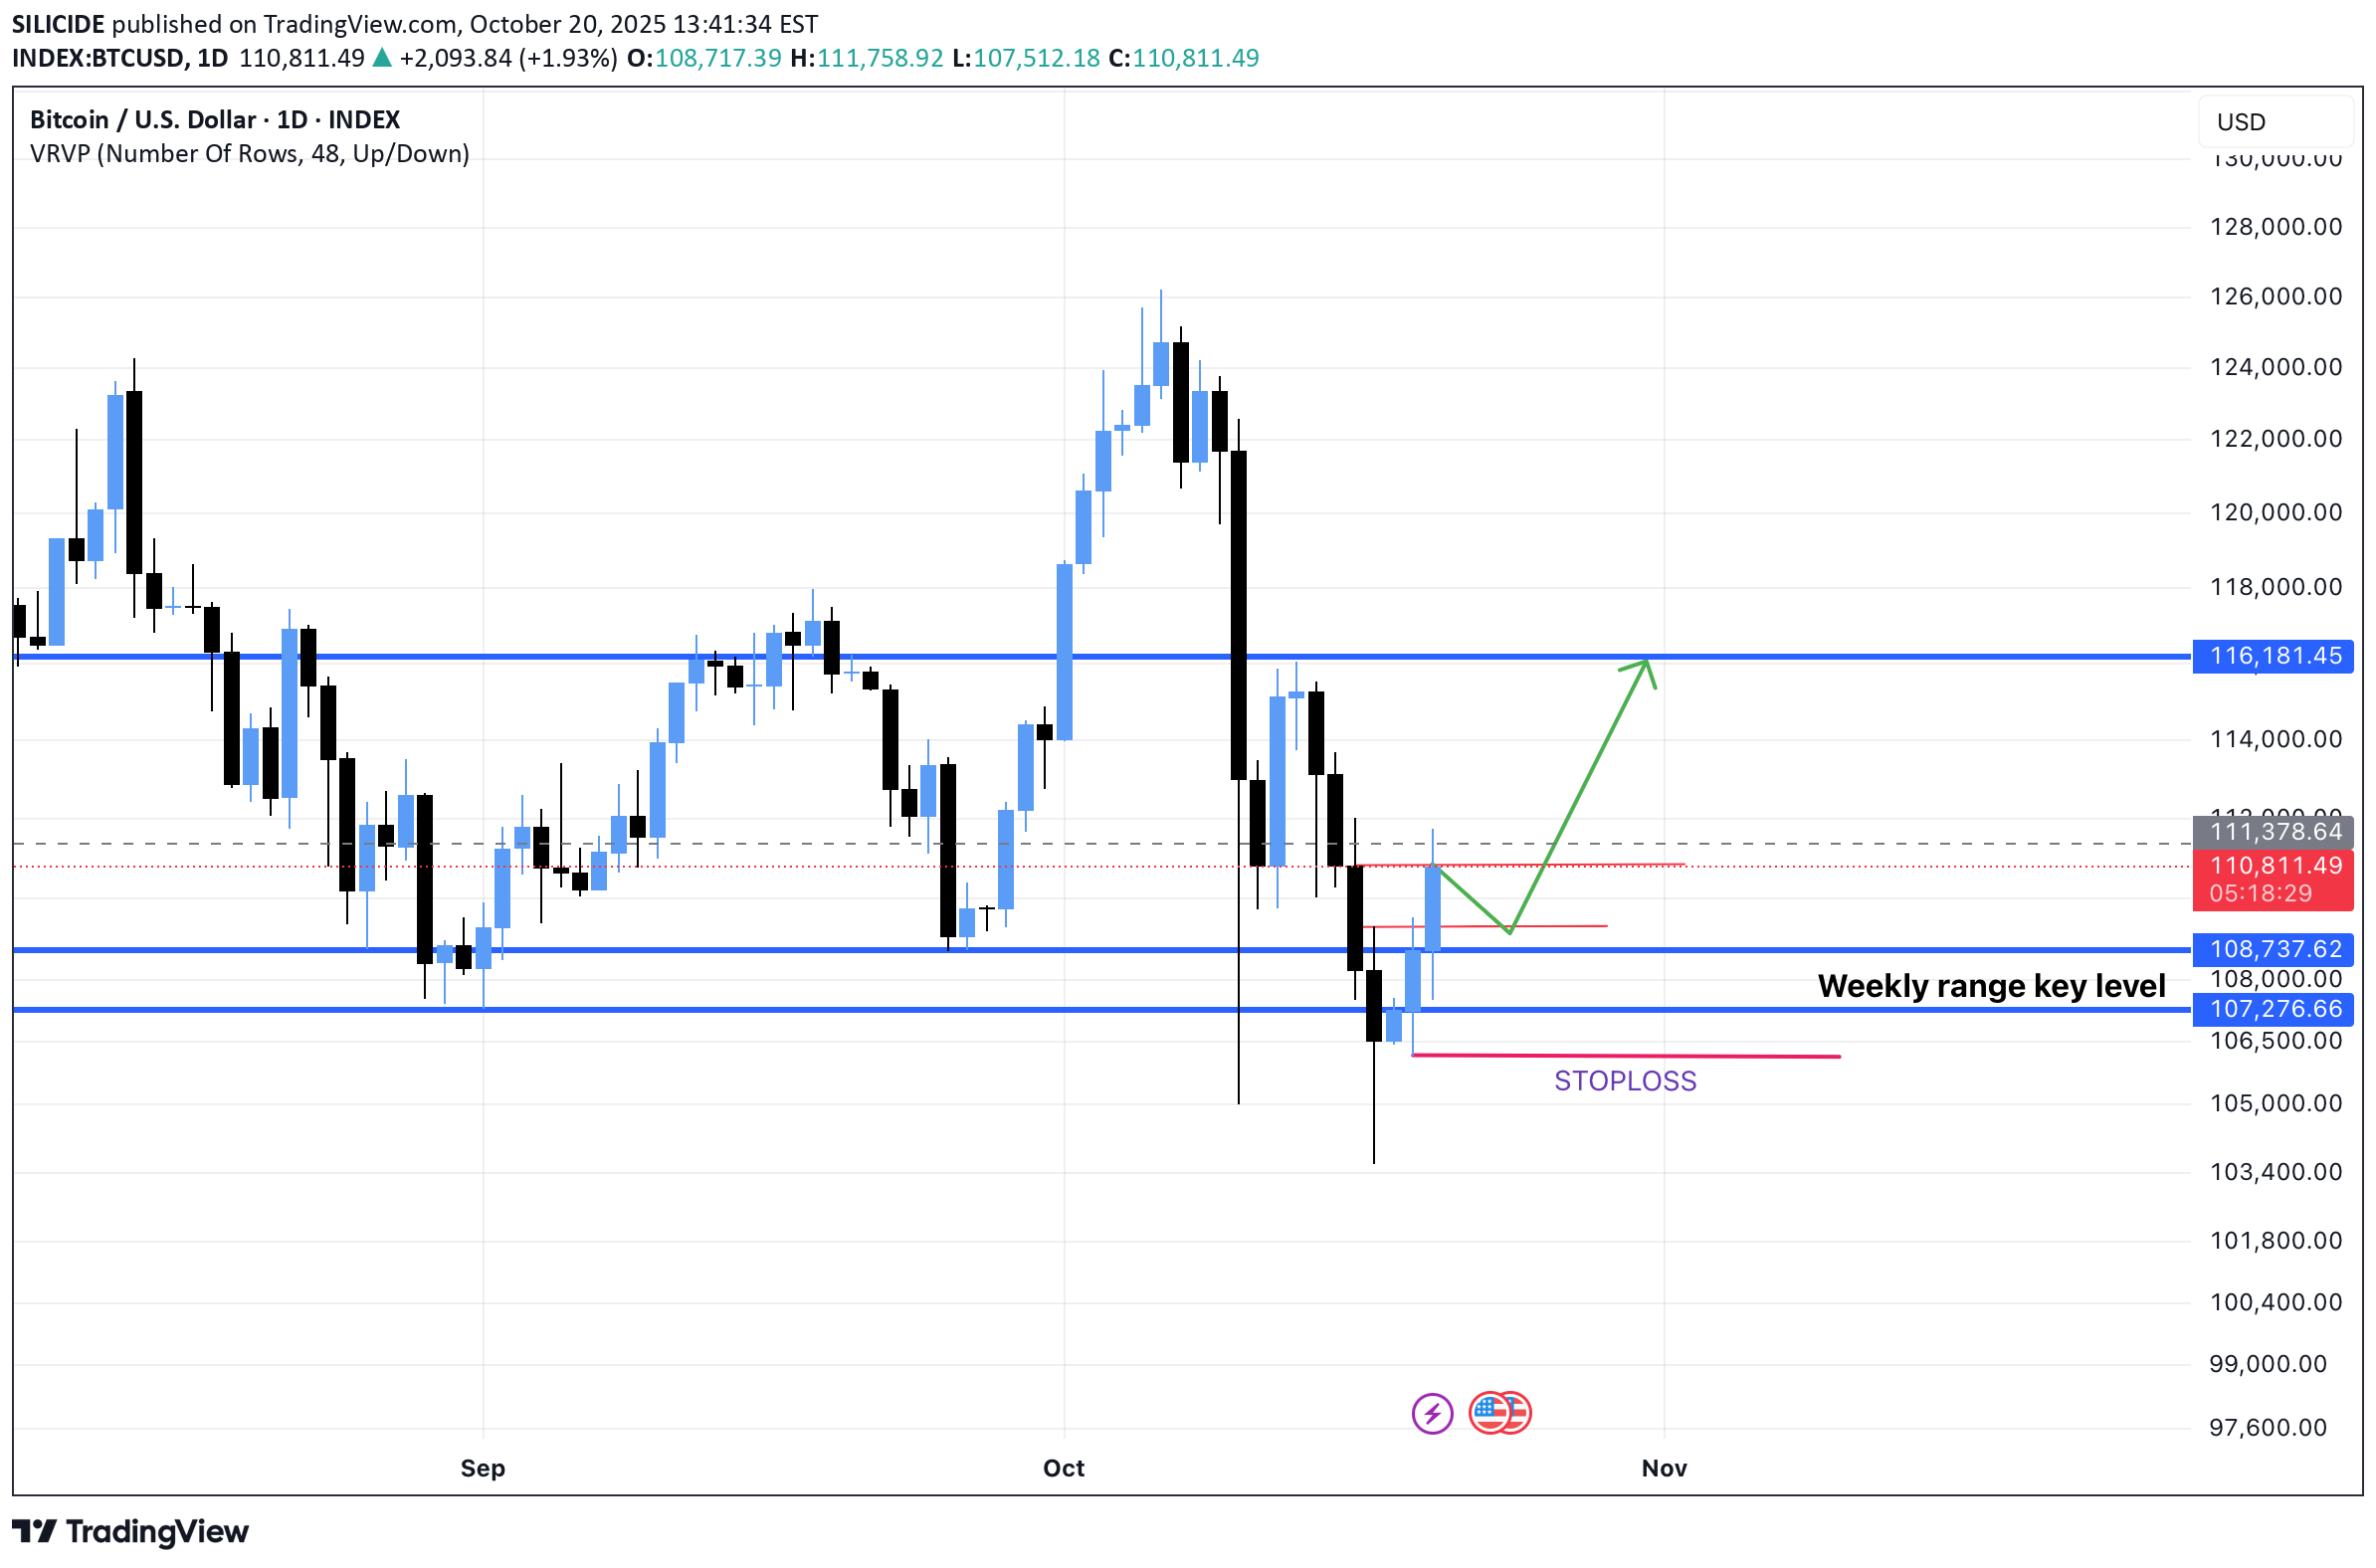
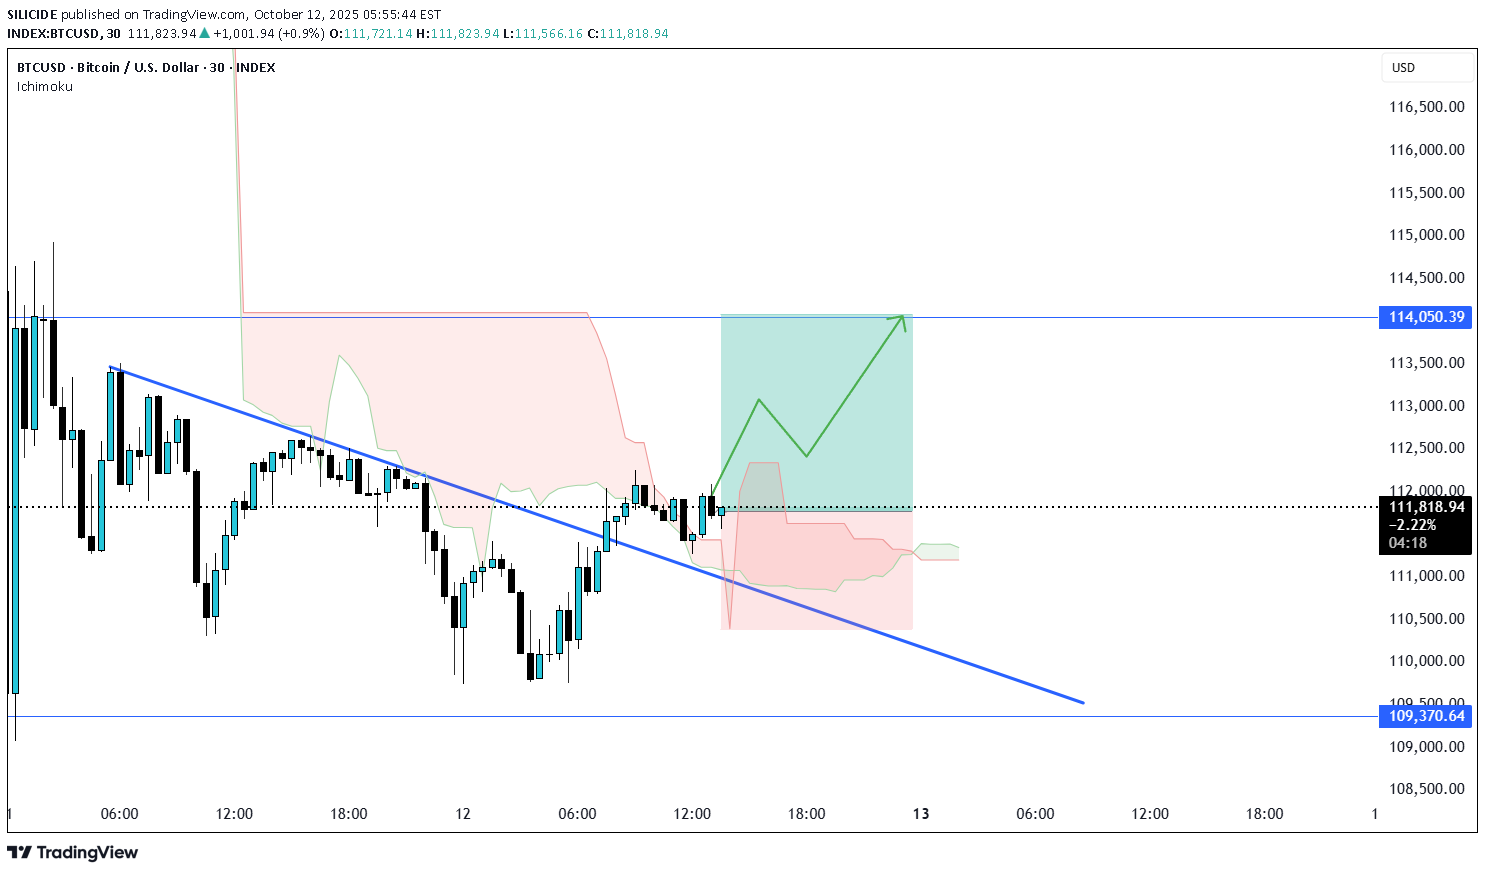
تحلیل و پیشبینی صعودی بیت کوین: آیا زمان خرید (لانگ) فرا رسیده است؟
Btcusd has fallen abruptly currently pull back in play Soon price may go up to resistance levelAdd more if comes to 113800add more if comes 113000At buying zone with SL 113000Good pull pack from 113000 let - see how it plays out.
SILICIDE
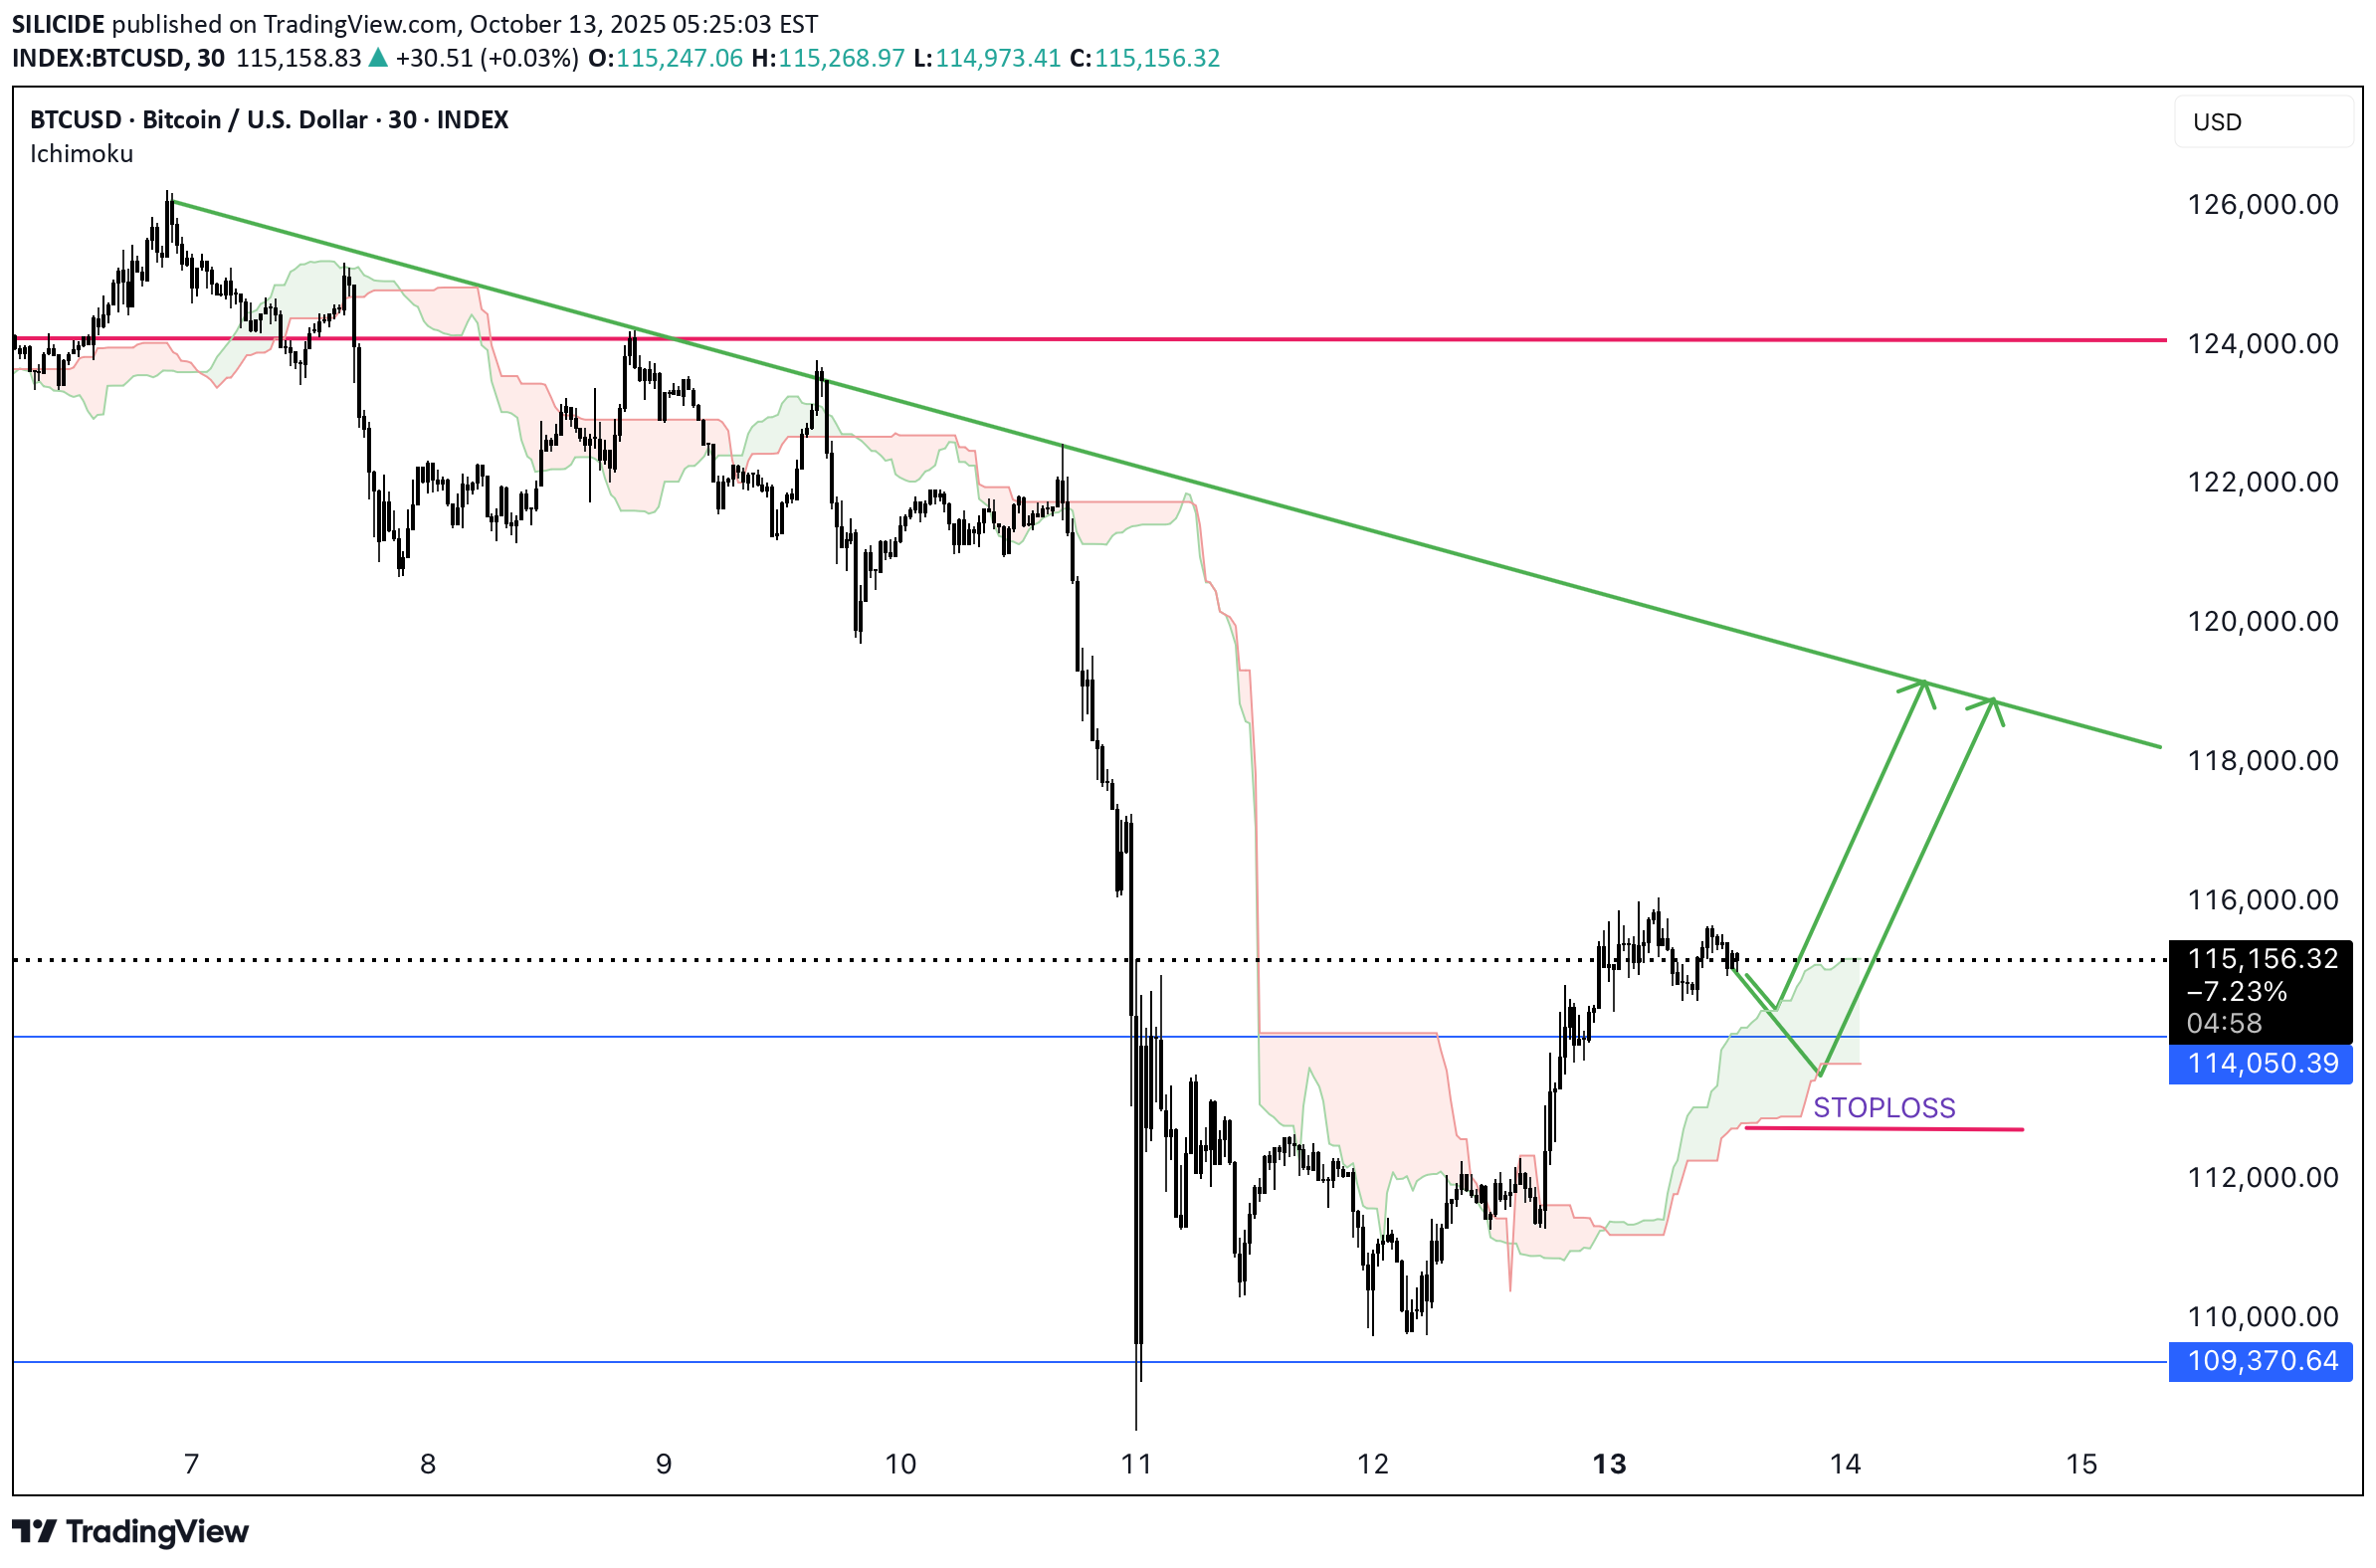
بیت کوین در مسیر ریزش؛ آیا اصلاح قیمتی به زودی آغاز میشود؟
BTCUSD has recently has in down trend and little pull back is possible to higher preice range. let u ssee how it plays out. now price has moved above the cloud and may contimue little more.Buy if drops to 110800-110900Boom Boom Boom! Move SL to breakevenCan go till 116000
SILICIDE
دستکاری بیتکوین در کف هفتهای: آیا ریزش کوتاه موفق خواهد شد؟
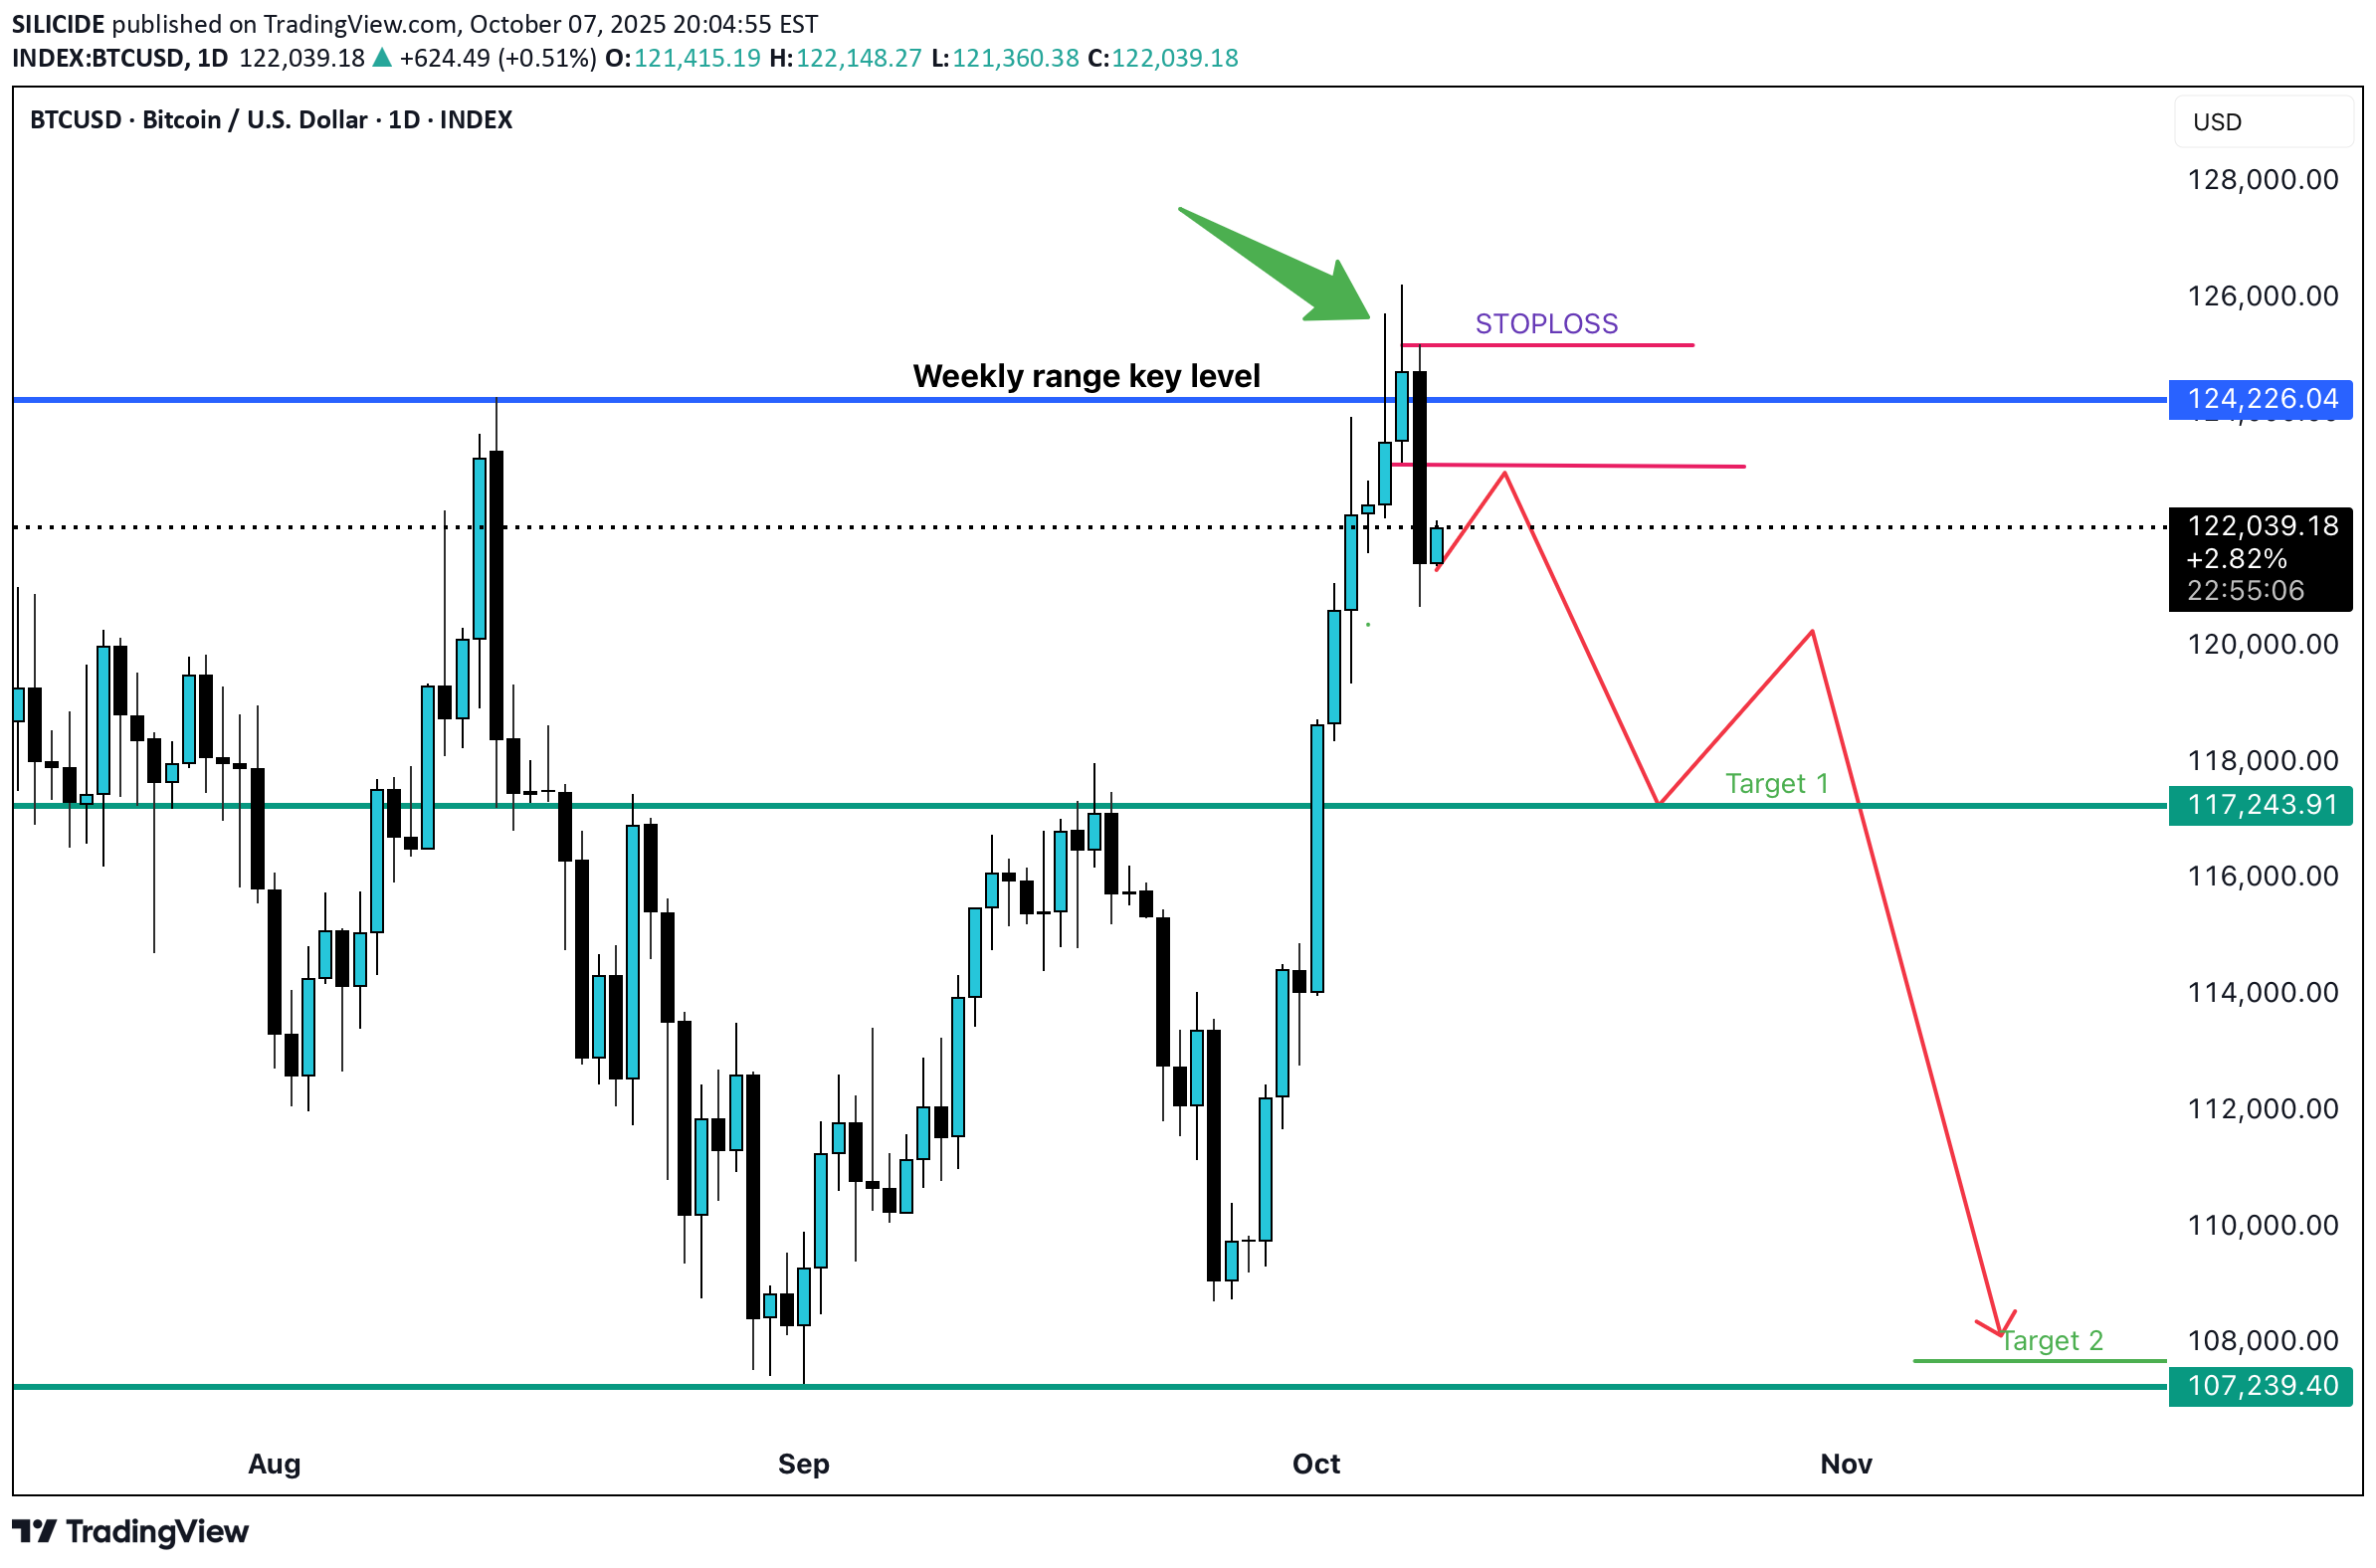
BTCUSD on daily frame showed the CLS candle manipulation and likely to go down short on pullback .SL tobreakerenExcellent move /:I;Target 1almost doneCan hold for target 2
SILICIDE
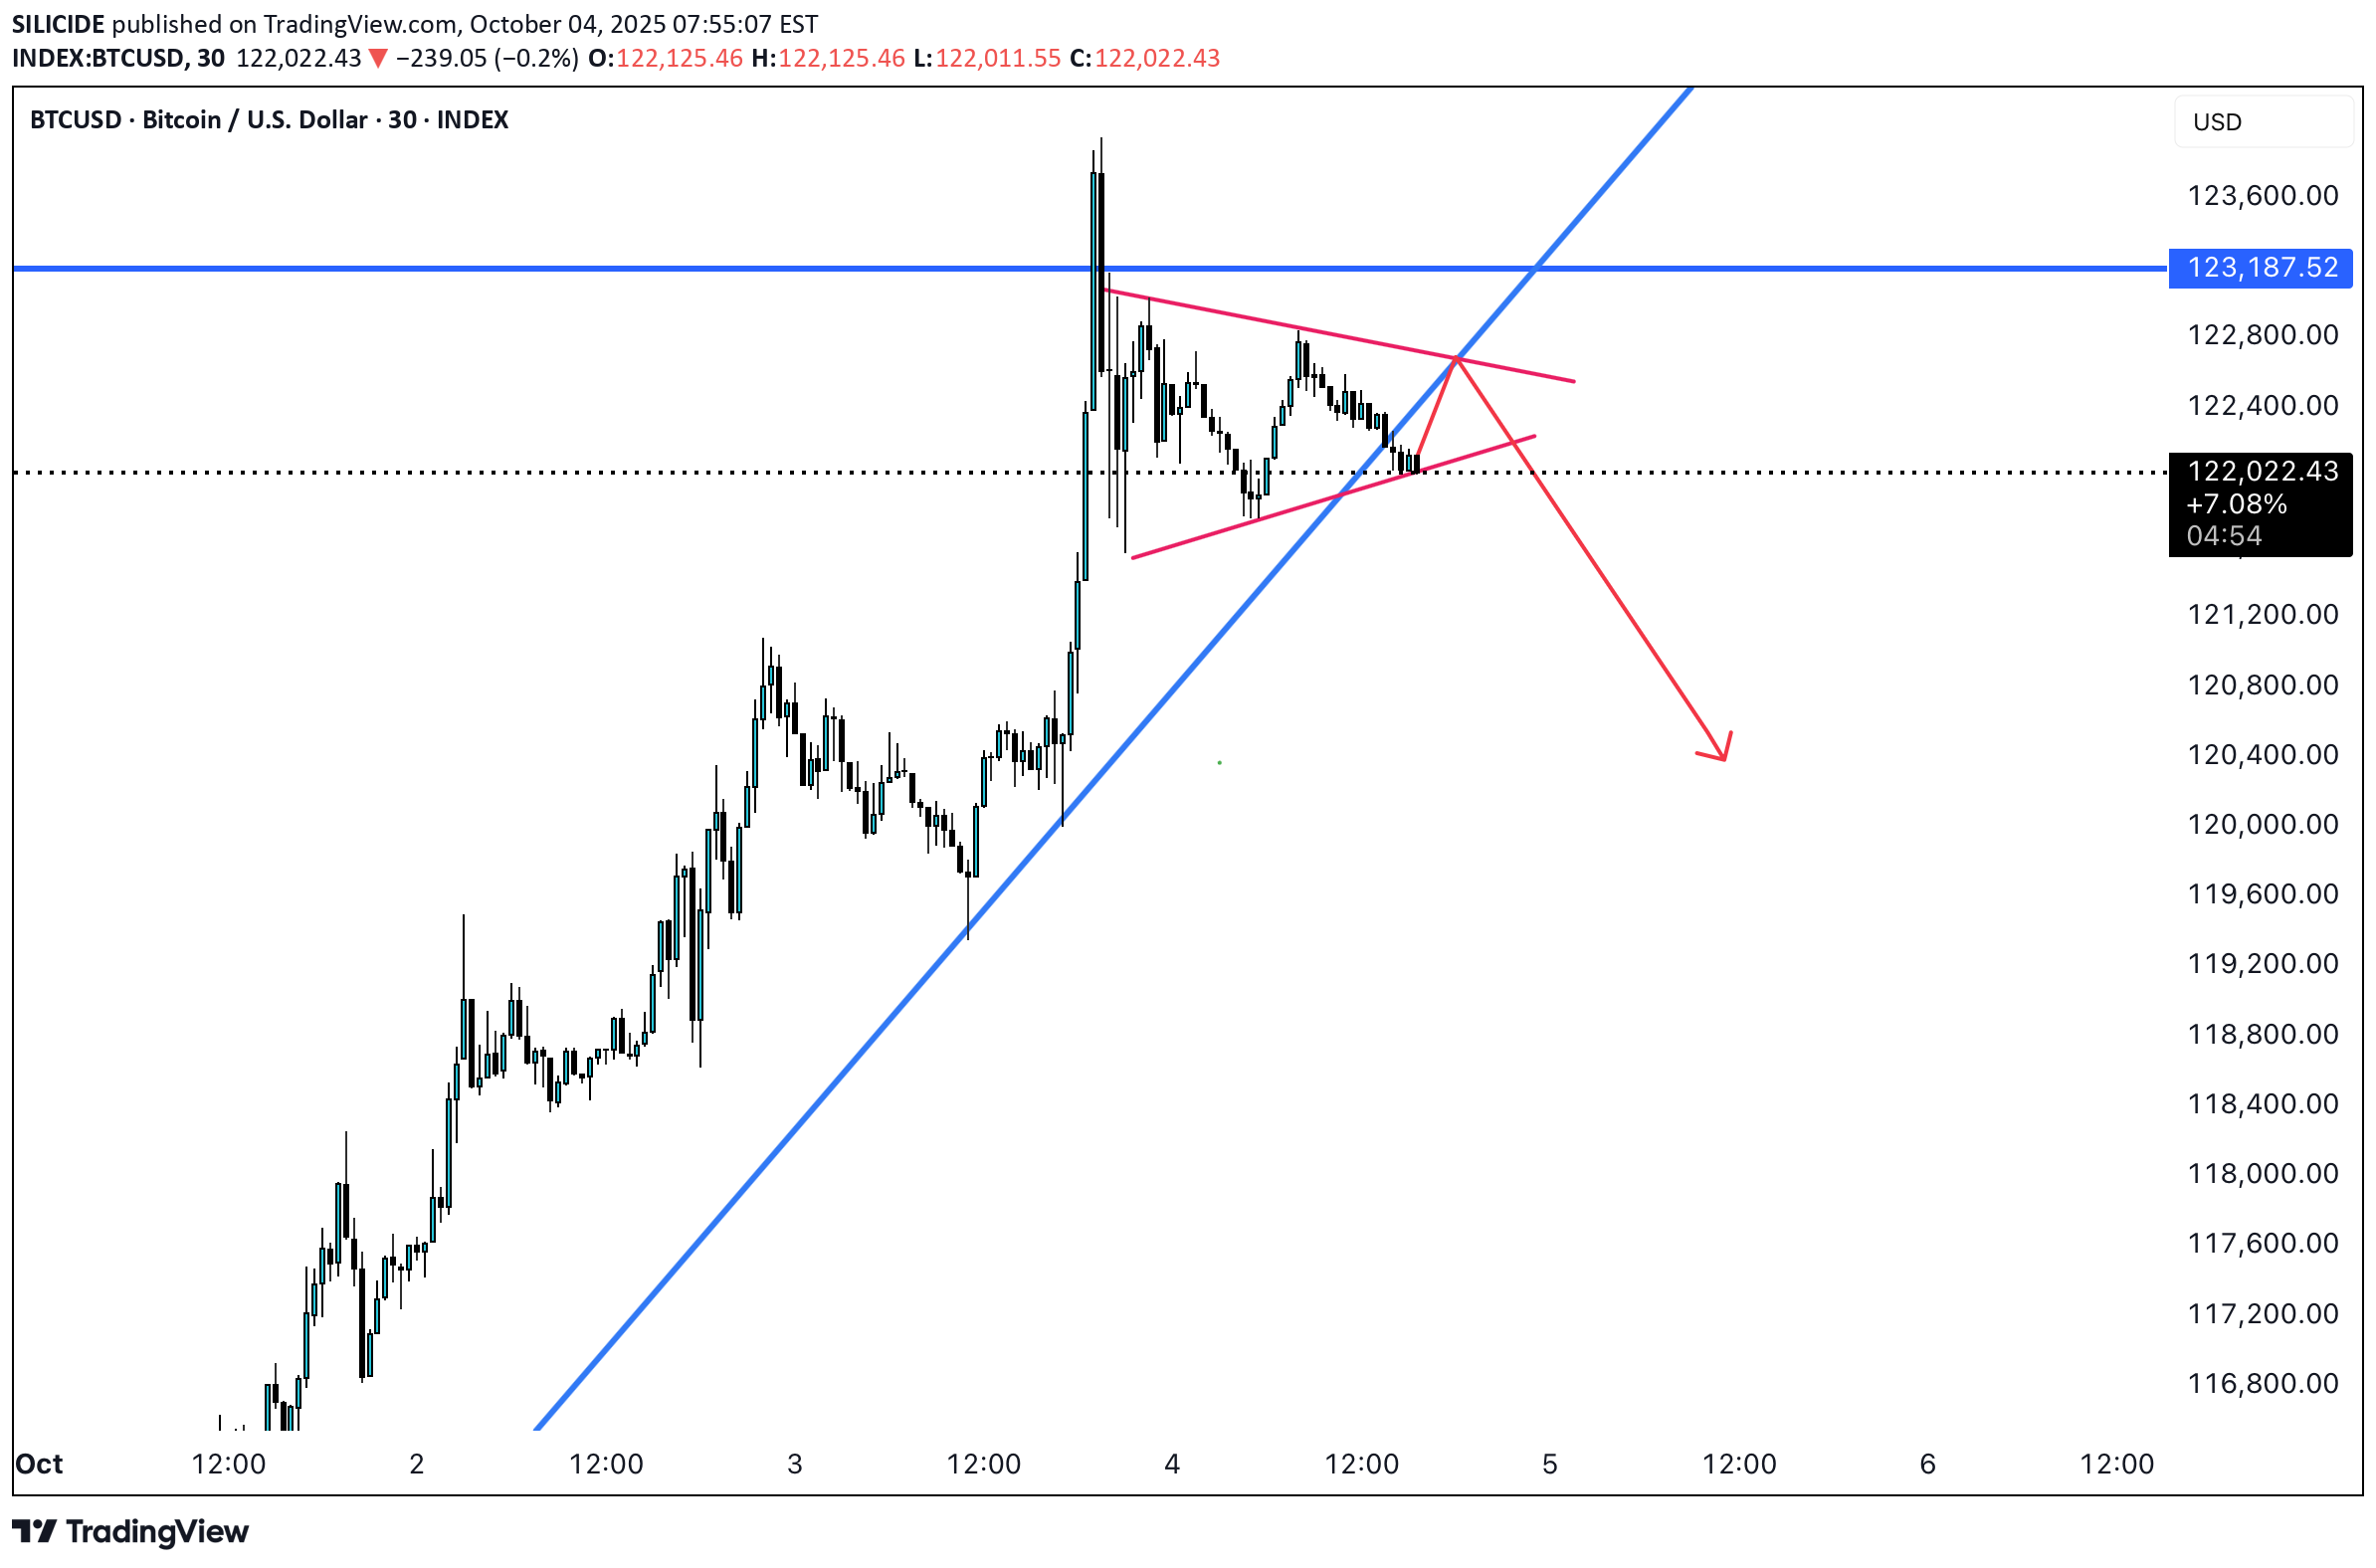
فریبکاری بیت کوین در تایم روزانه: زنگ خطر ریزش پس از شکست مقاومت!
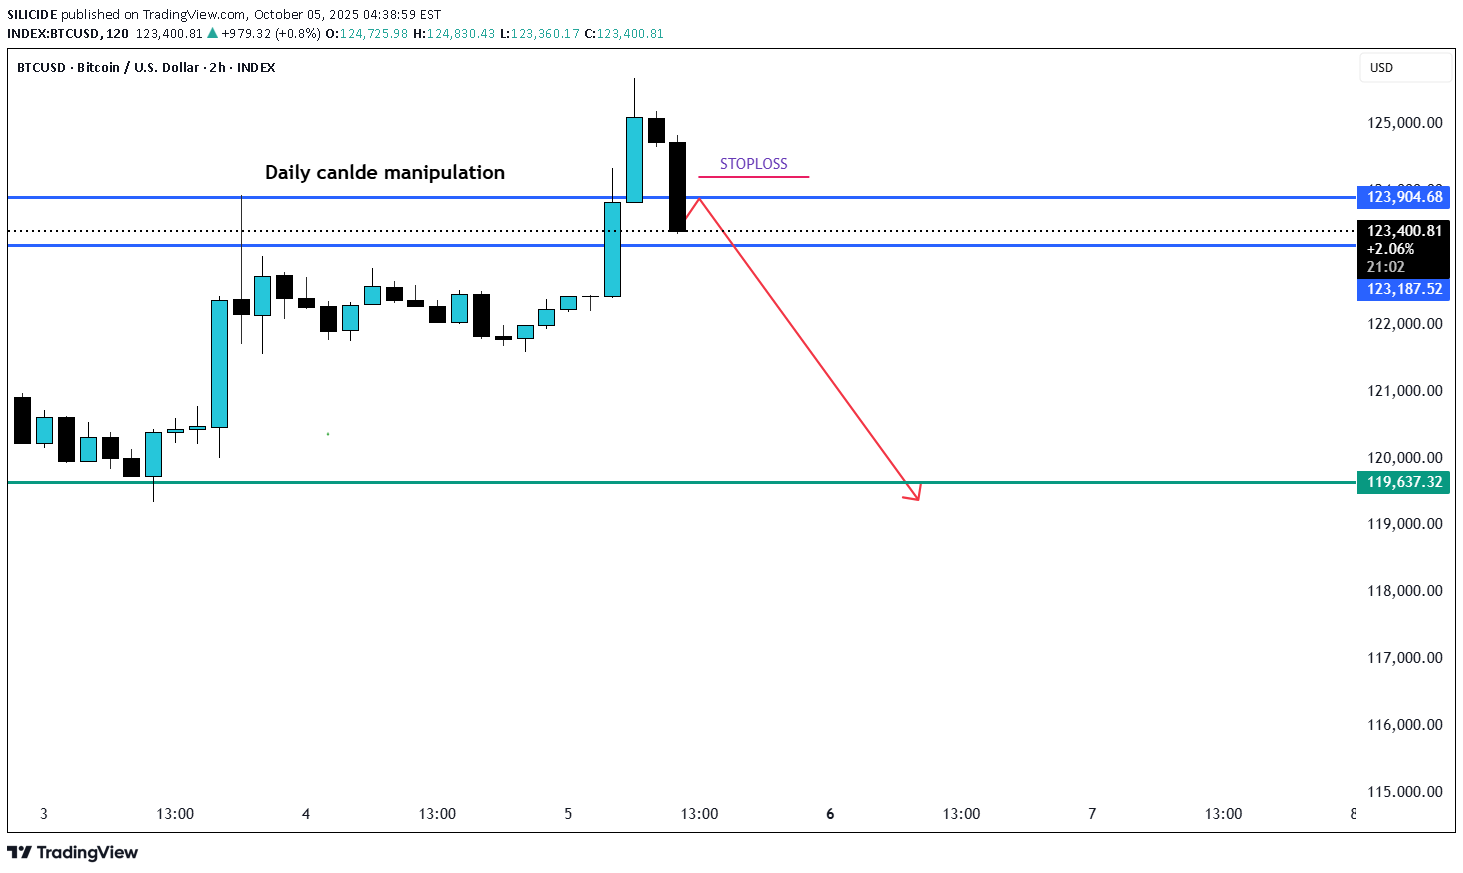
BTCUSD showed the Daily candle manipulation and closing the price below the shoot up candle taht broke the resistance and price likely will go down.if price comes to 123700 short againThis is a common tactic used by large market players. They drive the price upward to create the illusion of a breakout, prompting retail traders to enter long positions. At the same time, sellers place their stop-losses just above that level. Once those stops are triggered, the price reverses, trapping both buyers and sellers — a classic stop-hunt move.Target 121700 and second 120000
SILICIDE
Disclaimer
Any content and materials included in Sahmeto's website and official communication channels are a compilation of personal opinions and analyses and are not binding. They do not constitute any recommendation for buying, selling, entering or exiting the stock market and cryptocurrency market. Also, all news and analyses included in the website and channels are merely republished information from official and unofficial domestic and foreign sources, and it is obvious that users of the said content are responsible for following up and ensuring the authenticity and accuracy of the materials. Therefore, while disclaiming responsibility, it is declared that the responsibility for any decision-making, action, and potential profit and loss in the capital market and cryptocurrency market lies with the trader.