
candle_crafts
@t_candle_crafts

What symbols does the trader recommend buying?
Purchase History
پیام های تریدر
Filter
candle_crafts
تحلیل نقشه مناطق نقدینگی بیت کوین پس از لندن: سطوح حیاتی حمایت و مقاومت BTC/USDT
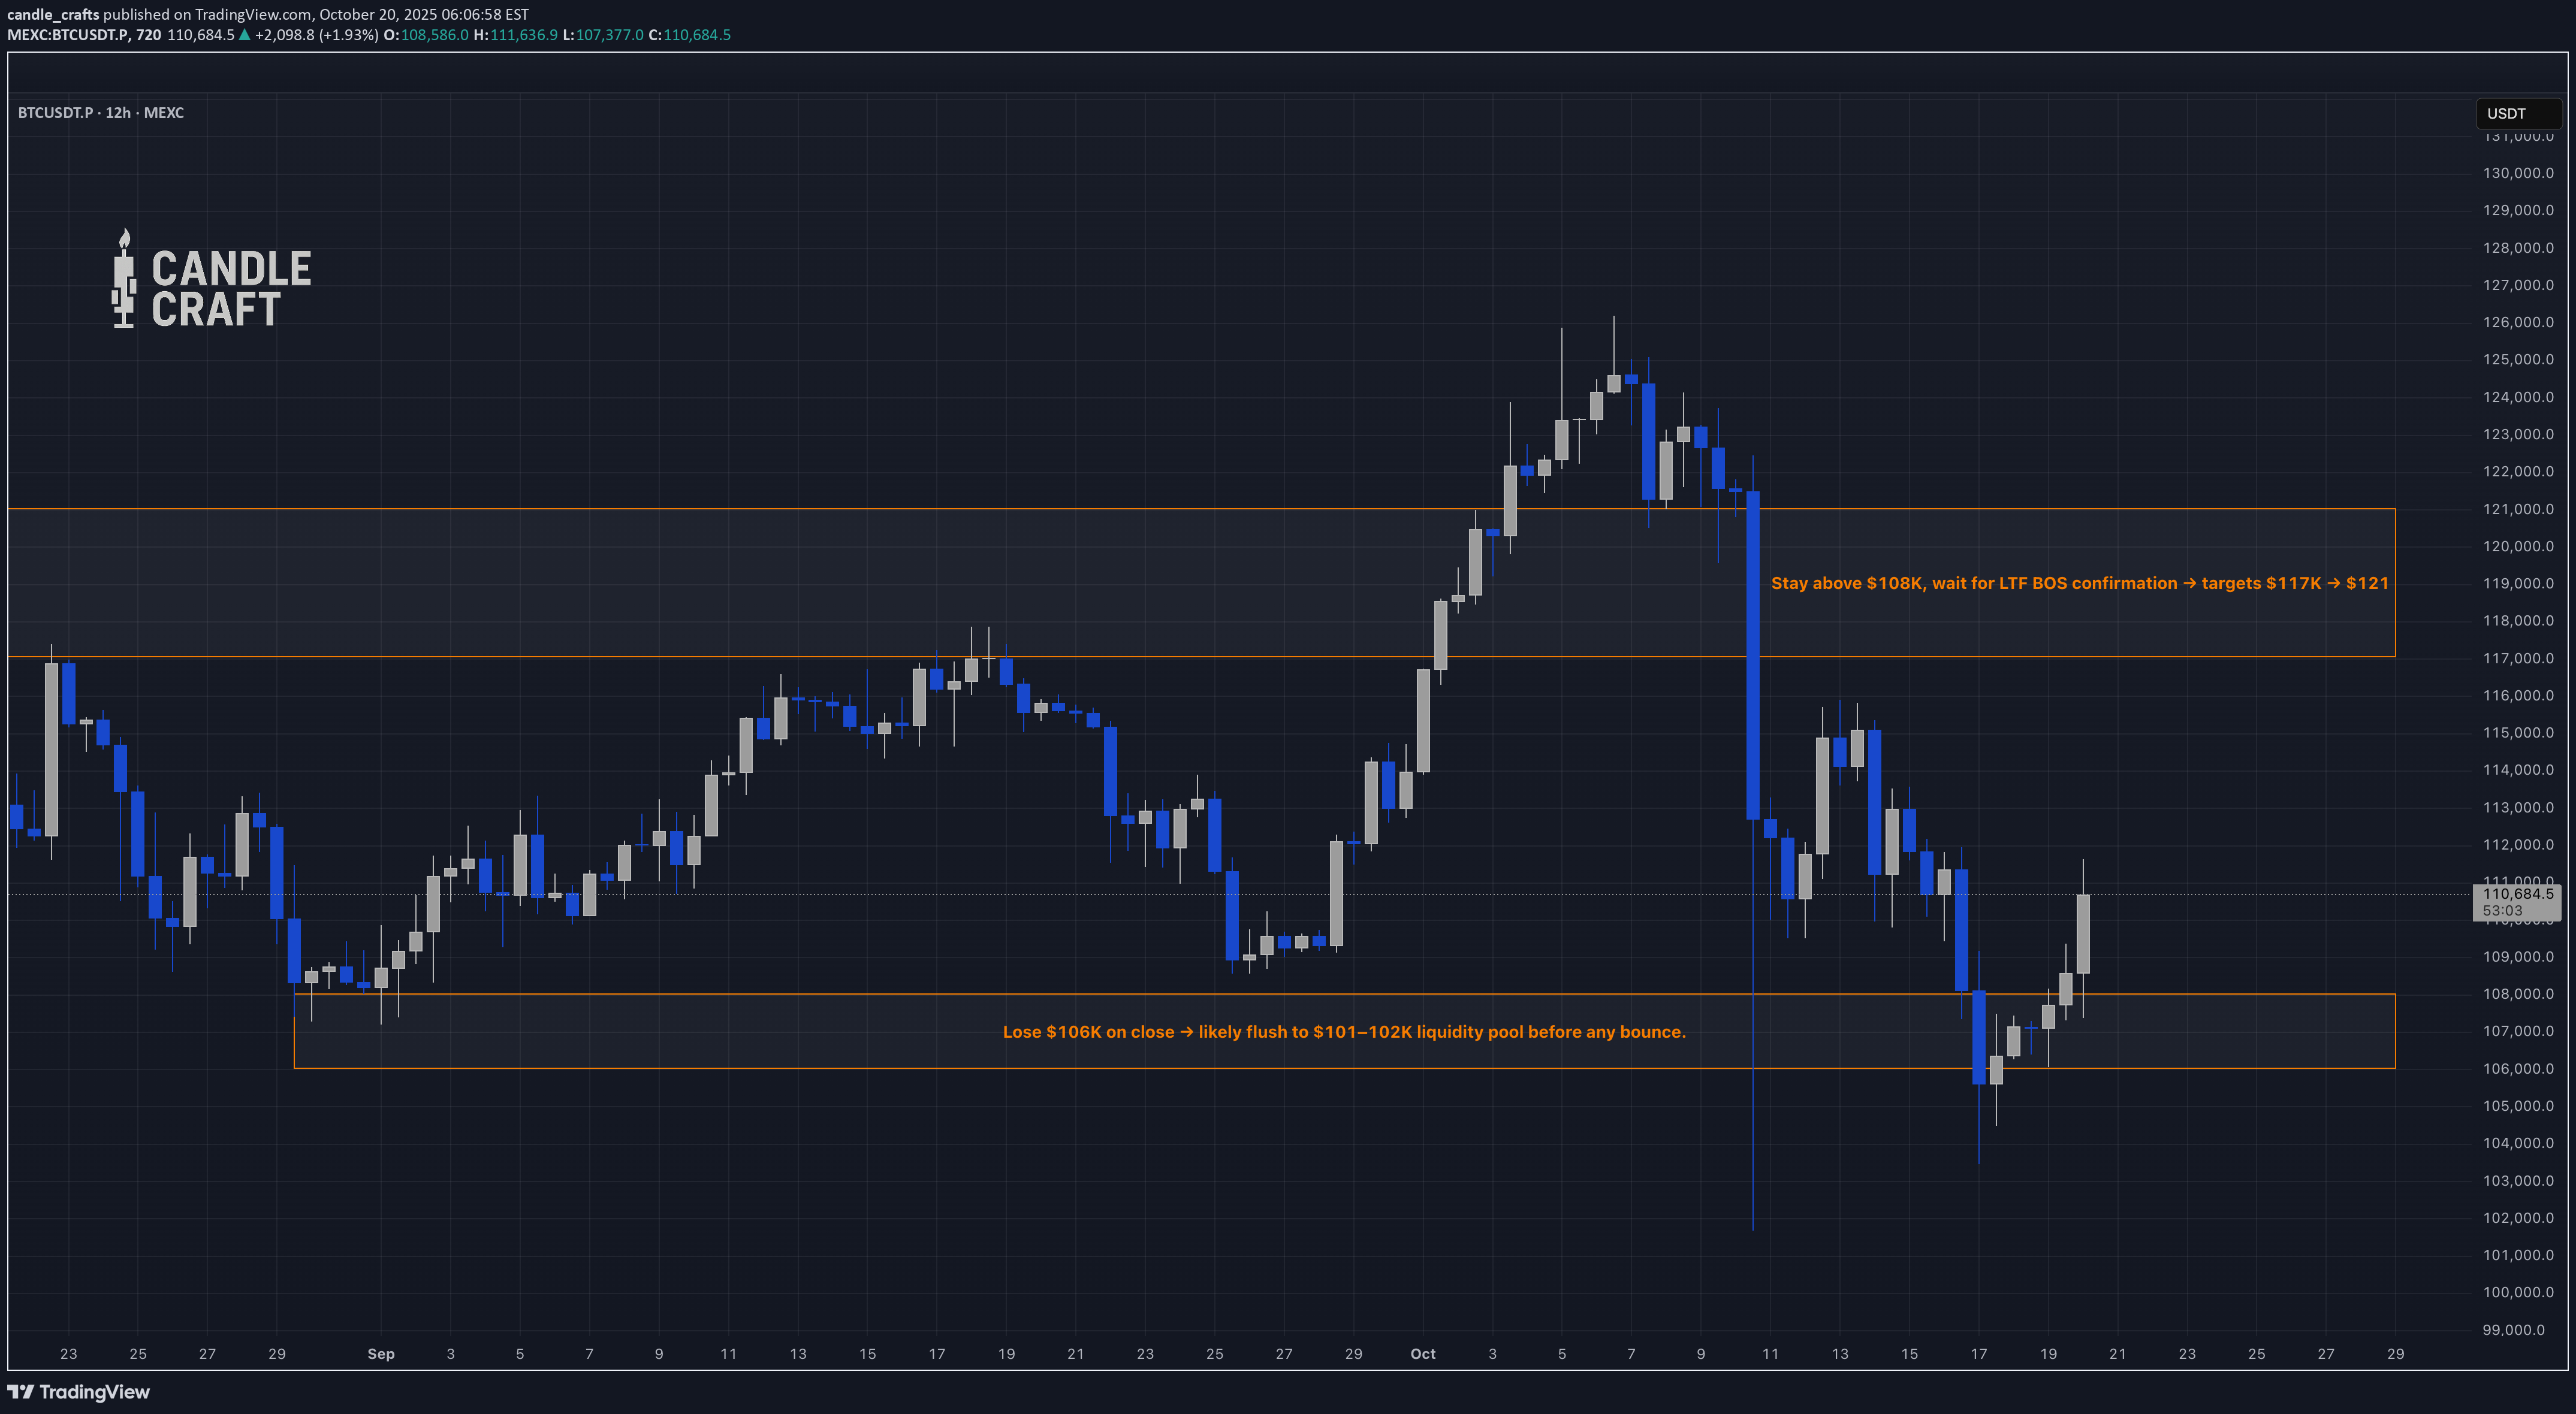
🧭 BTCUSDT — Sweep Zones Map (Post-London Update) The wolves woke up early today. After the weekend drift, Bitcoin is back defending its mid-range, and the tape’s showing more intention than hesitation. Let’s dissect the layers 👇 1️⃣ Market Structure (W → 2D → 12H) • Weekly: Structure remains bullish — last HH ≈ $123K, HL ≈ $94K. No violation yet. • 2D: Clean rejection from mid-supply ($127K → $107K), now retesting $108–110K as mid-range support. • 12H: Liquidity sweep under $107K, reclaim candle closed above $110K → short-term BOS confirmed. 2️⃣ Sweep Zones 💚 Support Zone: $106K → $108K — prior liquidity pocket aligning with POC. If bulls defend, targets extend to $115–118K. ❤️ Resistance Zone: $117K → $121K — unmitigated supply and heavy short clusters (Binance + Bybit). A clean break opens $125K+ territory. 3️⃣ Orderflow Snapshot ⚙️ Derivatives Snapshot (visual interpretation — incomplete data from Velo) • Funding back to neutral after deep negative skew (-0.02 → 0.01 %). • OI recovering ≈ +2.5 B since Sunday’s close. • CVD still negative but curling upward — spot demand quietly absorbing. • Liquidity pools resting below $106K and above $117K → potential sweep zones ahead. 4️⃣ Footprint Context (12H / 3D) • Strong sell-side absorption at $108K POC; delta flipped positive the next candle (3× imbalance). • 3D footprint still shows prior absorption active → buyers defended the same zone twice. • Volume compression = volatility coil → expect breakout behavior within 12–24 hours. 5️⃣ Execution Scenarios 🟩 Bull Path: Hold > $108K → LTF BOS confirmation → targets $117K → $121K. 🟥 Bear Path: Lose $106K close → flush toward $101–102K liquidity pocket before reversal attempts. 📊 Bias: Neutral-to-Bullish (short-term reclaim confirmed) 🎯 Focus: Reaction between $108K–$110K. Pullback entries only after 12H displacement retest. 🔥 BTC holding mid-range while spot absorption rises and funding normalizes = constructive base forming into Q4. ⚔️ Candle Craft | Signal. Structure. Execution.
candle_crafts
ZEC: سکوت قبل از طوفان؟ چرا این آلت کوین بر خلاف همه، زنده ماند!
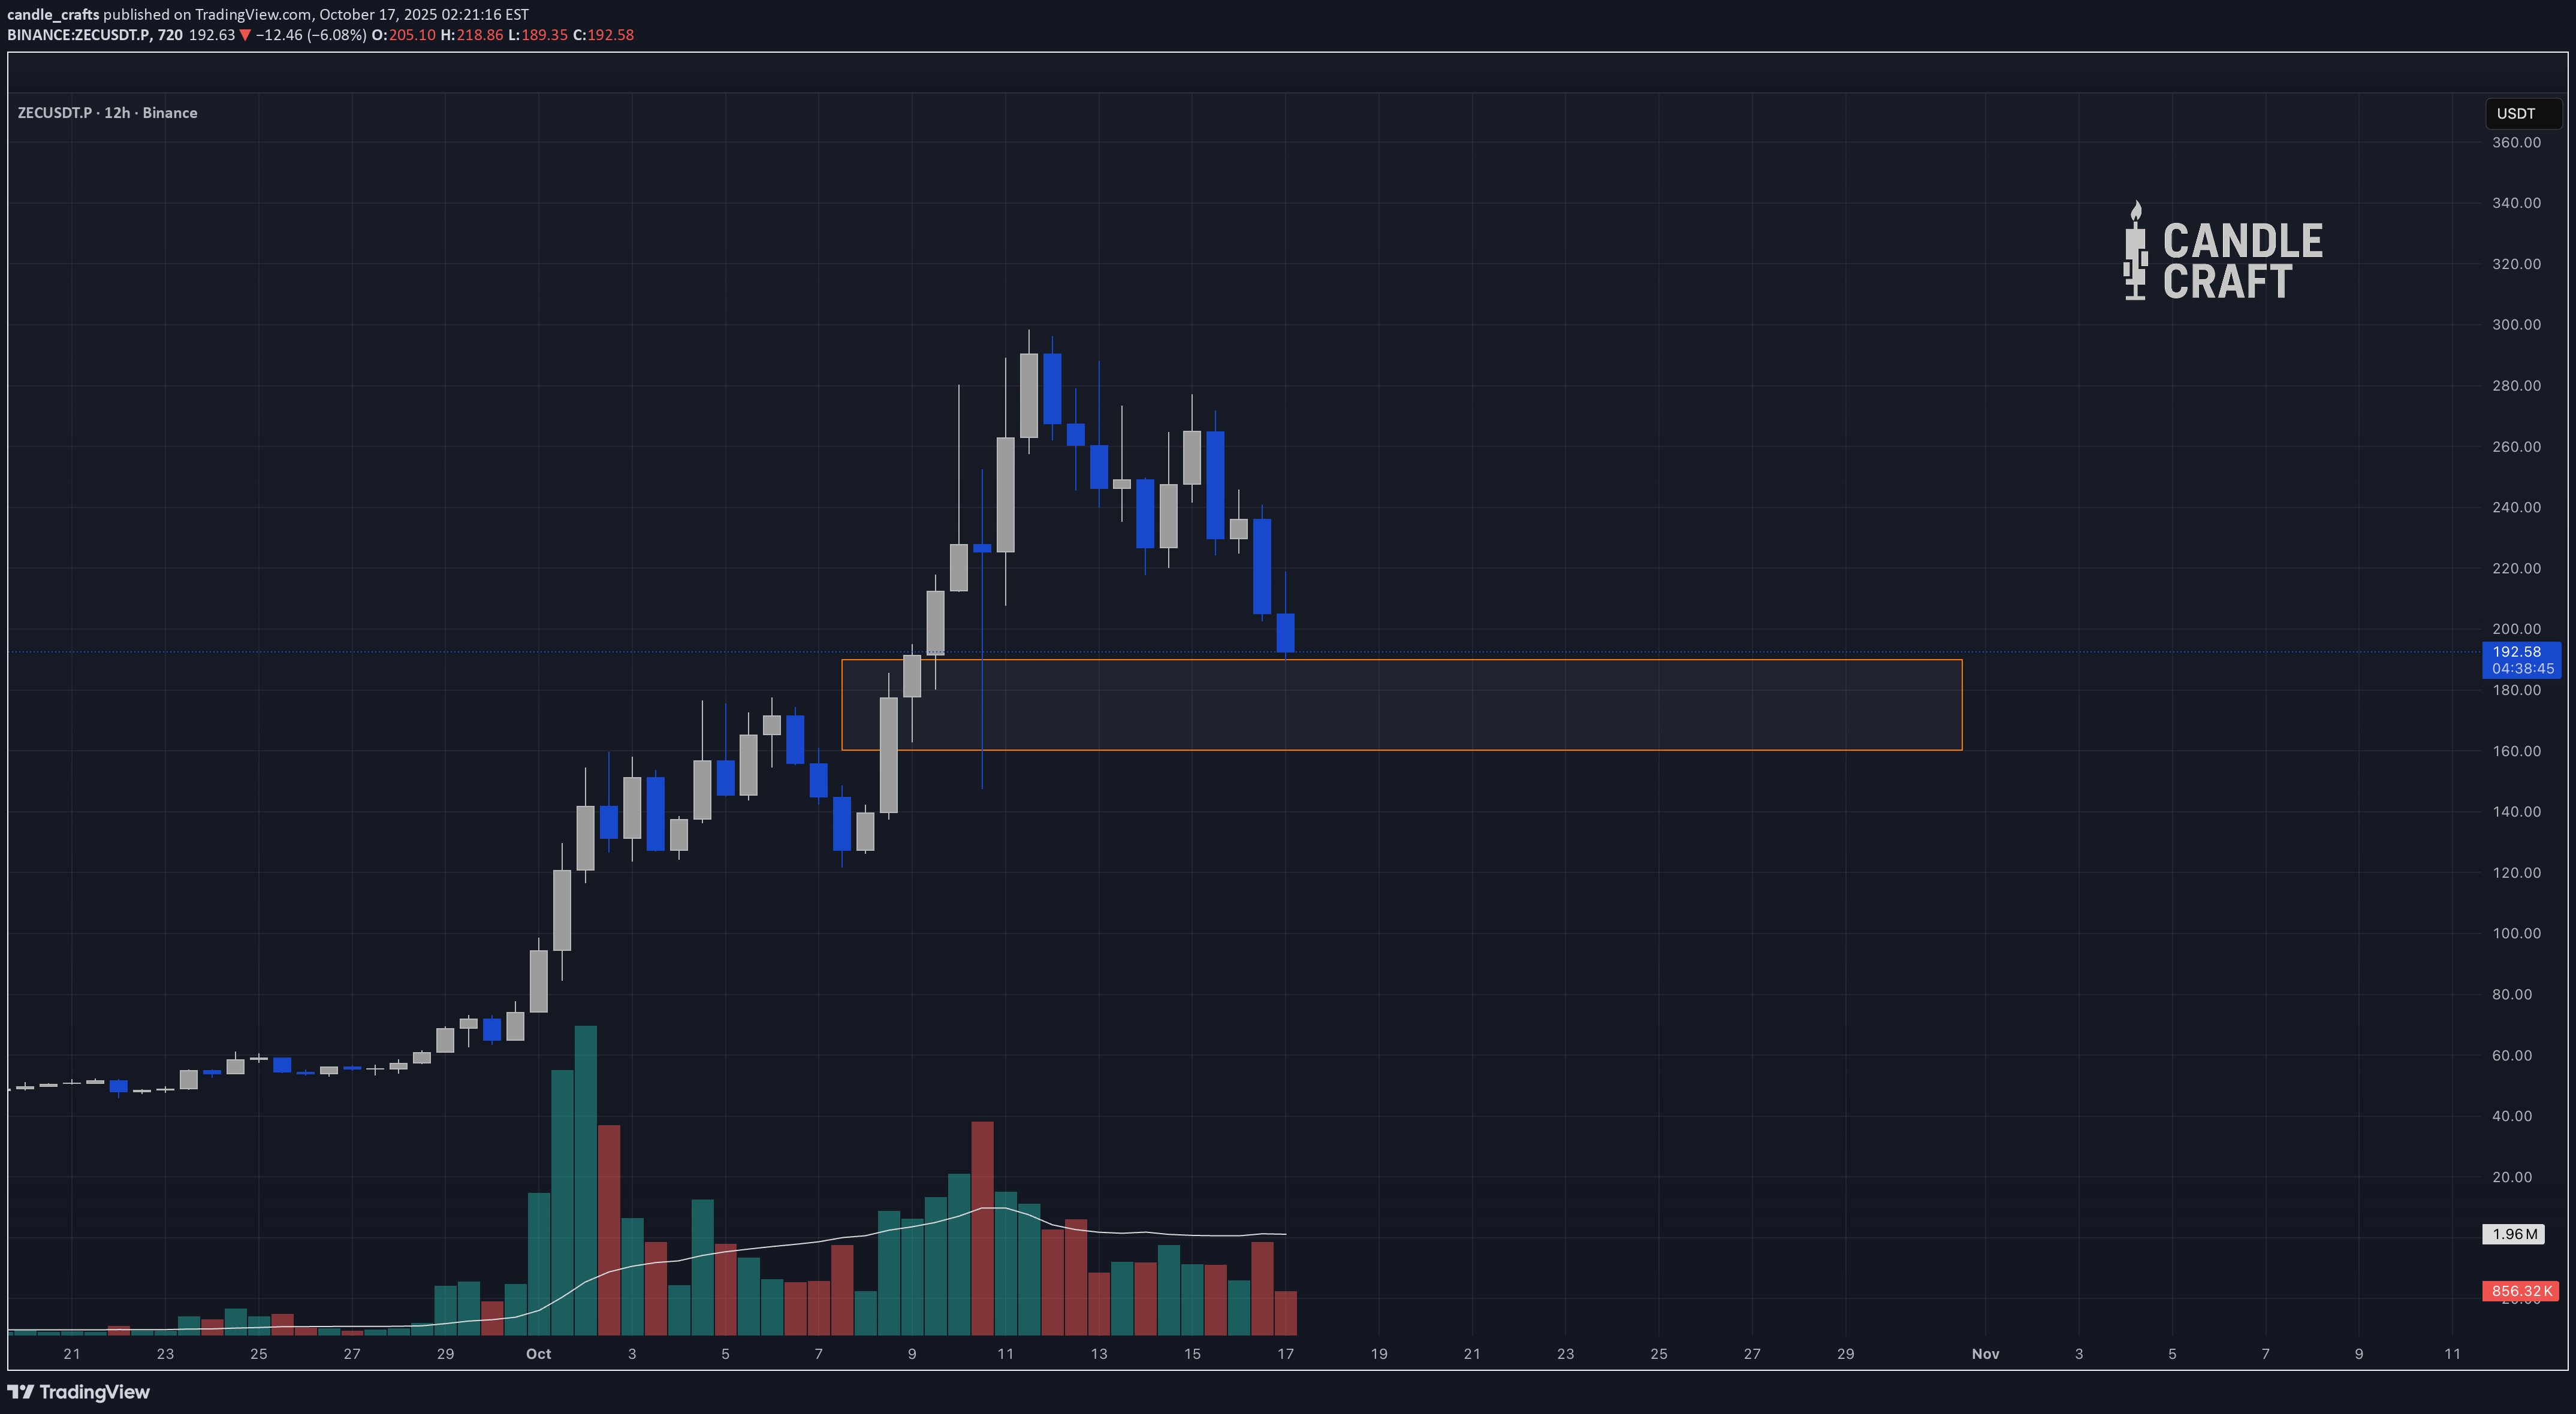
While other altcoins got obliterated back to dust, ZEC quietly refused to die. Look closer. That massive pump wasn’t random hype — it built on a deep multi-year base, then finally broke through all historical supply like butter. Now we’re simply retesting that breakout zone, not collapsing. What looks scary on the 12H chart is, on the macro view, just a controlled pullback into a region that’s both structurally sound and psychologically loaded — the orange box between ≈170–190 USDT. This is the same area where breakout traders took profits and patient hands are now waiting to reload. This isn’t a dead project gasping for air; it’s one of the few survivors from multiple bear cycles that still holds its macro structure. While other charts scream exhaustion, this one whispers continuation — if the market holds. 🧩 Our logic: → The 2-day and weekly candles both confirm the first proper retest of a long-term breakout. → If Bitcoin doesn’t nuke the entire field, ZEC has a clean path to re-establish strength from this base. → Ideal strategy: Spot accumulation or ≤5× leverage entries inside the orange box. Patience is the edge here. ZEC doesn’t need hype — it just needs time. And when this thing wakes up again, most traders won’t even realize it’s already halfway gone. Candle Craft | Signal. Structure. Execution.
candle_crafts
سقوط ONDO یک دام است؟ گرگها چطور در سکوت انباشت میکنند!
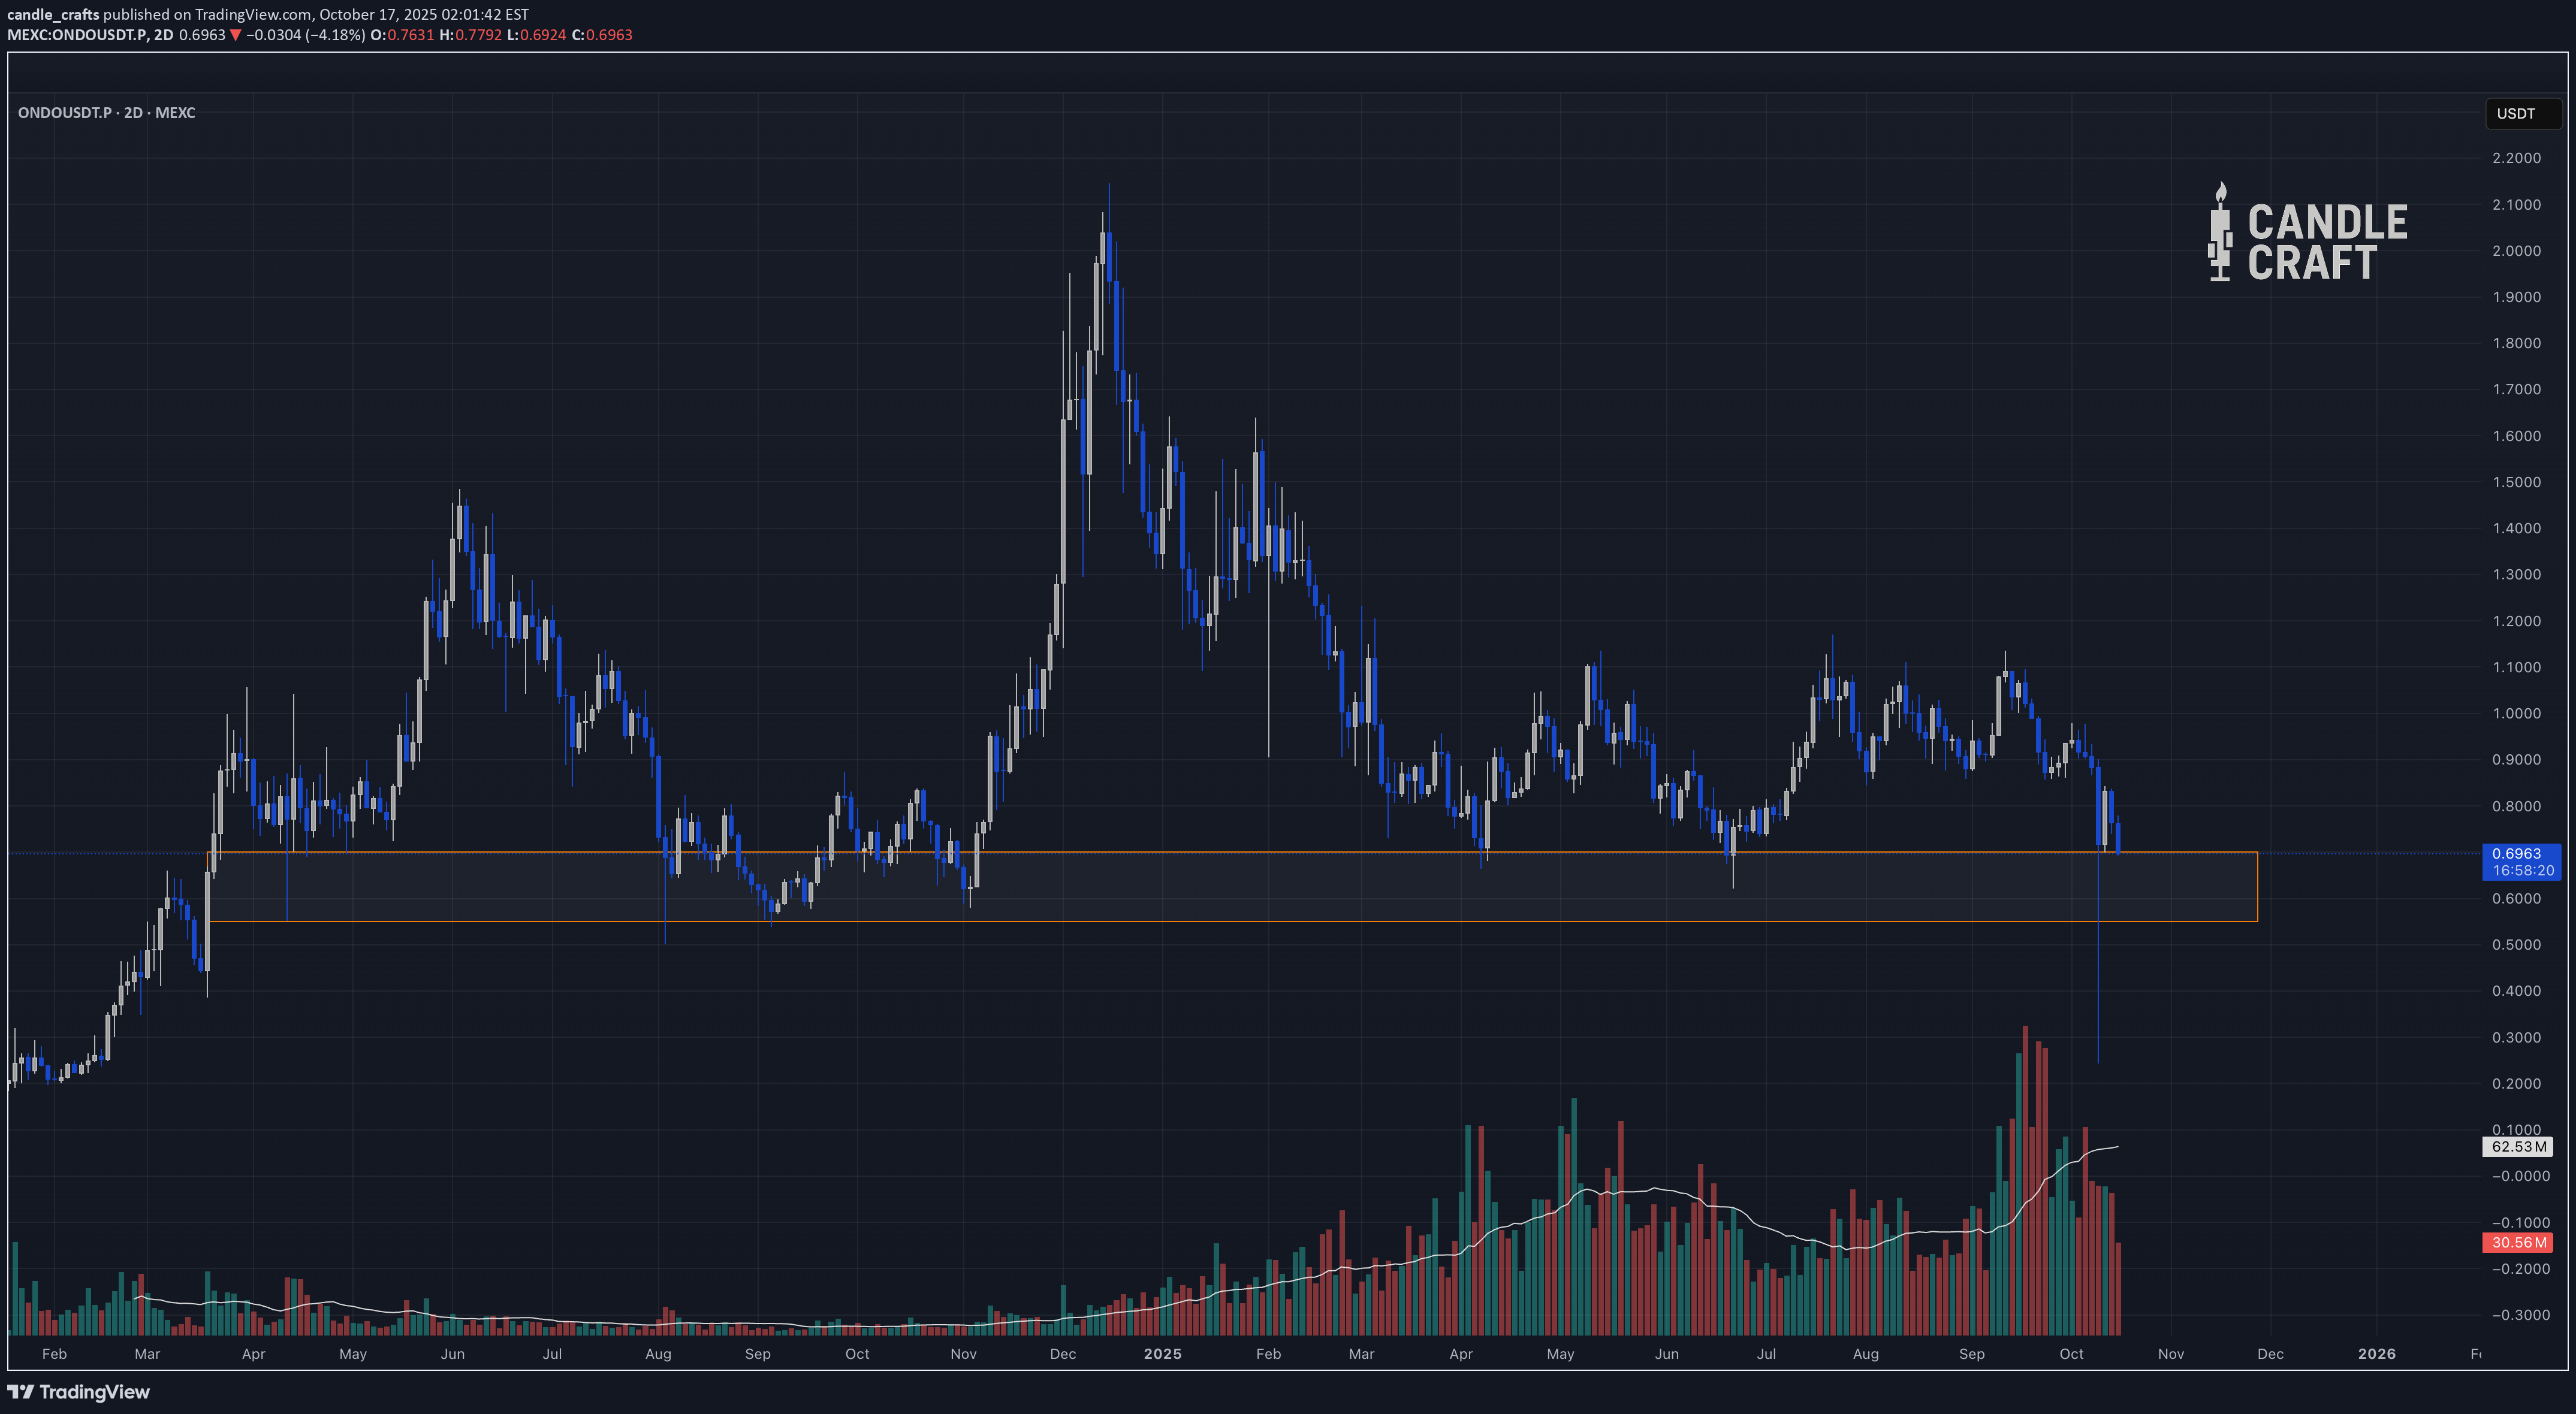
The crowd calls it “dumping.” We call it redistribution before ignition. ONDO has just plunged into the orange accumulation box — a zone that’s seen every capitulation, every fakeout, every final shake before trend reversals. The kind of place where retail gets scared… and the wolves quietly fill their bags. Volume is surging while price is drilling into historical support. That’s not weakness — that’s transfer of ownership. If ONDO dips lower, good. It’s liquidity, not loss. This zone — and even slightly below it — is where smart money enters, not exits. Our plan is simple: 🎯 Accumulate between 0.555–0.70 USDT. 🕐 Hold through December–January. The rotation cycle is setting up — and those who hold through the boredom will catch the reward phase. Every market writes the same story: capitulation → silence → disbelief → expansion. We’re now in the silence part. Time to listen closely. Candle Craft | Signal. Structure. Execution.
candle_crafts
تحلیل ساختار STRK: آیا فرصت صعودی زود هنگام است یا سقوط؟

📊 STRK Market Structure — Early-Cycle Reclaim 1W • First potential reversal base after a 10-month decline. • Exhaustion under $0.12–0.14; first HH attempt forming. • $0.12 → $0.18 range expansion = first meaningful accumulation signal since early 2024. 2D • Breakout > $0.16 = minor bullish CHoCH with volume confirmation. • Close > $0.18 sets clean expansion toward $0.23–0.25 supply. • Rejection here → likely revisit of $0.15 liquidity pocket before the next try. 12H • Short-term structure printing higher lows. • POC ≈ $0.163 acts as near-term magnet. • Flush into $0.158–0.162 with delta absorption = ideal reload. • Strong 12H close > $0.182 → continuation impulse to $0.20–0.22 range highs. 📈 Orderflow / Derivatives • Open Interest: ≈ $90M, +35% w/w — leverage building, still moderate • Funding: 0%–0.01% — neutral (no crowding) • CVD: flipped positive — spot buying returning • Liquidations: stacked below $0.155 and above $0.185 — watch for hunts both ways • Venue mix: Bybit leading OI share → retail rotation creeping in ⸻ ⚔️ Sweep Zones / Execution Boxes 🔶 Resistance Sweep Zone — $0.185 → $0.205 • 12H close > $0.205 with OI rising + CVD accelerating → breakout leg → $0.23–0.25. • Rejection + OI flush → short-term top → return to $0.163 POC. 🟩 Support Sweep Zone — $0.155 → $0.165 • Strong absorption + OI reset → accumulation zone for trend continuation. • Break < $0.155 = failed reversal → $0.125 range floor retest. ⚫ Deep Liquidity Zone — $0.115 → $0.130 • Last demand shelf / weekly re-accumulation. • Break below = macro bearish continuation. ⸻ 🧭 Interpretation STRK sits in early-cycle recovery within the L2 rotation. STRK/BTC ≈ 0.000015 shows the first relative-strength reclaim since Q1 2024 — a clear rotation tell if it holds. Bias = accumulation → markup transition. Hold > $0.16 and watch for $0.205 confirmation to ignite the next leg into Q4.
candle_crafts
نقطه طلایی ورود مجدد به ZEC: آیا قیمت به ۱۸۵ دلار بازمیگردد یا ۲۸۵ دلار را میشکند؟

ZEC is in vertical expansion after a multi-year base break. We map decision zones and let price confirm. 1W • +350% in three weeks; clean break of the 2022–2024 base (≈$30 → $80) and engulf of $120–130 supply. • In price discovery until next HTF resistance band $260–280. • Weekly volume highest since 2021 → true impulse confirmed. 2D • Two candles show exhaustion wicks, no structural break. • Momentum extreme; a mean reversion toward $180–190 is likely and ideal for re-entry if defended. 12H • Local parabolic channel intact. • $160–175 demand base (FVG + prior imbalance). • Reclaim > $240 resumes markup into $270 → $310 extension. 📈 Orderflow / Derivatives • POC: ≈ $190 • Open Interest: ≈ $210M (+90% week-over-week) → leverage inflow • Funding: +0.08–0.10% on Bybit → crowded longs • CVD: positive — spot absorption still present • Liquidations: clusters below $175 and above $260 → prime hunt zones ⸻ ⚔️ Sweep Zones / Execution Boxes 🔶 Resistance Sweep Zone — $260 → $285 • Break > $285 with OI rising → price discovery into $310–340. • Wick rejection + funding cool-off → short-term top → pullback to $190 POC. 🟩 Support Sweep Zone — $165 → $185 • Flush into band with OI reset & CVD turn positive = re-entry zone. • Break < $165 = parabola ends → $125–140 mid-range rebuild. ⚫ Deep Liquidity Zone — $120 → $140 • Historical weekly supply flip. • Defend → macro bullish continuation; lose → revert to range cycle. ⸻ 🧭 Interpretation ZEC sits in speculative escape velocity (privacy narrative + supply squeeze). Risk is elevated with funding and OI stretched. Prefer pullbacks into $190 → $175 with OI flush for continuation plays. As long as 12H closes > $160, macro bias stays bullish.📉 ZEC — Don’t Chase Green This is exactly what we mean when we say training isn’t always about trading. Sometimes the chart is your teacher, not your playground. We didn’t jump. We analyzed. We waited. Because when you chase — you’re swimming against the current of the market makers. And those currents are built on human psychology — fear, greed, impatience. They’ve been studying you for years. We’ve been studying them. So we let ZEC show its cards. We wait for the reload, not the hype. Structure first. Execution later. Candle Craft | Signal. Structure. Execution.
candle_crafts
ساختار بازار بیت کوین: تحلیل چند زمانیه و سطوح کلیدی حمله و دفاع

BTC is pausing mid-trend after a clean reclaim of ≈118 k. Structure remains impulsive (HH–HL). We map the path, mark the sweep zones, and let price confirm. 1W • Near 121.4 k after reclaim of ≈118 k (old supply → support). • Weekly close > 122 k opens 128–130 k liquidity shelf. • Lose 118 k → 112–113 k retest window. 2D • Displacement ≈114 k → 124 k, now mid-range consolidation. • Breakout base 117.8–118.5 k respected. • Acceptance > 123 k resumes markup; volume taper = cool-off, not distribution. 12H • Micro pullback after 125 k sweep. • 120–118 k OB = primary defense. • Close < 118 k → corrective leg toward 114–115 k. • POC ≈ 120.7 k (Binance perp) acts as a magnet. 📈 Orderflow / Derivatives (Binance + Bybit snapshot) • POC: ≈ 120.7 k (Binance Perp) • OI: ≈ $38 B, stable — no forced unwind • Funding: +0.01–0.02 % (neutral / slightly positive) • CVD: flat — spot buyers absorbing perp selling • Liquidations: cluster below 118 k (≈ $220 M) • 3-mo basis: 8 % → 7 % drift — cool-off, not risk-off ⸻ ⚔️ Sweep Zones / Execution Boxes 🔶 Resistance Sweep Zone — 123.8 k → 125.4 k Why: equal-highs on 12H + September wick cluster; last pockets of short liquidity. Inside-box note: • 12H close > 125.5 k with OI > $38 B and funding > 0.03 % → expansion to 128–130 k. • Rejection + OI drop → short-term top → reversion to 120 k POC. Execution bias: • Swept + rejected → look for LTF BOS under 124 k → short to 120 k. • Accepted → continuation leg to 128–130 k. 🟩 Support Sweep Zone — 118.2 k → 119.8 k Why: last breakout base + weekly demand flip + 12H OB body alignment. Inside-box note: • 12H close < 118 k with rising OI and funding neutral / negative → shorts push → 114–115 k rebuild. • Hold + delta absorption → reload → 123–125 k retest. Execution bias: • Delta absorption or reclaim of 120 k = safer long to 124–125 k. • Break < 118 k → bearish expansion → 114–115 k liquidity shelf. ⚫ Optional Deep Sweep Zone — 113.5 k → 115.2 k Why: prior liquidity shelf + weekly imbalance fill. Inside-box note: Final demand defense; failure here risks 111–112 k HTF retest. ⸻ 🔭 Summary Logic • 125 k sweep → possible top unless clean 12H close above. • 118 k sweep → reload if defended with absorption. • 114–115 k = last liquidity shelf before weekly structure cracks. Signals are posted only when triggers actually fire to keep execution reliable and precise.
candle_crafts
ساختار بازار اتریوم: نقشه راه چند تایمفریمی برای تریدهای دقیق (سطوح کلیدی ۴.۱ تا ۵.۳ هزار دلار)

ETH is coiling after a strong impulse; higher-highs and higher-lows remain intact. We map the paths, define the sweep zones, and let price confirm. When a condition is met, we decide based on live LTF confluence (15–60m PA, CVD, funding, OI) and post signals in real time for precision. 1W • Holds near 4.37k after an impulsive ≈2.9k → 4.8k leg. • Weekly structure bullish (clean HH–HL). • 4.1–4.2k = first structural defense before next markup. 2D • Compression between 4.15–4.75k. • Reclaim > 4.75k → continuation toward 5.0–5.2k liquidity pocket. • Close < 4.1k → deeper pullback to ≈3.8k mid-range. • Declining volume = equilibrium before the next impulse. 12H • Local sweep of 4.6–4.7k highs met rejection with soft OI unwind. • Short-term structure mildly corrective inside the larger bullish leg. • POC ≈ 4.37k acts as a magnet. 📈 Orderflow / Derivatives (Binance + Bybit) • POC: ≈ 4.35k • OI: ≈ $27B, flat — no cascade risk • Funding: +0.01–0.02% (neutral/slightly positive) • CVD: spot bids absorbing shorts • Liquidation clusters: < 4.25k and > 4.75k • 3-mo basis: 5.5% → 4.8% — healthy cool-off ⚔️ Sweep Zones / Execution Boxes 🔶 Resistance Sweep Zone — 4.72k → 4.85k • Liquidity from equal highs + weekly wick confluence. • 12H close > 4.85k with OI rising and funding > 0.03% = breakout leg to 5.1–5.3k. • Fast rejection + OI drop = short scalp reversion → 4.35k POC. 🟩 Support Sweep Zone — 4.10k → 4.25k • Last bullish OB + visible footprint POC. • 12H close < 4.1k with rising OI = fresh short momentum → 3.75–3.85k liquidity rebuild. • Hold + delta absorption = reload zone → 4.7k target. ⚫ Deep Liquidity Zone — 3.70k → 3.85k • Macro support shelf + monthly FVG fill. • Failure here = macro structure shift → risk toward ≈3.3k. 🧭 Two-Path Playbook Bullish IF: HTF acceptance > 4.75k (breakout confirmation if 12H > 4.85k with OI↑ & funding > 0.03%) → 5.1–5.3k. Bearish IF: 12H < 4.1k with OI↑ (fresh shorts) → 3.75–3.85k liquidity rebuild. Context note: ETHBTC ≈ 0.0358 stabilizing after a multi-month downtrend → green shoots for ETH-ecosystem rotation if BTC.D < 60% persists. We post signals only when triggers actually fire, using live lower-timeframe confirmation for reliability and precision.
candle_crafts
One of the Cleanest Alt Setups Right Now? IMX Says Yes

Immutable (IMX) has staged a strong rebound from its $0.60 accumulation base, now trading near $0.77. The move has been led by spot demand, not perps — a healthier driver compared with many alt pumps. HTF Structure: •Rebound from $0.60. •First supply rejection at $0.95. •Key continuation trigger = acceptance >$0.80–0.82. •Relative strength vs BTC (+12% over 5 days). Orderflow / Derivatives: •Spot volume dominates ($40m+ daily). •OI stable at ~$60m — not crowded. •Funding neutral. •Liquidation cluster around $0.80 cleared; next pockets sit >$0.90. Levels to watch: •Upside: $0.82 (trigger), $0.90 (sweep), $0.95 (supply cap). •Downside: $0.72 (pivot), $0.65 (base retest), $0.60 (invalidates bullish case). Scalp Playbook: 🟢 Long: $0.72–0.74 entry, SL $0.65, targets $0.82 → $0.90 → $0.95. (~3.5:1 RR, Trust B). 🔴 Short hedge: rejection >$0.90, SL $0.96, targets $0.82 → $0.74. (~3:1 RR, Trust C). Bottom line: IMX stands out in the current alt rotation: spot-driven, derivatives stable, BTC pair confirming strength. Bias = long pullbacks, hedge only above $0.90. ⚔️ Candle Craft | Signal. Structure. Execution.Easy trade. We opened after confirmation of sweep fam.
candle_crafts
SNX Market Report — Expansion or Exhaustion?
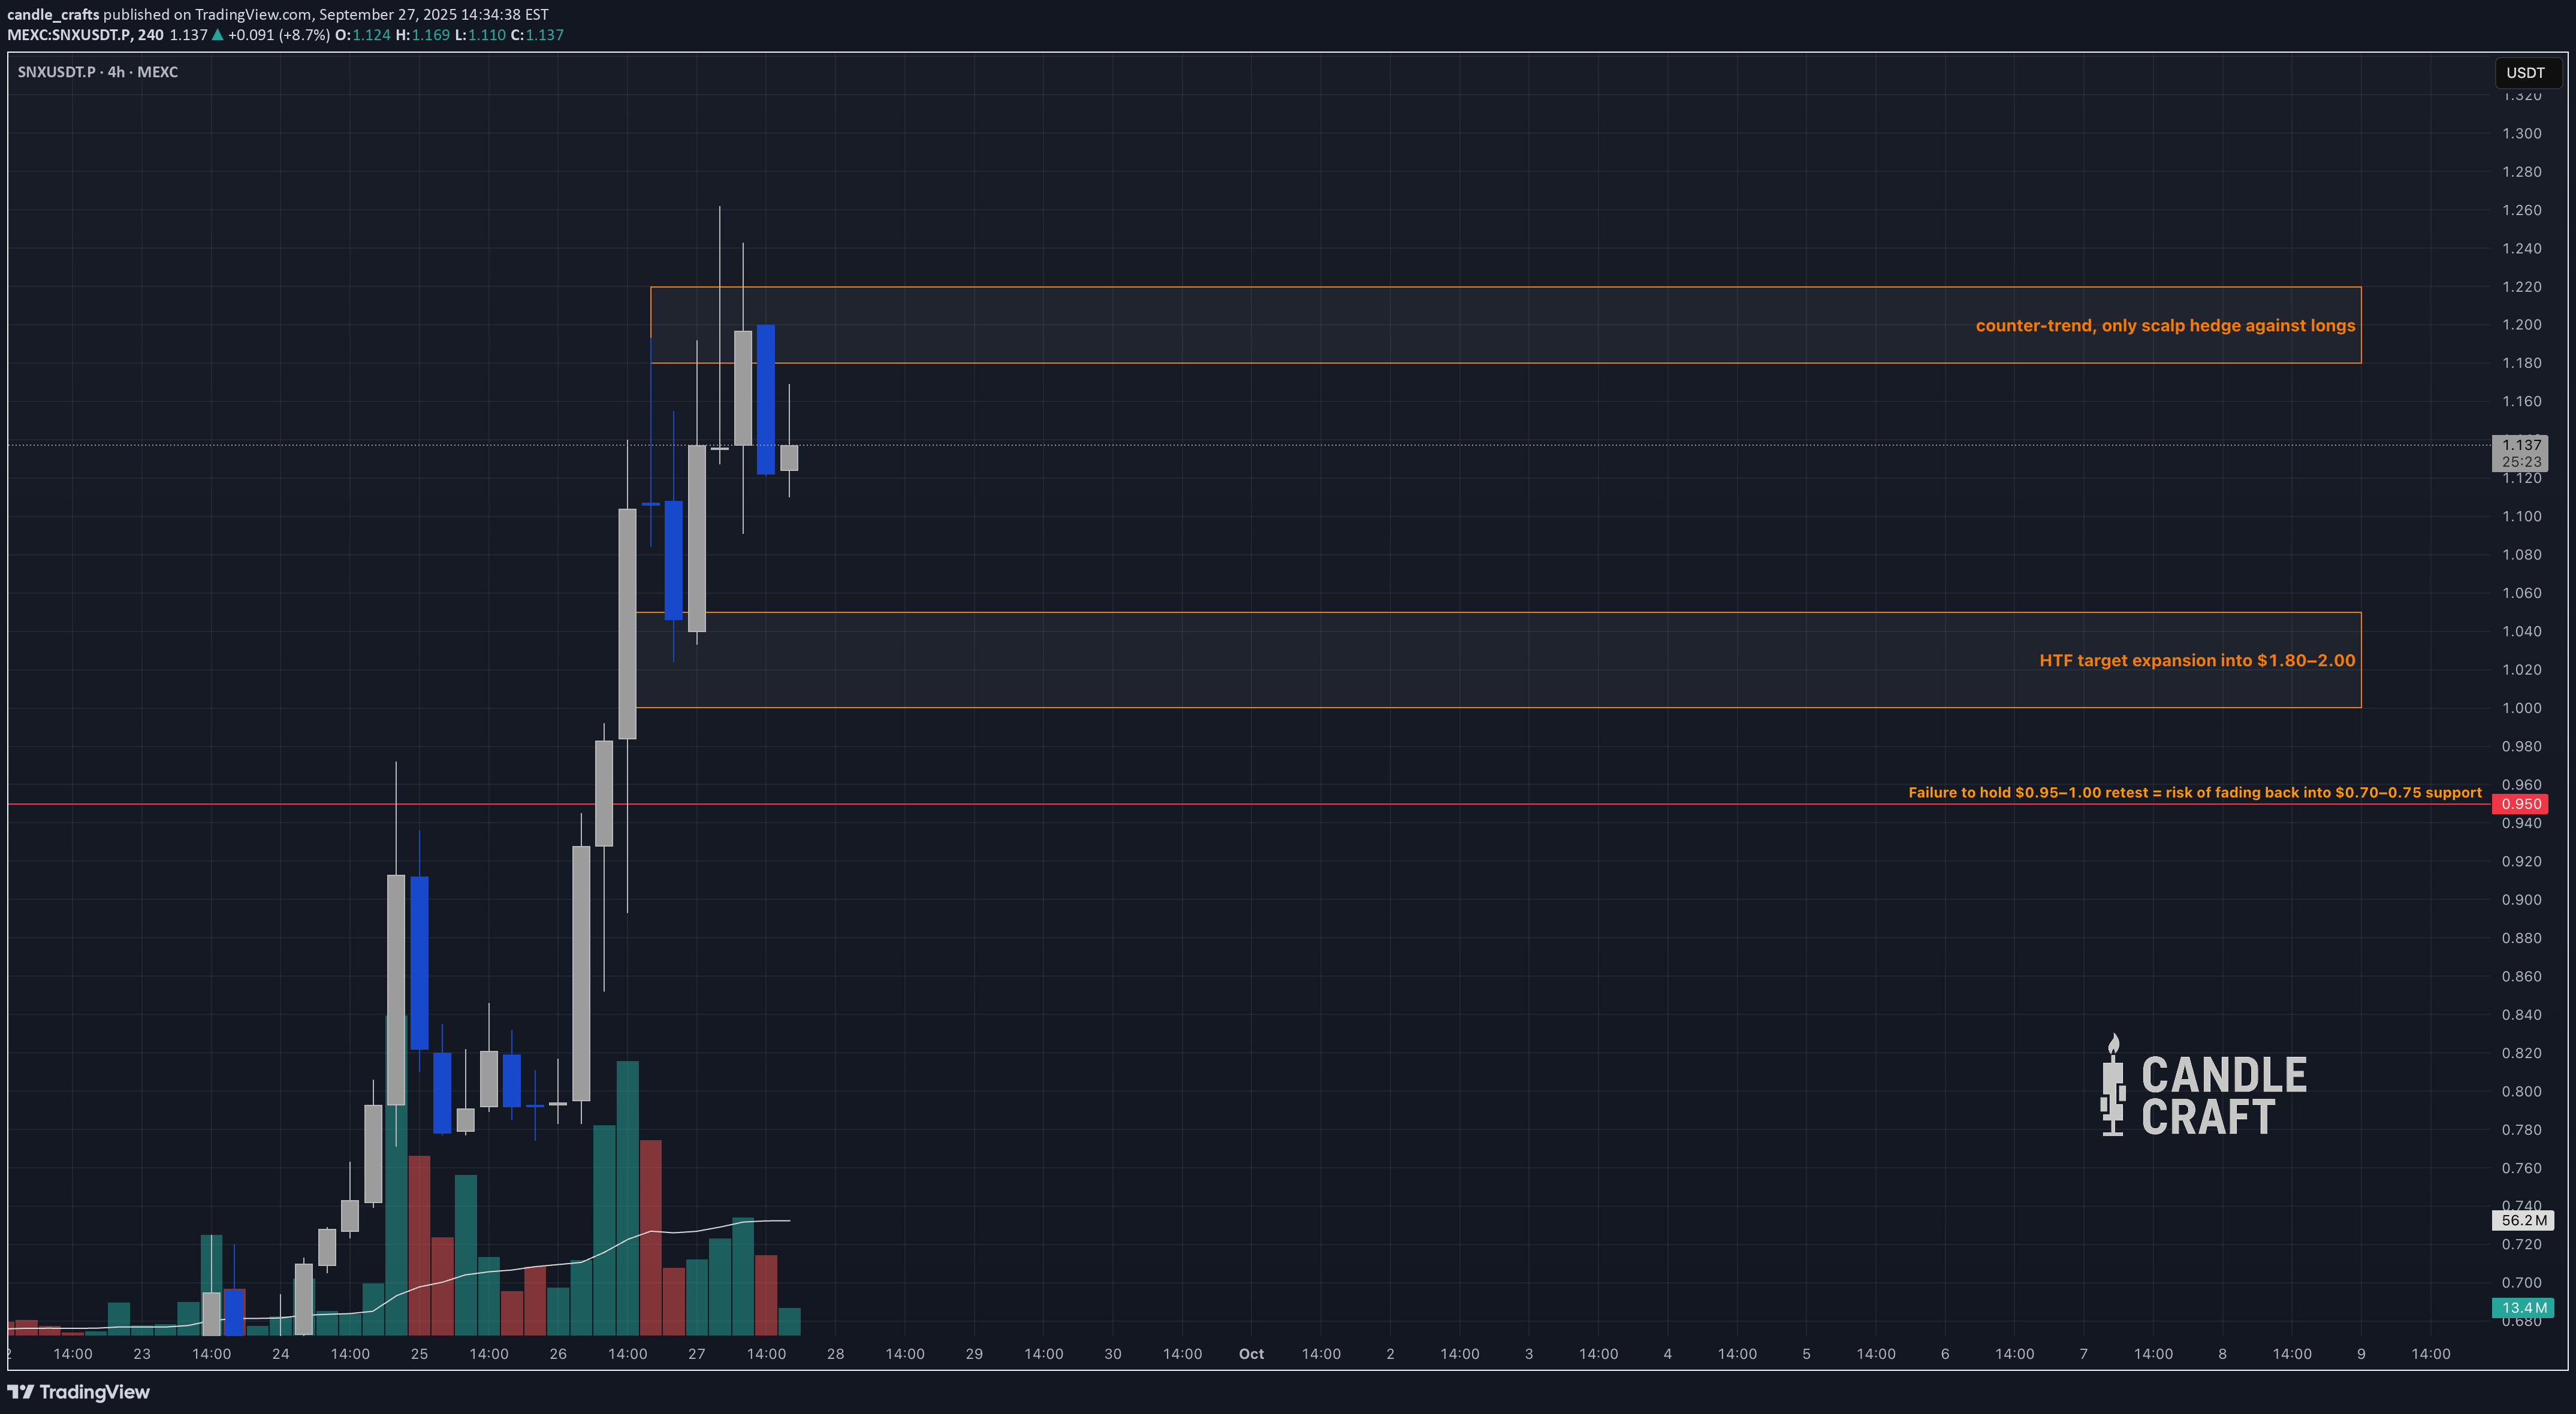
After months of compression, Synthetix (SNX) just delivered a breakout candle of unusual size. Price ripped from $0.60 lows to a $1.15 tag in a matter of sessions, shifting sentiment from dormancy to acceleration. The backdrop: •HTF resistance sits overhead at $1.20–1.35 — the last breakdown area. •A reclaim here on volume projects $1.80–2.00 as the expansion target. •Failure to sustain $0.95–1.00 retests risks dragging price back into $0.70–0.75. Momentum reads: •Open interest ballooned +30% in two days, but funding remains neutral. This isn’t yet the frothy late-stage push. •Spot CVD prints positive — confirming that the bid isn’t just leveraged fuel, but real inflow. •Short liquidations have been cleared into $1.15; fresh long liquidity now builds below $0.95. Market path: •Bullish: Pullback into $1.00–1.05 POC cluster holds → $1.20–1.35 retest, with room toward $1.80. •Bearish: Rejection at $1.20–1.22 sends price back to $1.05 or even the inefficiency gap at $0.90. Scalp Playbook: 🟢 Long setup: $1.00–1.05 entry, stop $0.88, targets $1.20 → $1.35 → $1.80. (~3.5:1 RR) 🔴 Short hedge: $1.18–1.22 entry, stop $1.30, targets $1.05 → $0.90. (~2.5:1 RR) Bottom line: SNX is no longer dormant — the expansion is real. Whether it becomes a sustainable cycle or burns out at $1.20 will depend on how the next retest resolves. ⚔️ Candle Craft | Signal. Structure. Execution.
candle_crafts
HBAR Market Report — Decision at the Edge

HBAR trades at $0.212, clinging to its demand shelf. The token has spent the week bleeding, yet still defends the 0.205–0.210 box. Above lies the critical supply wall at 0.245–0.250. Break it, and structural strength returns. Lose 0.205, and the market exposes liquidity voids at 0.195, then 0.175. On the relative side, HBARBTC continues to underperform, signaling no rotation flow from majors — USD buyers alone must carry any rebound. Orderflow reveals the pressure: •Continuous CVD decline → sellers dictating tempo. •Liquidity pools stack under 0.205 — a stop-hunt magnet. •Volume spiked into 0.212 on the last drop, hinting real bids exist, but deltas remain red. Derivatives paint a cautious picture: Open interest is flat, shorts rest comfortably with neutral funding, and cumulative delta across major exchanges trends lower. The path of least resistance remains down — unless liquidity games flip the script. What’s next? The market has written its own trap. A sweep below 0.205 followed by swift reclaim of 0.207–0.210 could ignite bids toward 0.225 and 0.235, with 0.245 as stretch. Fail to reclaim, or see rejection at 0.220–0.225, and shorts regain control — first into 0.205, then the 0.195 liquidity shelf. Scalp Playbook: 🟢 Long trigger: post-sweep reclaim 0.207–0.210 → 0.225/0.235. 🔴 Short trigger: rejection 0.220–0.225 → 0.205/0.195. Bottom line: HBAR is no longer drifting quietly — it stands at a decision point where the next 2–3 candles decide direction. Traders should expect volatility born not of trend, but of liquidity hunts. The trap will come first. The real move comes after. ⚔️ Candle Craft | Signal. Structure. Execution.
Disclaimer
Any content and materials included in Sahmeto's website and official communication channels are a compilation of personal opinions and analyses and are not binding. They do not constitute any recommendation for buying, selling, entering or exiting the stock market and cryptocurrency market. Also, all news and analyses included in the website and channels are merely republished information from official and unofficial domestic and foreign sources, and it is obvious that users of the said content are responsible for following up and ensuring the authenticity and accuracy of the materials. Therefore, while disclaiming responsibility, it is declared that the responsibility for any decision-making, action, and potential profit and loss in the capital market and cryptocurrency market lies with the trader.