
xWindx
@t_xWindx

What symbols does the trader recommend buying?
Purchase History
پیام های تریدر
Filter
xWindx
$HYPE Update After the $36 → $49.5 Rally
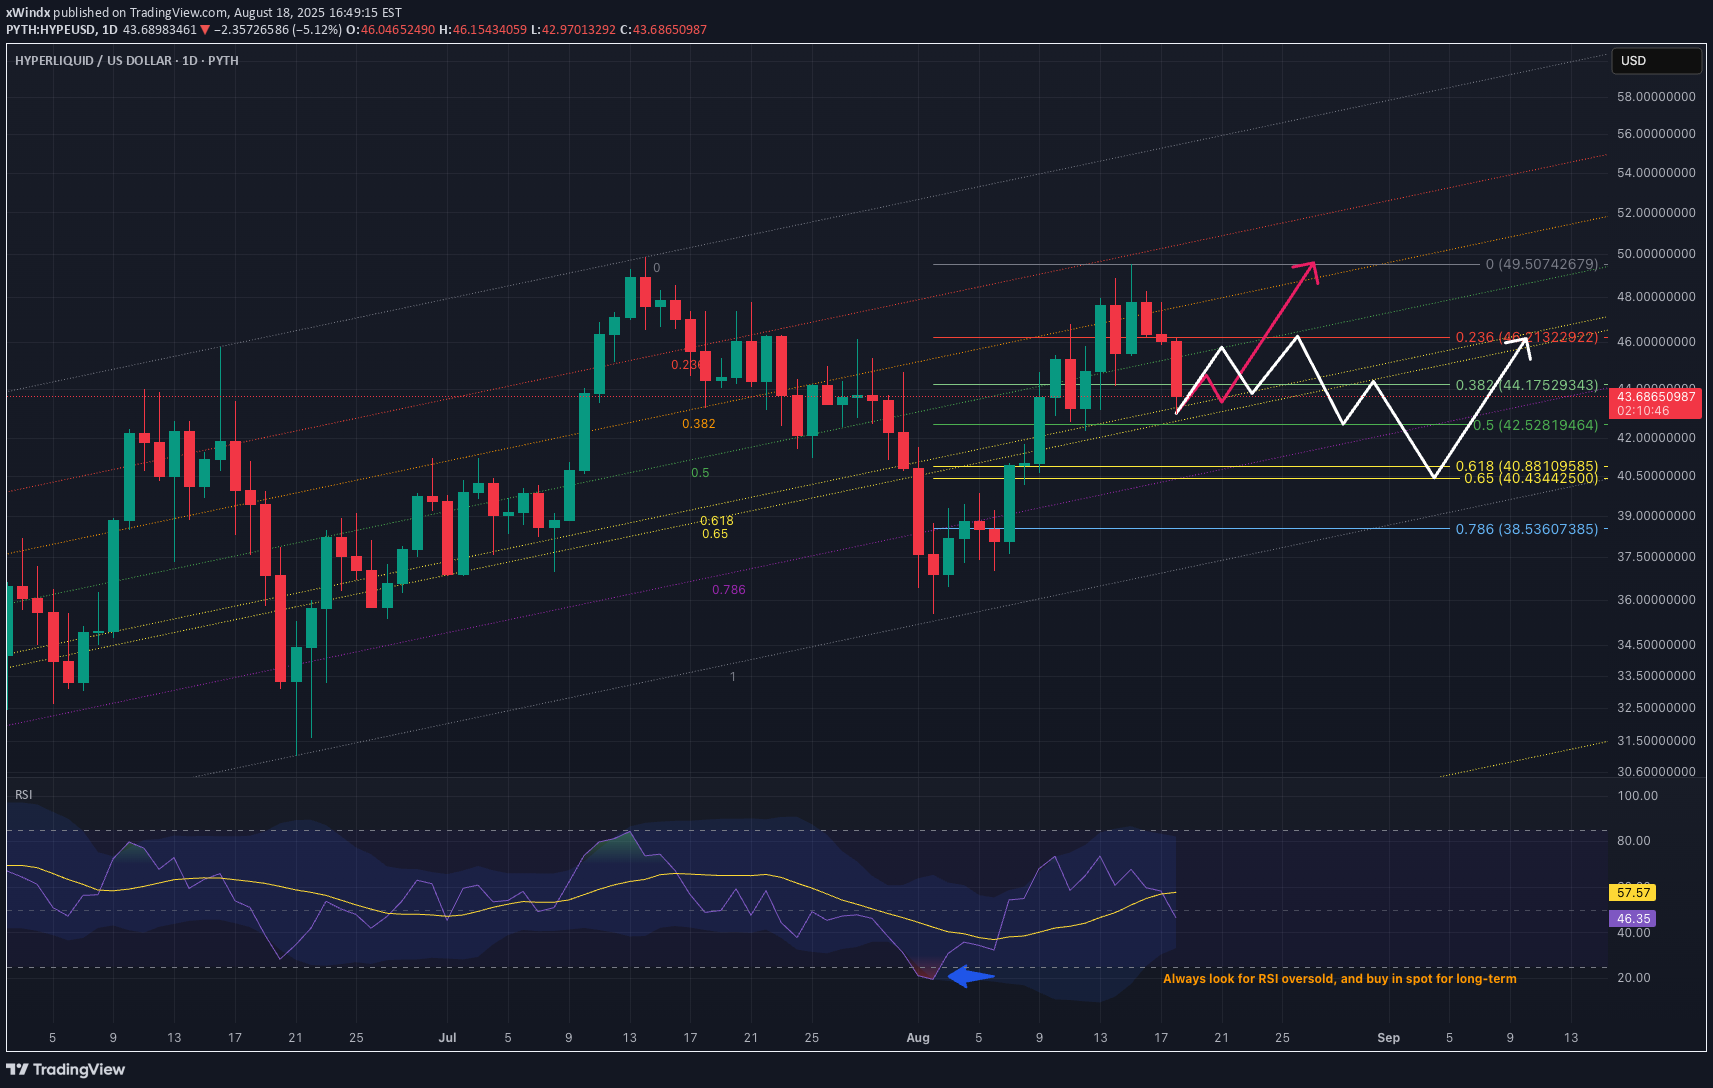
Our last call played out perfectly. HYPEUSD tapped $36 support and then rallied hard to $49.5, giving a clean swing win. Now, price action is once again at an important inflection point. Current Observations Price is currently testing the Fib Channel 0.618 (~$43–$44). Channel structure remains intact, so a bounce here is highly probable in the short term. If this level fails, the channel bottom (~$39–$40) will be the next key area to watch. Short-Term Setup Bounce expected around $43–$44 (current 0.618 Fib Channel test). If BTCUSD and overall market condition recovers, pink path is highly possible. If breakdown occurs as the white path, the $39–$40 channel bottom should act as strong support. Both zones are solid re-entry areas for both swing traders and investors. Targets on next bounce TP1: $46–$47 (minor resistance) TP2: $49.5 (recent swing high) TP3: $53–$55++ (extension if bullish continuation resumes) The overall channel uptrend is still intact. Unless price closes below $39, this move looks like a healthy correction within the broader uptrend. If $39 breaks (low probability), strong accumulation zone still sits at $30–$33. Final Thoughts Our $36 entry → $49.5 rally proved the power of confluence levels. Right now, we’re in another high-probability bounce setup. Base case is Short-term bounce from $43–$44. Alternate case is Deeper retest at $39–$40 for the next big leg up. As usual, patience and tiered entries remain the best strategy here. Not financial advice. Just updating my technical view after the last successful setup.It reached $40 earlier than expected and we are in. Currently doing the bounce again at $43–$44 which is really good for the upside move.
xWindx
MKR Weekly Outlook – Short-Term & Macro Perspectives
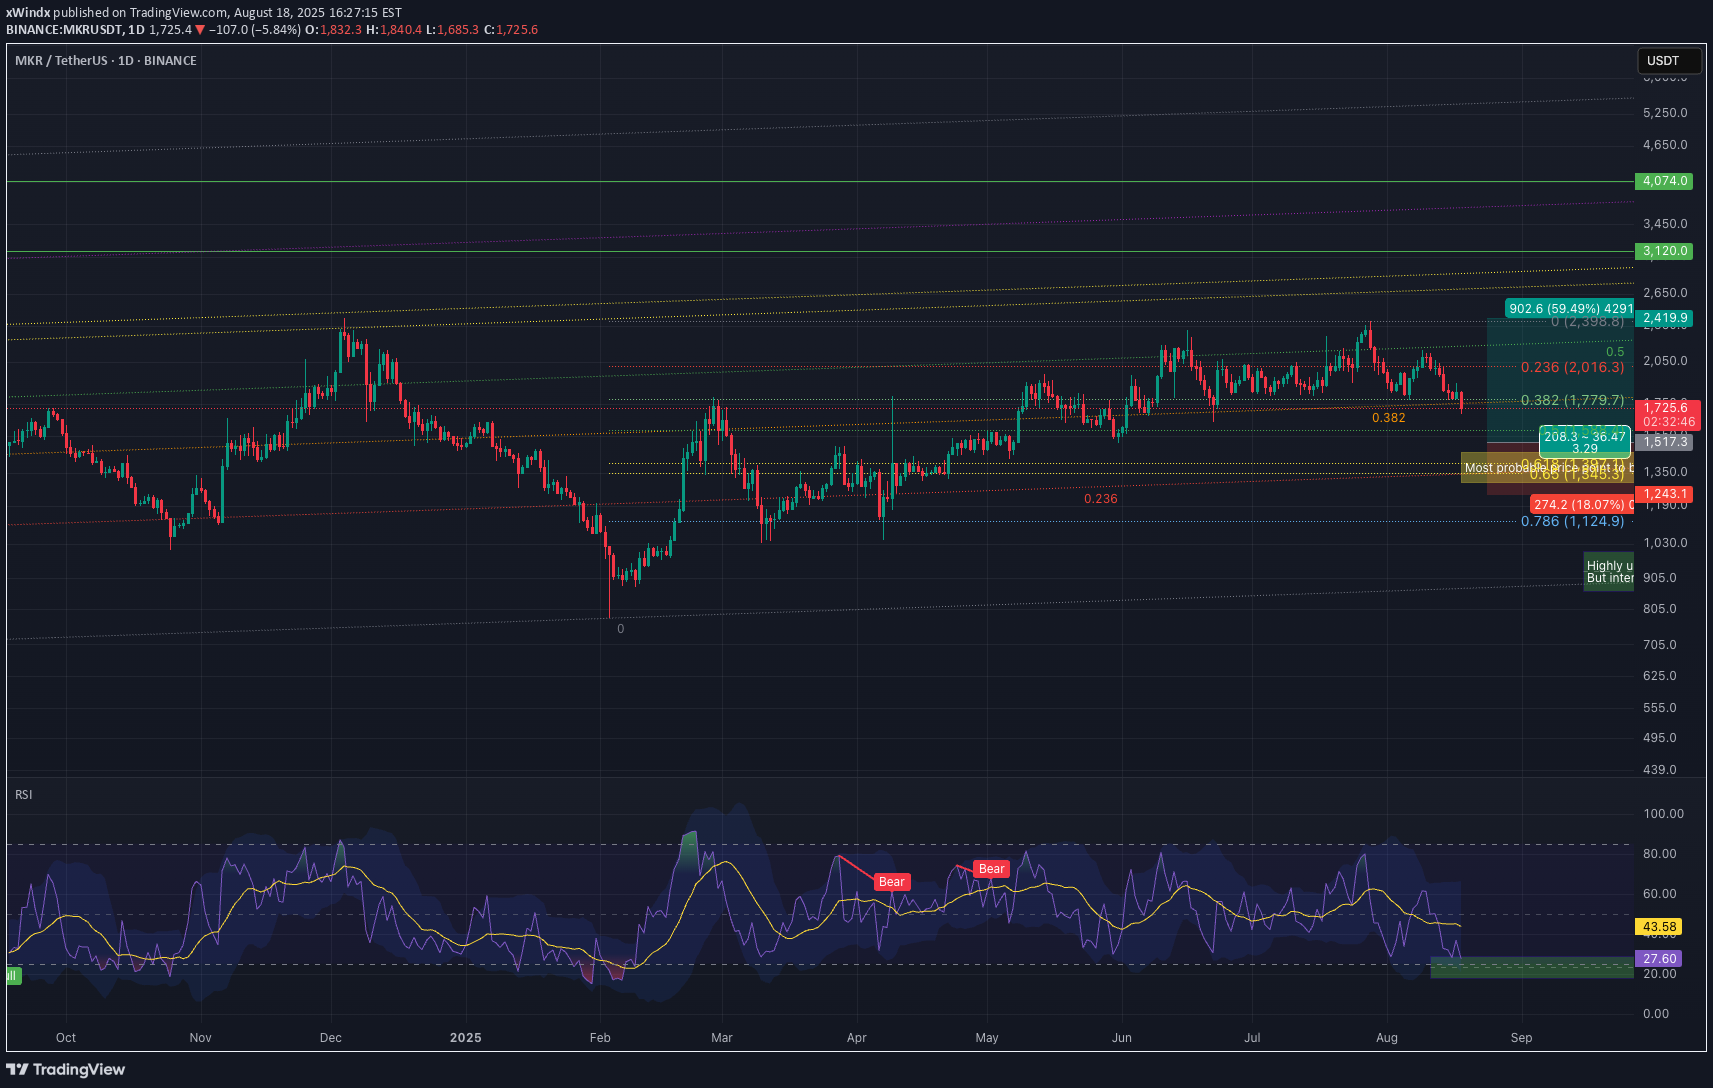
MKR stalled around the $2,400 resistance zone and is now retracing into key Fibonacci levels. In my view, this correction looks healthy and could set up the next strong move higher. Short-Term Trader Focus (next 1–4 weeks) Currently, $1,722 (0.382 Fib) level is being tested. With daily RSI already in oversold territory, this level could provide a bounce toward $1,950–$2,050. If $1,722 fails, next strong levels are $1,588 (0.5 Fib) and $1,362 (0.618 Fib). Both are strong buy-the-dip zones for swing traders. ⚡ Trading idea is to look for bullish reversal signals in the $1,588–$1,362 zone for swing long entries. High probability that the 0.618 Fib (~$1,362) will hold, so I plan to scale in gradually rather than waiting for the perfect entry. Macro Investor Focus (multi-month horizon) The macro trend remains bullish as long as MKR stays above $1,124. Current retracement is likely just a mid-cycle cooldown before MKR attempts higher levels. Macro upside targets are $3,120 (next major resistance) $4,074 (strong long-term target) Yes, $1,124 is so far away. If price ever returns there, the broader market would already be in severe distress. It is highly unlikely to get there at the moment. Hence, we are going to gauge our long-term spot entry with RSI (weekly). Currently it is cooling off from elevated levels, nearly resetting around 40–45, which historically aligns with strong long-term accumulation zones. 📌 Strategy: Scale into positions now and between $1,588–$1,362 for long-term holds. If RSI dips into oversold territory by Feb 2025, I’ll go in with full size at spot for a multi-month hold. Expect eventual move toward $3,120+ once correction completes. 📝 Summary Traders -> Watch $1,722, $1,588, $1,362 for bounce setups. Investors -> Treat this retracement as an opportunity to accumulate before MKR makes its next leg higher. Long-term bullish structure intact unless MKR breaks below $1,124 which is almost impossible at the current market condition. Not financial advice. Just my technical view. Manage risk accordingly!
xWindx
Analyzing Healthy Pullback on $HYPE with Fibs + RSI
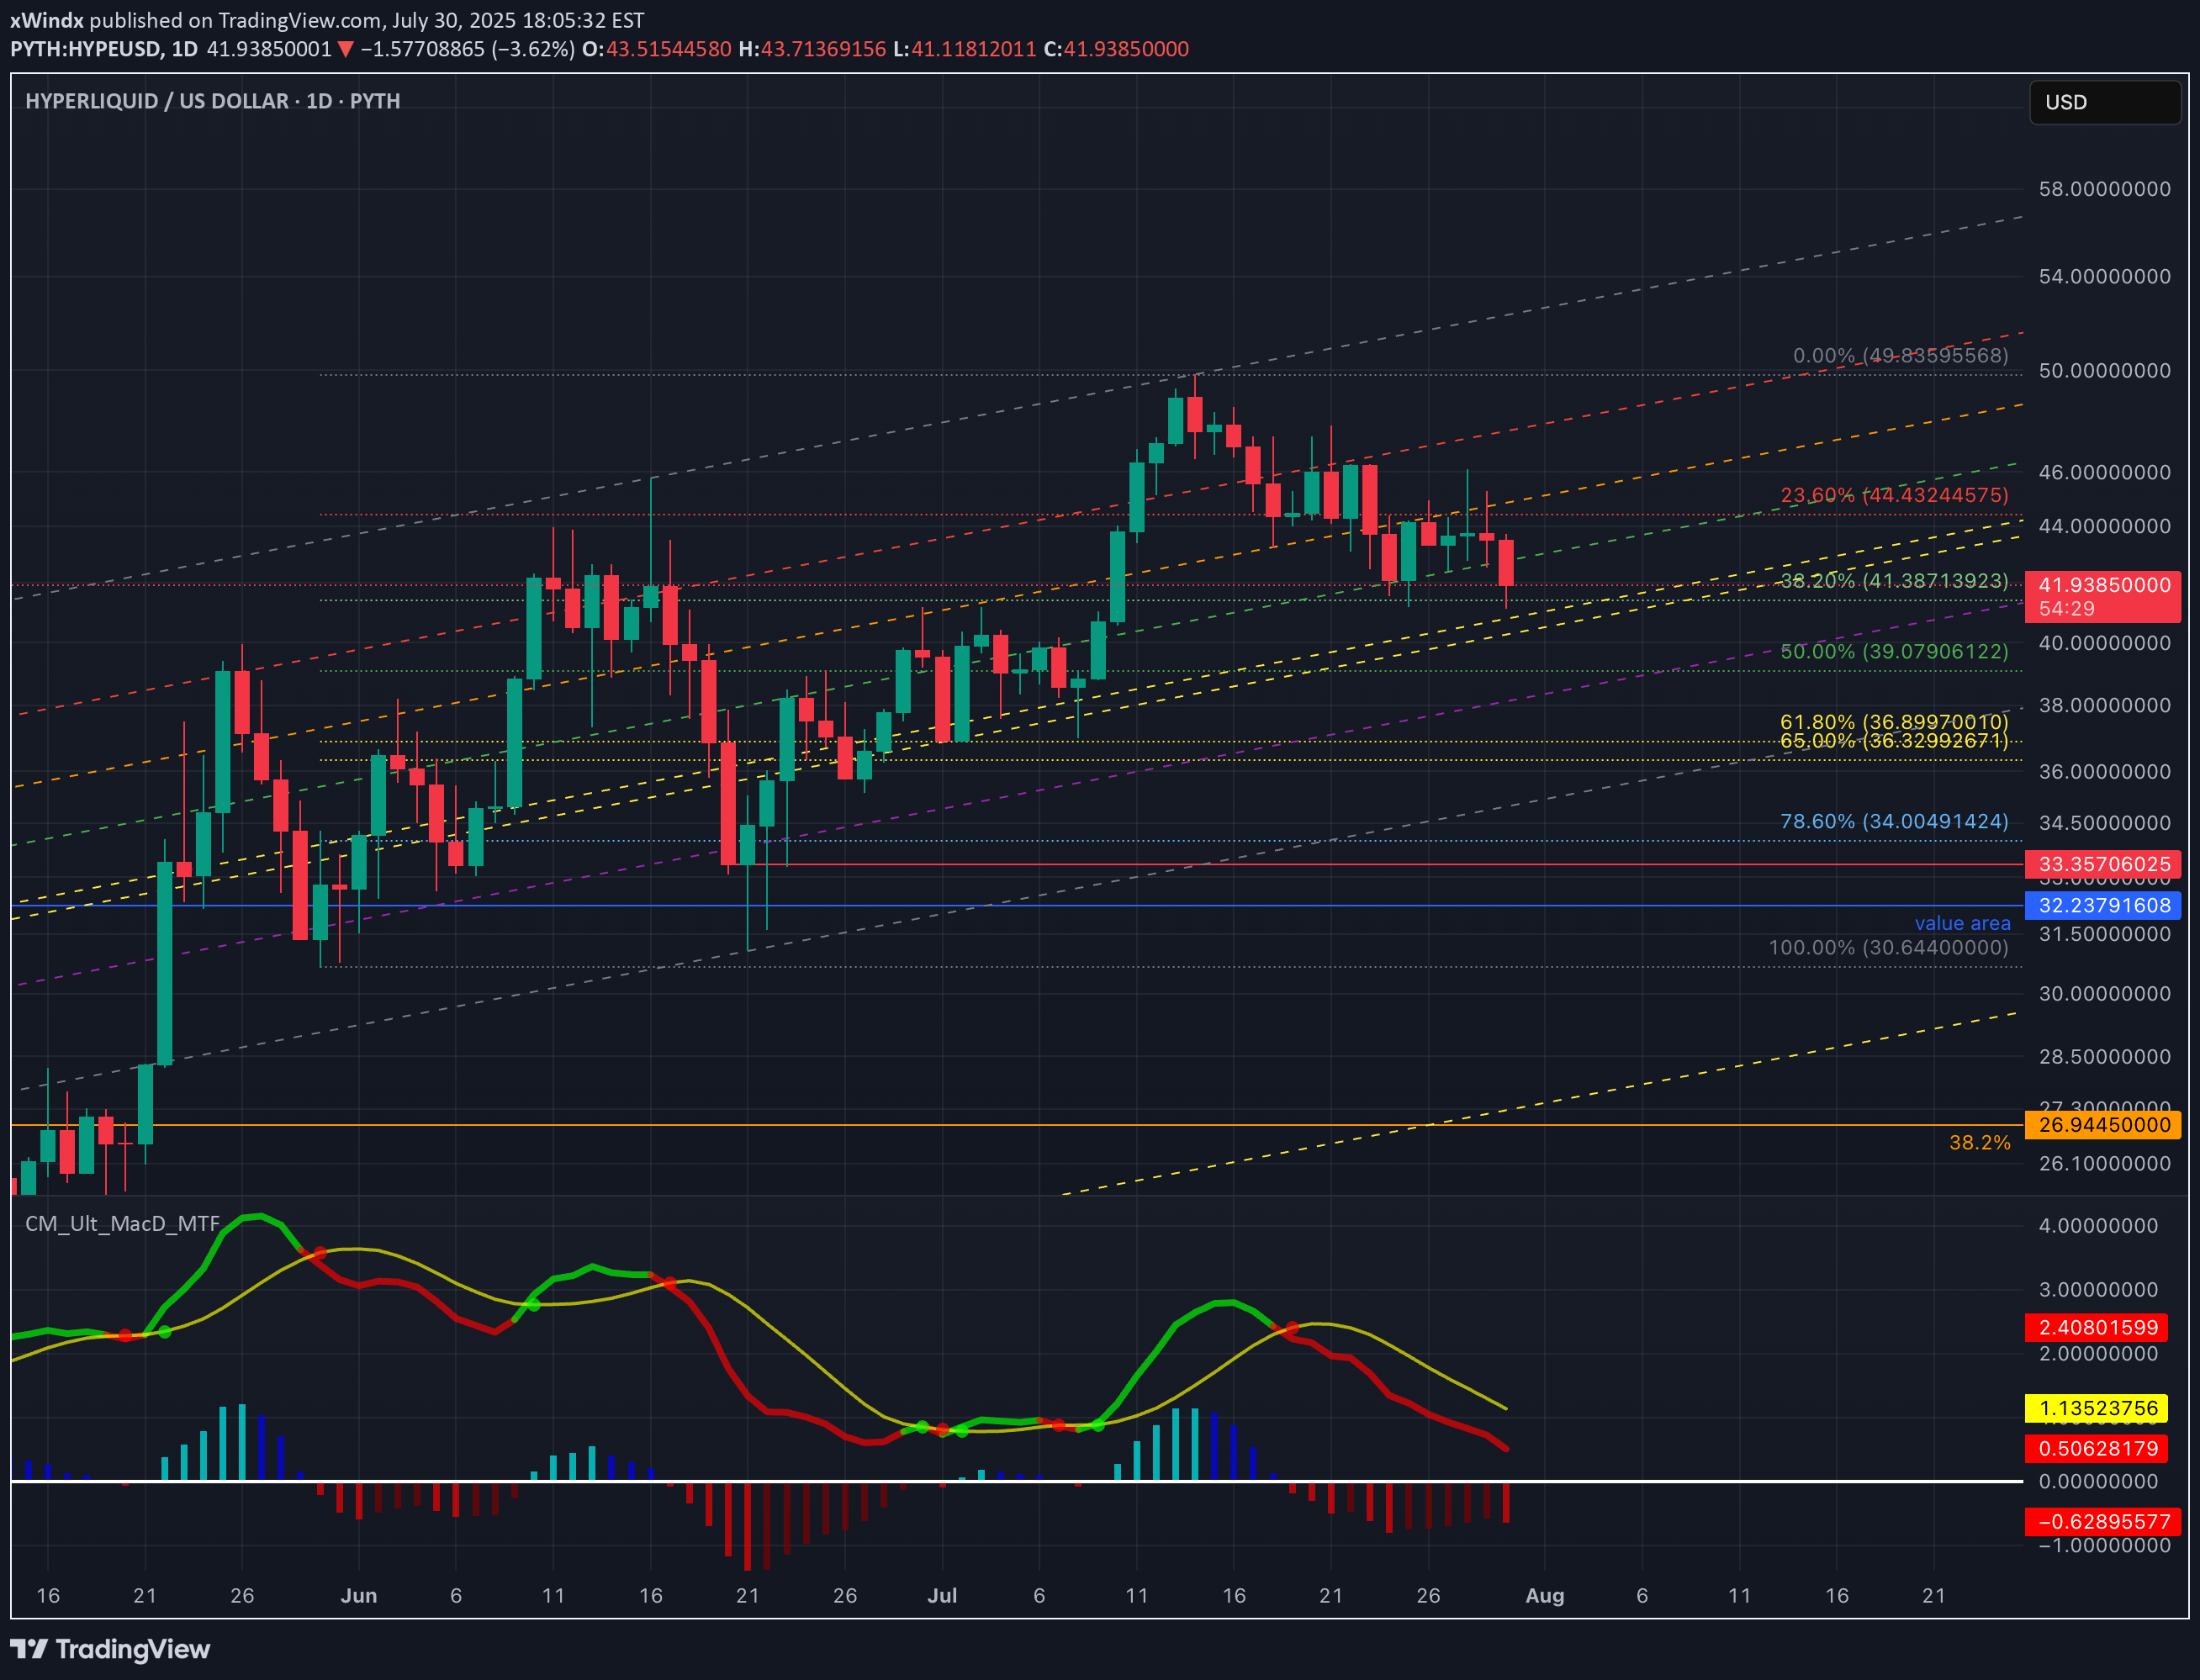
After a strong rally to ~$49.83, HYPEUSD is now retracing into a critical Fibonacci confluence zone — a key moment to watch as we position for the next potential leg up. Key Observations Price is hovering around Fib 0.382 and nearing the Fib Channel 0.618 RSI is approaching oversold (currently ~32) MACD remains bearish with momentum still building If the golden pocket zone (~$39–$40) holds, it could mark the end of this short-term correction. Trade Setup to Watch When price taps the $39–$40 level, we will be looking for ✅ MACD crossover on lower timeframes ✅ Bullish RSI divergence Because this could signal a short-term bounce opportunity. So, I am expecting the entry zone around $39.0 – $40.0 TP1 - $44.4 (Fib 0.236 – first resistance) TP2 - $49.8 (Previous swing high) TP3 - $53–$55++ (Extension target if bullish continuation resumes) If there is any changes in the macro environment, we also have a contingency plan to buy more lower. If price breaks below the golden pocket, strong support lies in the $30–$33 region. So we will do big accumulation there. It is a huge discounts imo. It is like 5% of probability to actually happen at the current market condition though. Even a deeper move toward $27 (TOTALLY unlikely at the moment!) would be a mega long opportunity. When it happens, it should not be a breakdown panic. Final Thoughts Current price action appears to be a standard pullback. The confluence of Fib retracement + channel support makes this a high-probability bounce zone. Watch for bullish divergence or volume spike between $36–$39 Patience now = Better positioning later.Entered the trade at $36.75 (fib retracement golden pocket)Update:
xWindx
$BTC Retest Before Takeoff?
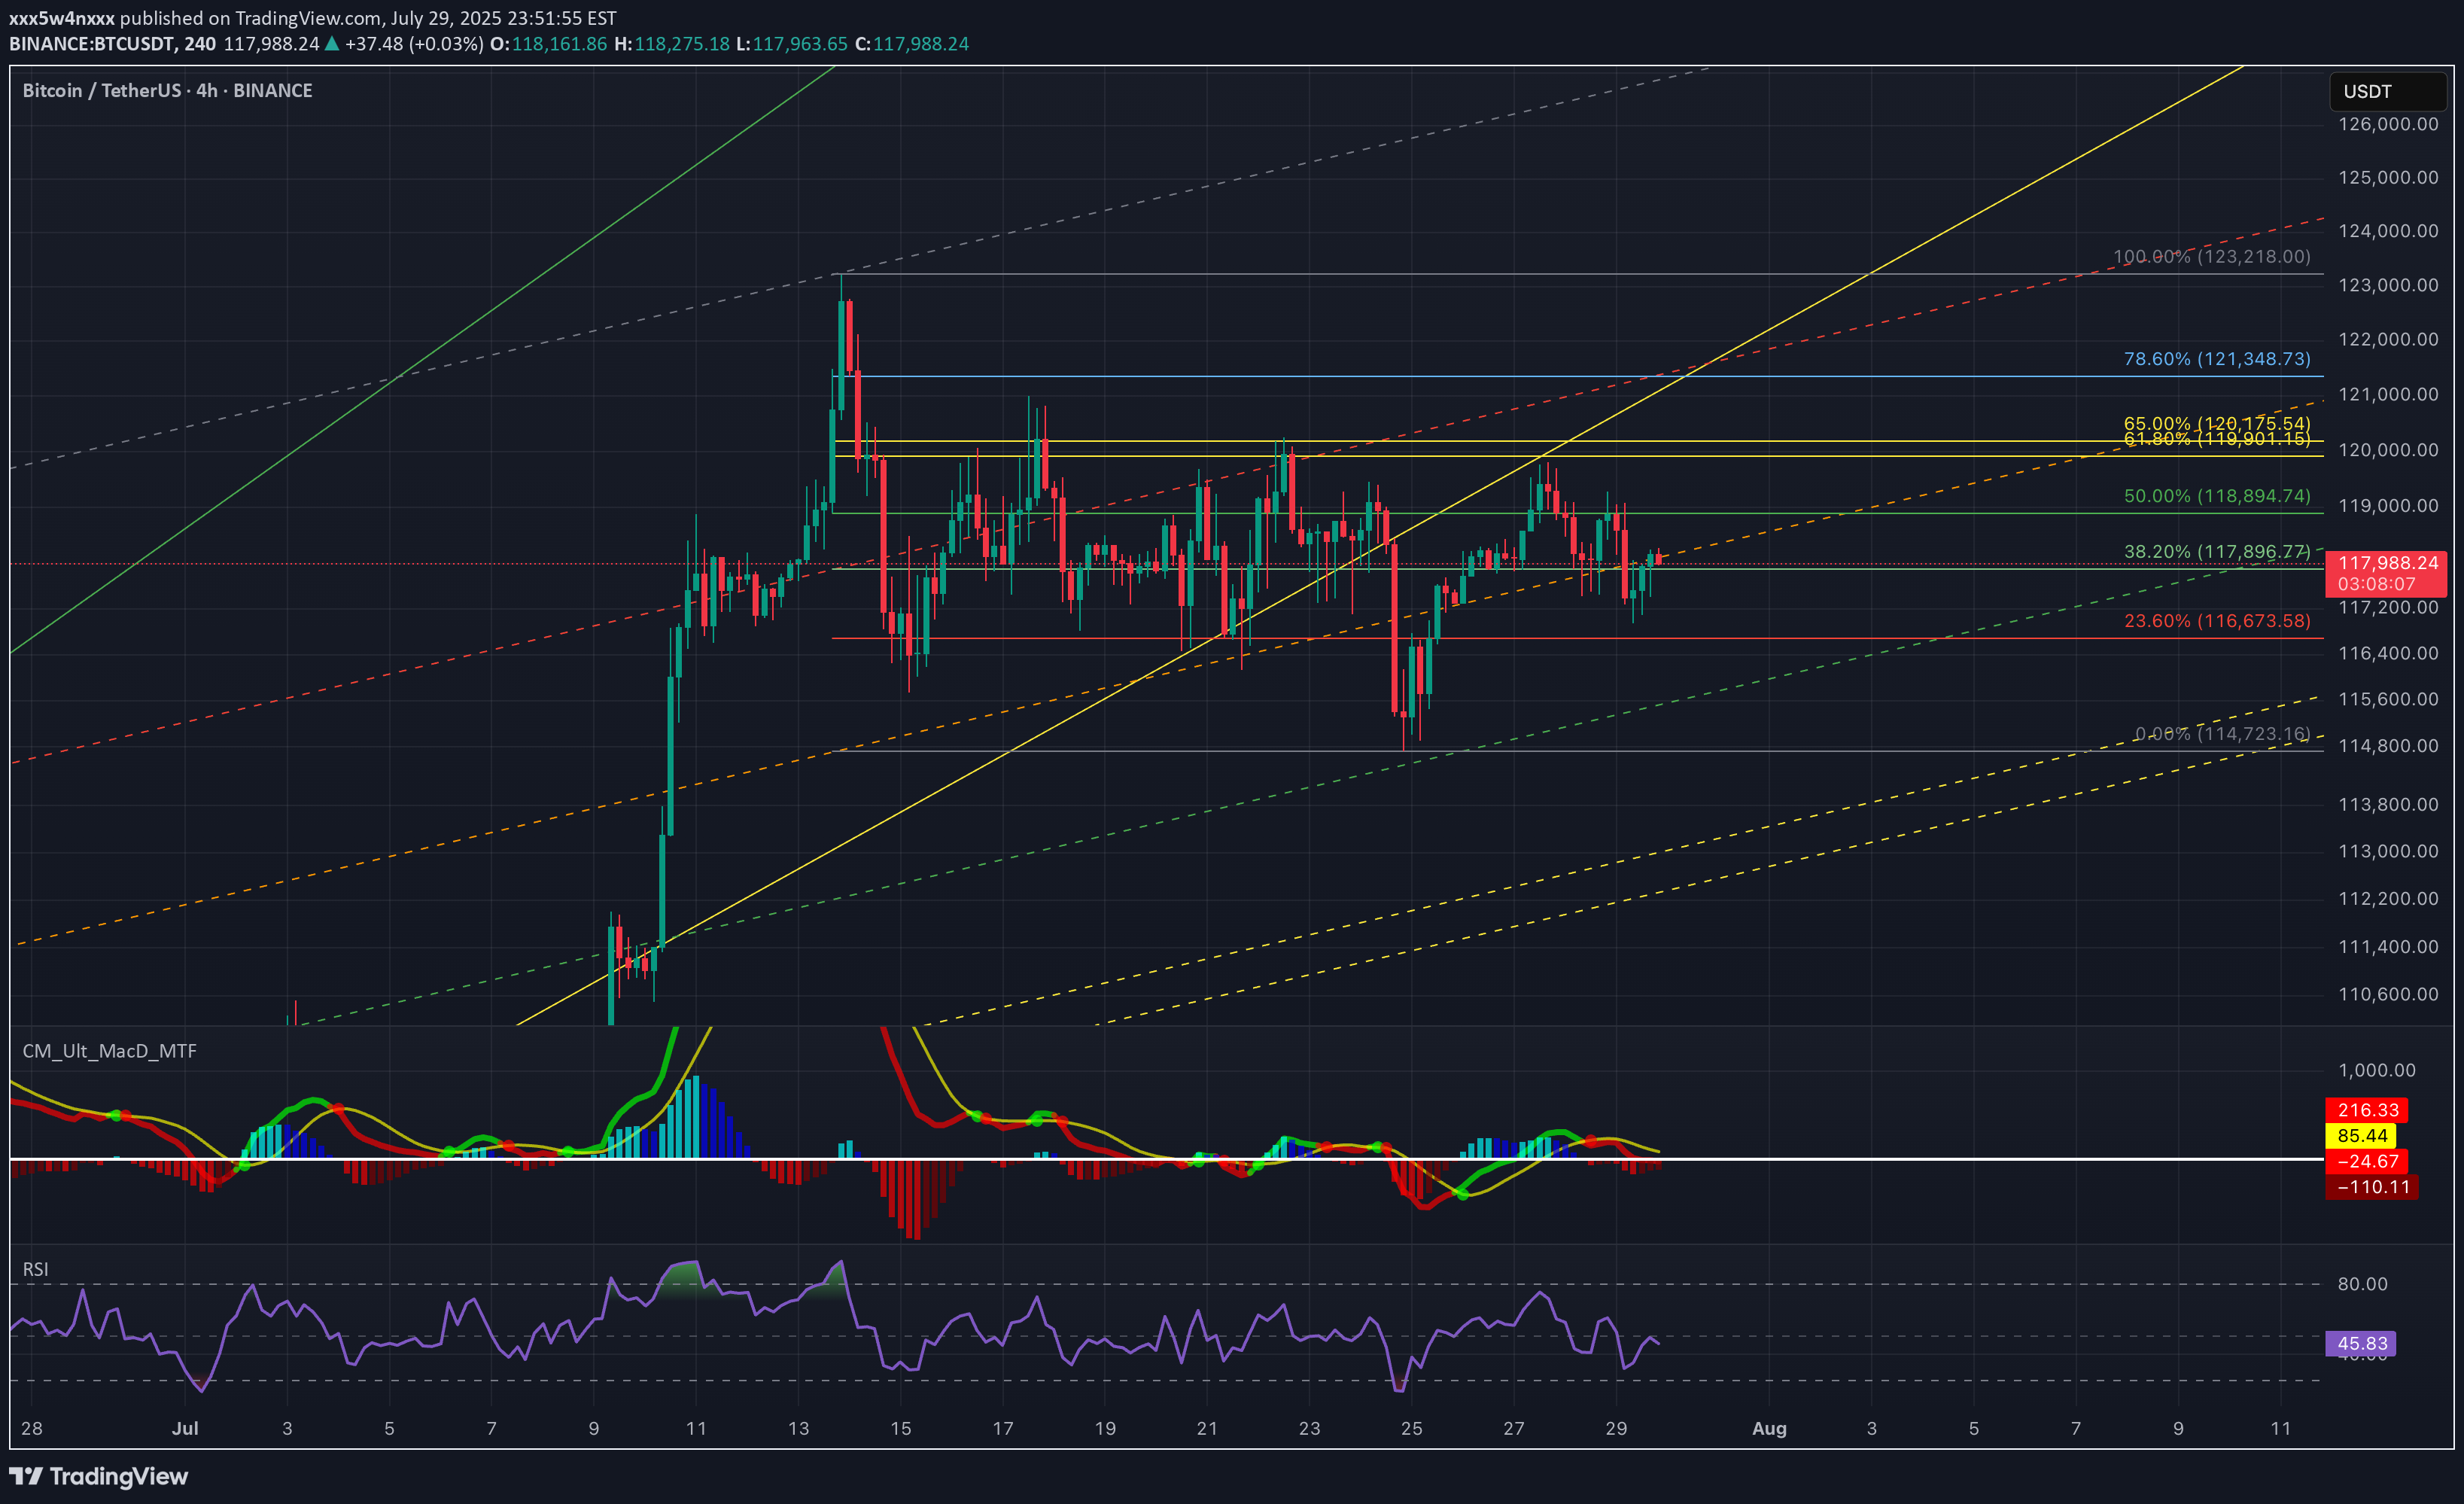
Back on July 27, I shared a path 120K → 114K → 127K Price has followed this playbook closely and now we’re at a critical zone again. On daily timeframe, structure is still in an uptrend, but momentum is fading. Price is consolidating between 119.9K–120.1K (Fib 61.8–65%) and 117.8K–116.6K (Fib 38.2–23.6%). MACD bearish crossover and histogram is still growing. RSI is neutral at 51 but definitely losing bullish energy. If 117.8K breaks cleanly, we may revisit 114.7K (demand zone + full Fib retracement) before bulls reclaim control. If we look at lower timeframe (4H). It is forming a tight range, but a lower high + weakening MACD suggests a bit more downside short term. Also, RSI at 46 confirms that consolidation with mild bearish tilt. Key levels that I am currently looking are 118.8K–117.8K for the short-term intraday range play. And 116.6K & 114.7K for the support & potential bounce zone. The scenario is still in play - Rejection at 120K - Retest 114K–116K zone 🚀 Then potential launch toward 127K (measured move + channel top) Only a daily close above 120.1K with volume invalidates this retrace idea. TL;DR 🟥 Resistance: 119.9K–120.1K 🟧 Neutral zone: 117.8K–118.9K 🟩 Support: 116.6K - 114.7K 🟦 Target: 127K if bulls reclaim the high ground Still playing the patient game. Let’s see if 114K gets tagged one more time. What do you guys think?Price briefly touched $115.7K and bounced back strongly to 117.8K level. The analysis is still in play!Price reached to 124K. Massive Profit!
xWindx
WorldCoin Price Retracing to Golden Pocket for next leg up?
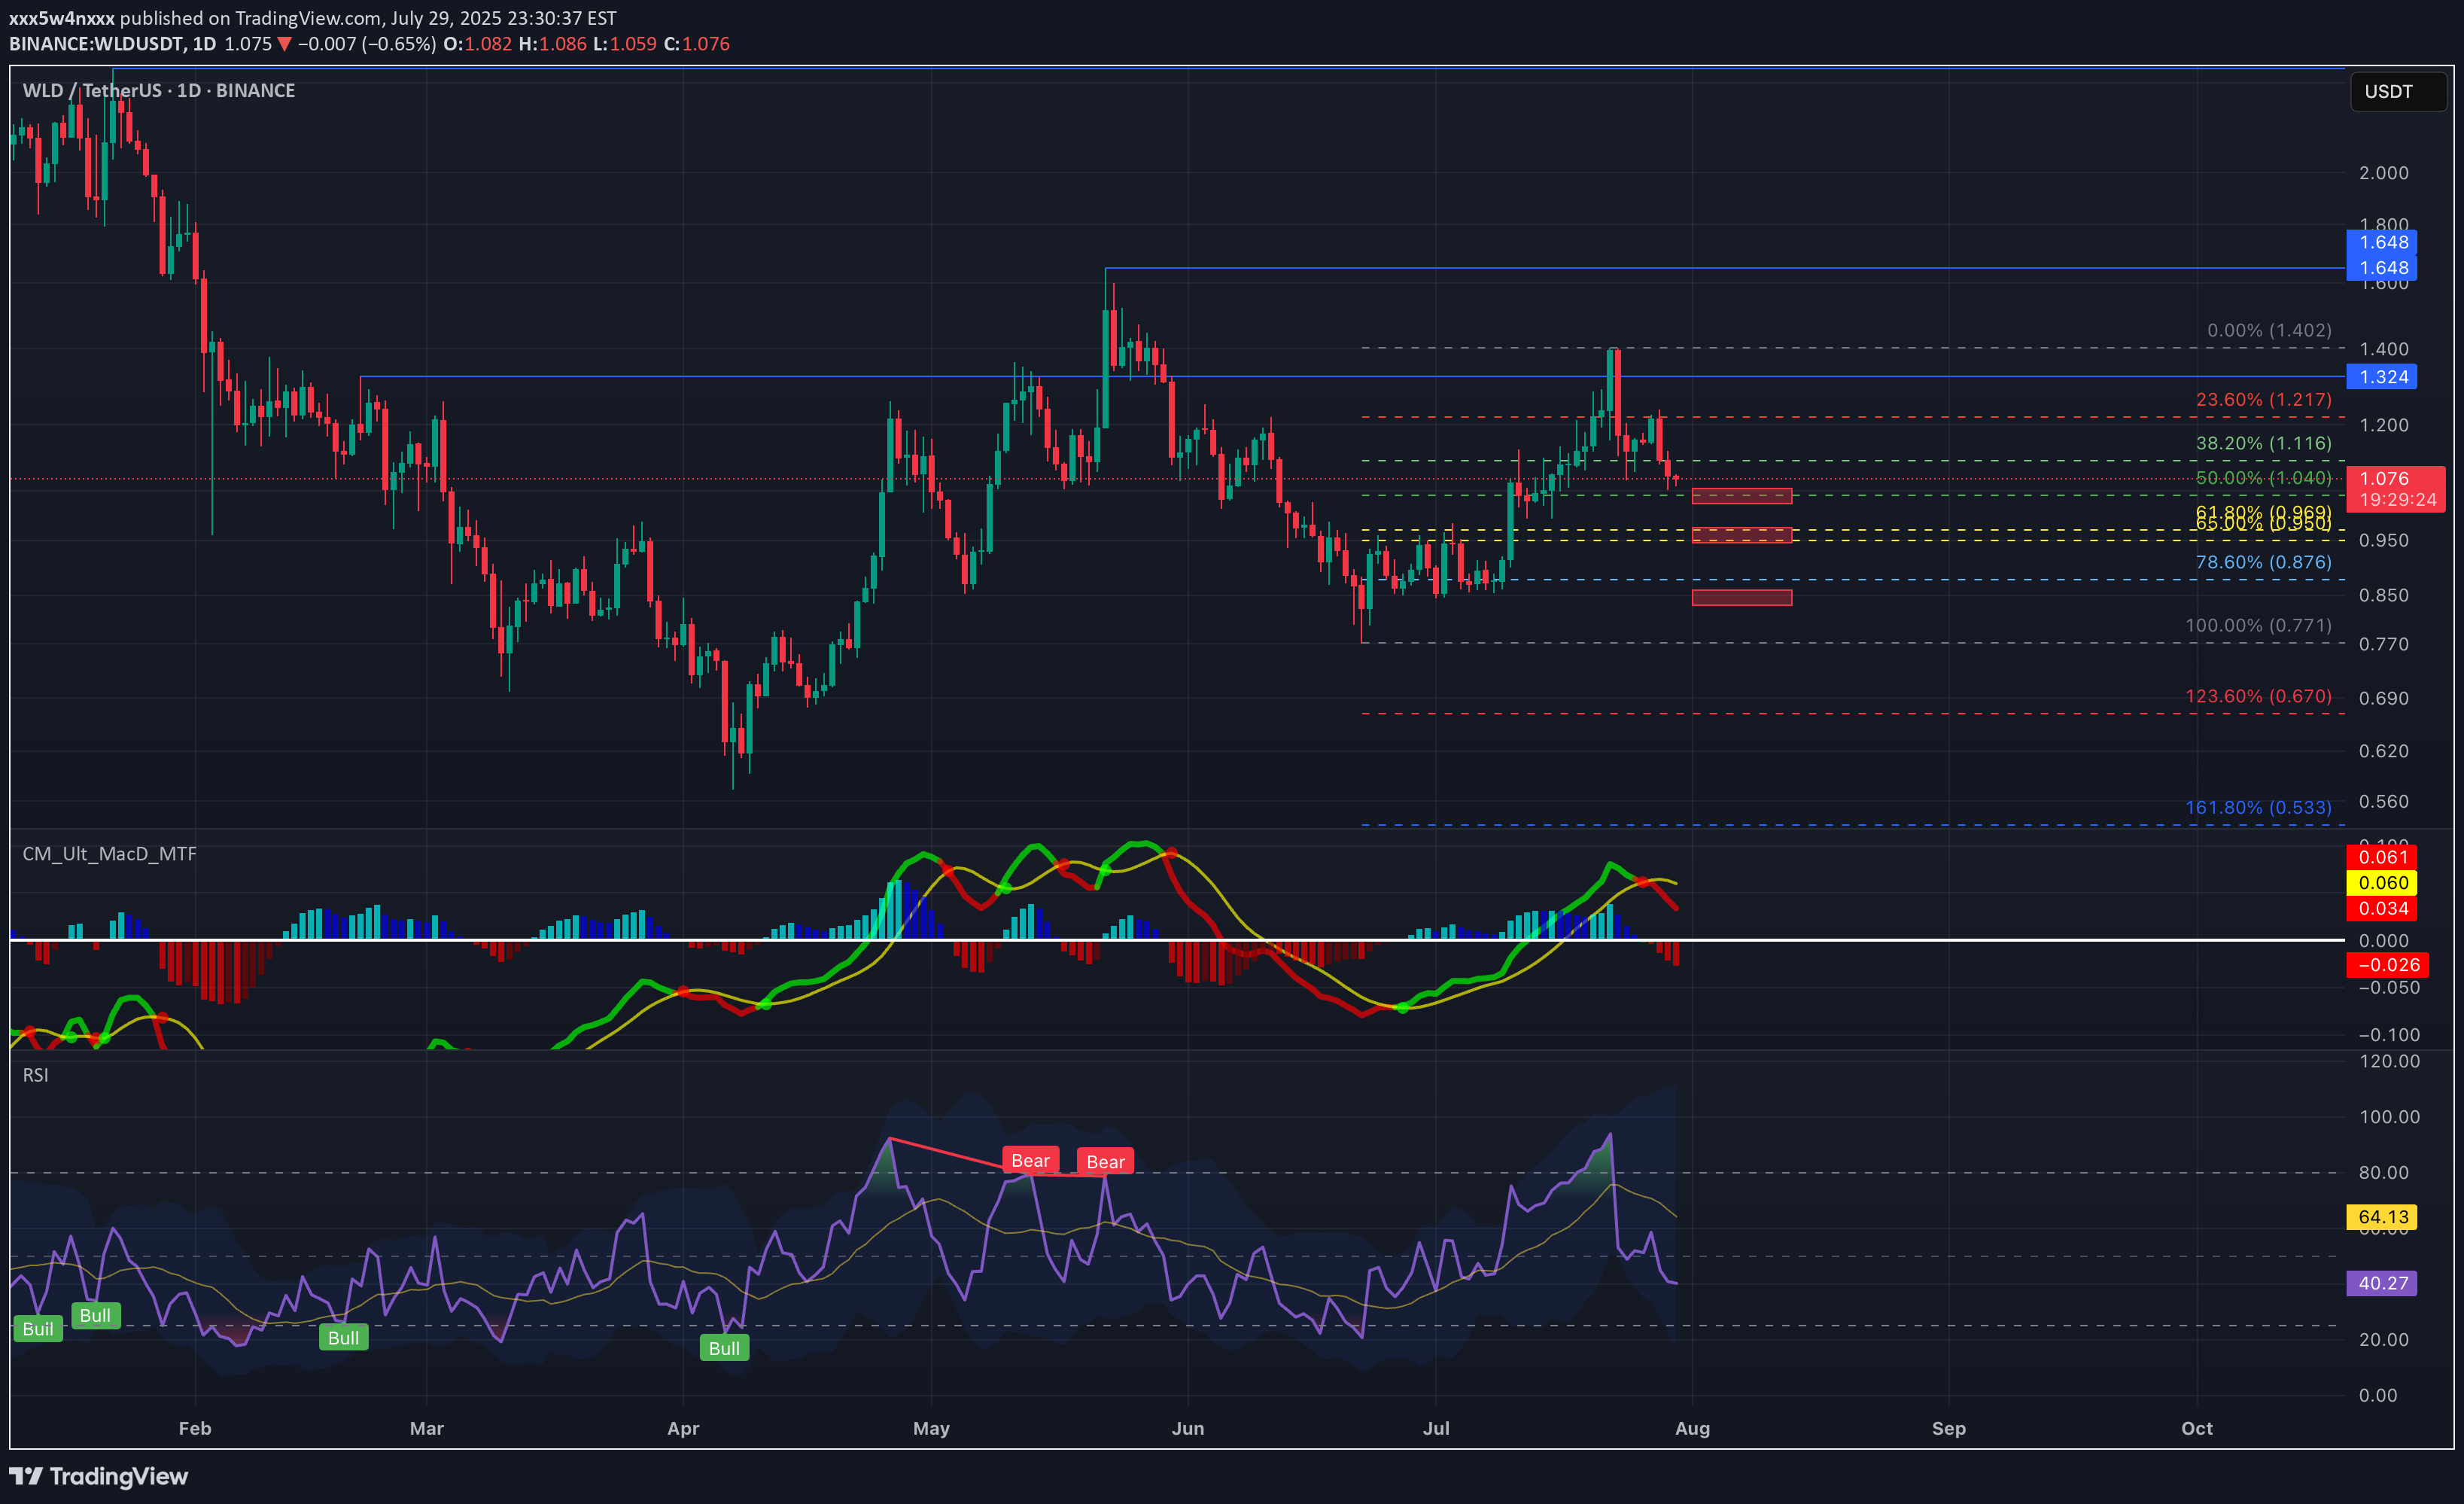
After rejecting the key resistance, price is retracing and currently hovering around the 50% Fib level (1.040). Currently, MACD crossover below signal and RSI rolling down from overbought. So, momentum has turned bearish. I'm watching the 0.968–1.000 zone (Fib 61.8% + demand) as a critical bounce or breakdown area. A bullish reaction here could trigger a rebound toward 1.324, 1.648, and more. Break below 0.960 opens room toward 0.876 or lower. The plan is to go LONG if price shows strength near 0.968 (bullish engulfing, divergence) 📌 Bearish bias short-term, but key support test coming. Staying flexible.
xWindx
Where exactly is the most probable bottom of BTC for this cycle?
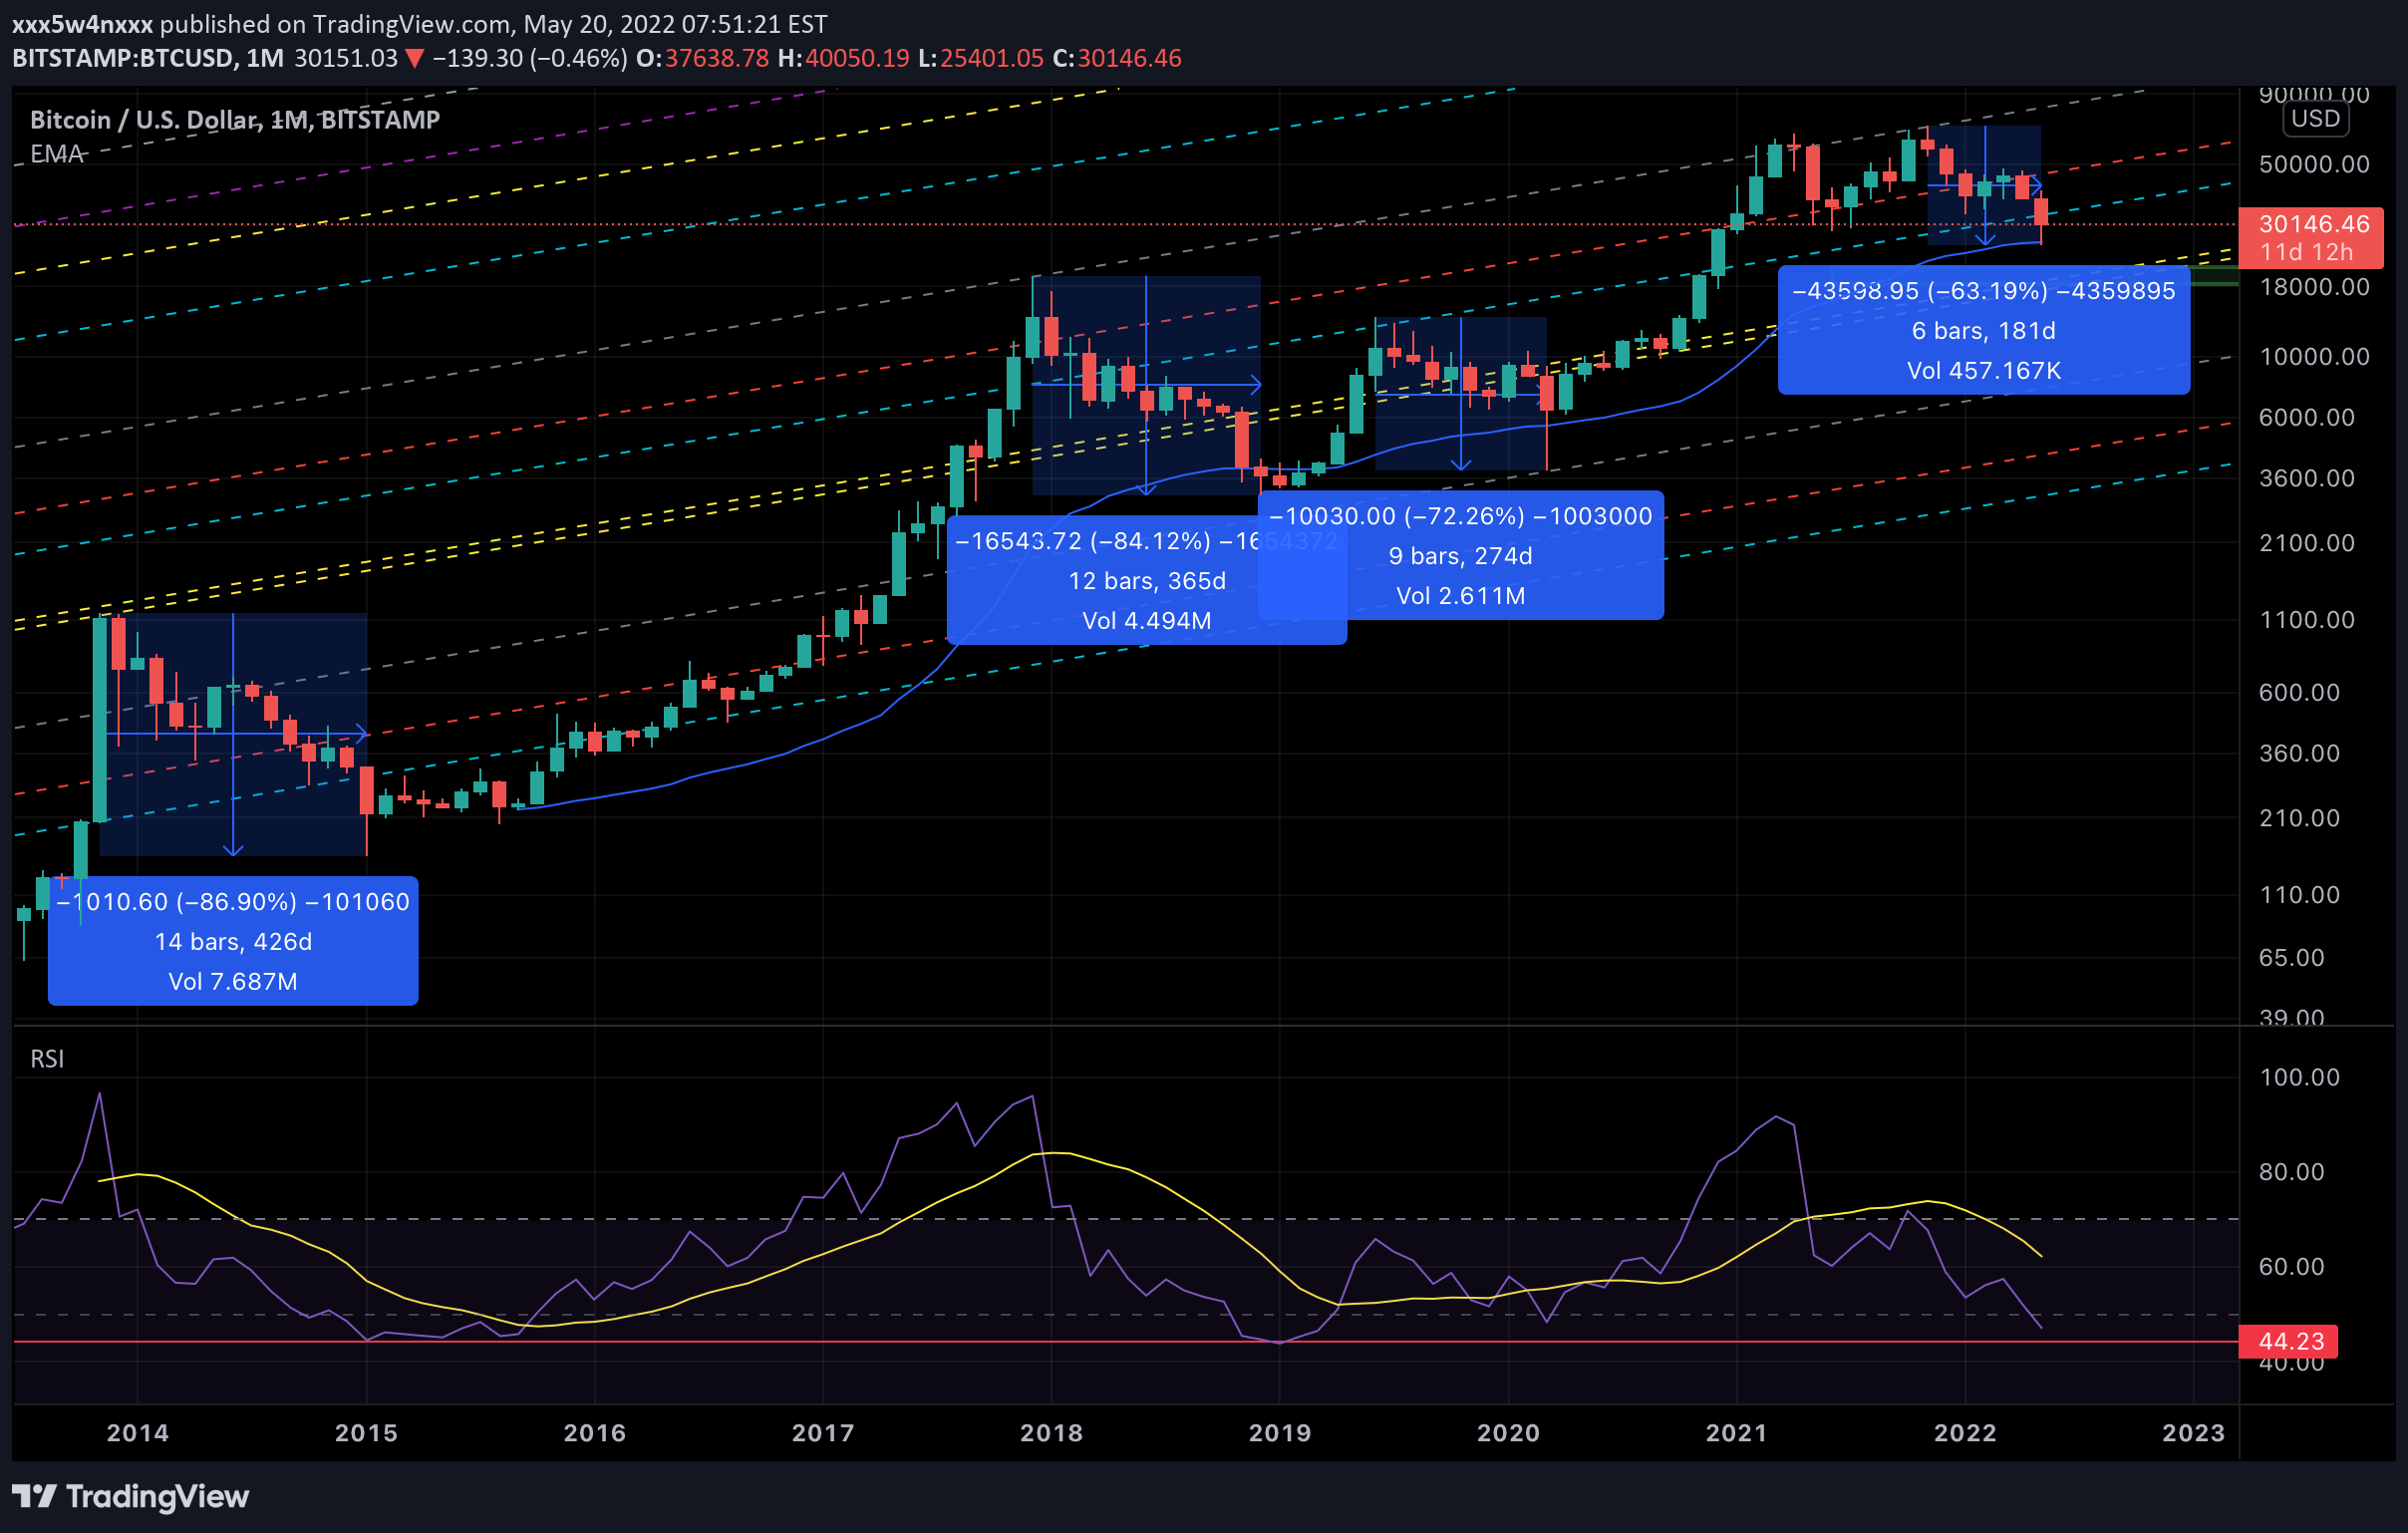
This is the analysis based on the following data points 1. Monthly historical price action 2. Monthly Fibonacci Channel 3. Monthly Fibonacci Extension 4. EMA50 (Monthly) 5. RSI We have been analyzing long term BTC price movements accurately since December 2021. Now that BTC is in sideway again, we are going to analyze the possible next moves. To be honest, current market is the hardest to analyze for us. There are mixed signals on the chart. We will try to provide as much information and perspectives as we can. We will start with the Fibonacci extension which we have drawn based on monthly swing high/low. And zoomed in as a daily chart. Below you can see that the price bounced back exactly at 0.618 line of the fib extension. If you look at the Monthly chart above, it just touched monthly 50EMA line that day too. Coincidence? If we hit that golden pocket again and restart the bull run again, I won’t be surprised. However, there is still a chance that we will go down further. Let’s look at the monthly chart above for that assumption. If we look at 2014/2015, 2017/2018, and 2019/2020 price actions, we are very near our maximum pain level. We are already in 6 months with -63% from the top. It also aligned with what we have suggested in our RSI based analysis here . If we combine that two data points with the fib channel, we conclude that the area of fib channel golden pocket should be the bottom for this cycle. It will be -73% from the top. RSI monthly will also hit the bottom line. One thing to note is that if we are going to break below that golden pocket, we will be looking at one of the worst bear market in the history. Good luck.Back in 2022, we shared this macro BTC analysis based on: 🔹 Monthly Fibonacci Channel & Extension 🔹 Monthly EMA50 🔹 Monthly RSI 🔹 Historical cycle symmetry (2014, 2018, 2020) We identified a confluence zone (Fib 0.618 + EMA50 + channel support) as the "golden pocket" and likely bottom of the cycle. We marked the green box as our accumulation zone and suggested that if this holds, it could spark the next bull cycle. ✅ Executed and Validated ✅ Price dropped into the green box ✅ RSI bottomed on the monthly support line ✅ Bounce occurred exactly from the confluence zone 🎯 One of our best macro trades to date 🔄 Current Market Context BTC has now rallied significantly from that zone We’re back in sideways chop near key channel resistance But the structure remains bullish and I believe we are going to reach to the channel top probably in 2026.
Disclaimer
Any content and materials included in Sahmeto's website and official communication channels are a compilation of personal opinions and analyses and are not binding. They do not constitute any recommendation for buying, selling, entering or exiting the stock market and cryptocurrency market. Also, all news and analyses included in the website and channels are merely republished information from official and unofficial domestic and foreign sources, and it is obvious that users of the said content are responsible for following up and ensuring the authenticity and accuracy of the materials. Therefore, while disclaiming responsibility, it is declared that the responsibility for any decision-making, action, and potential profit and loss in the capital market and cryptocurrency market lies with the trader.