
MANTA
Manta Network
| تریدر | نوع سیگنال | حد سود/ضرر | زمان انتشار | مشاهده پیام |
|---|---|---|---|---|
 HexaTradesRank: 445 | خرید | حد سود: تعیین نشده حد ضرر: تعیین نشده | 22 hour ago | |
 SaitamasignalRank: 2590 | خرید | حد سود: تعیین نشده حد ضرر: تعیین نشده | 18 hour ago |
Price Chart of Manta Network
سود 3 Months :
سیگنالهای Manta Network
Filter
Sort messages by
Trader Type
Time Frame
Saitamasignal
شکست مانتا: سیگنال خرید قوی برای بازگشت صعودی در بازار!
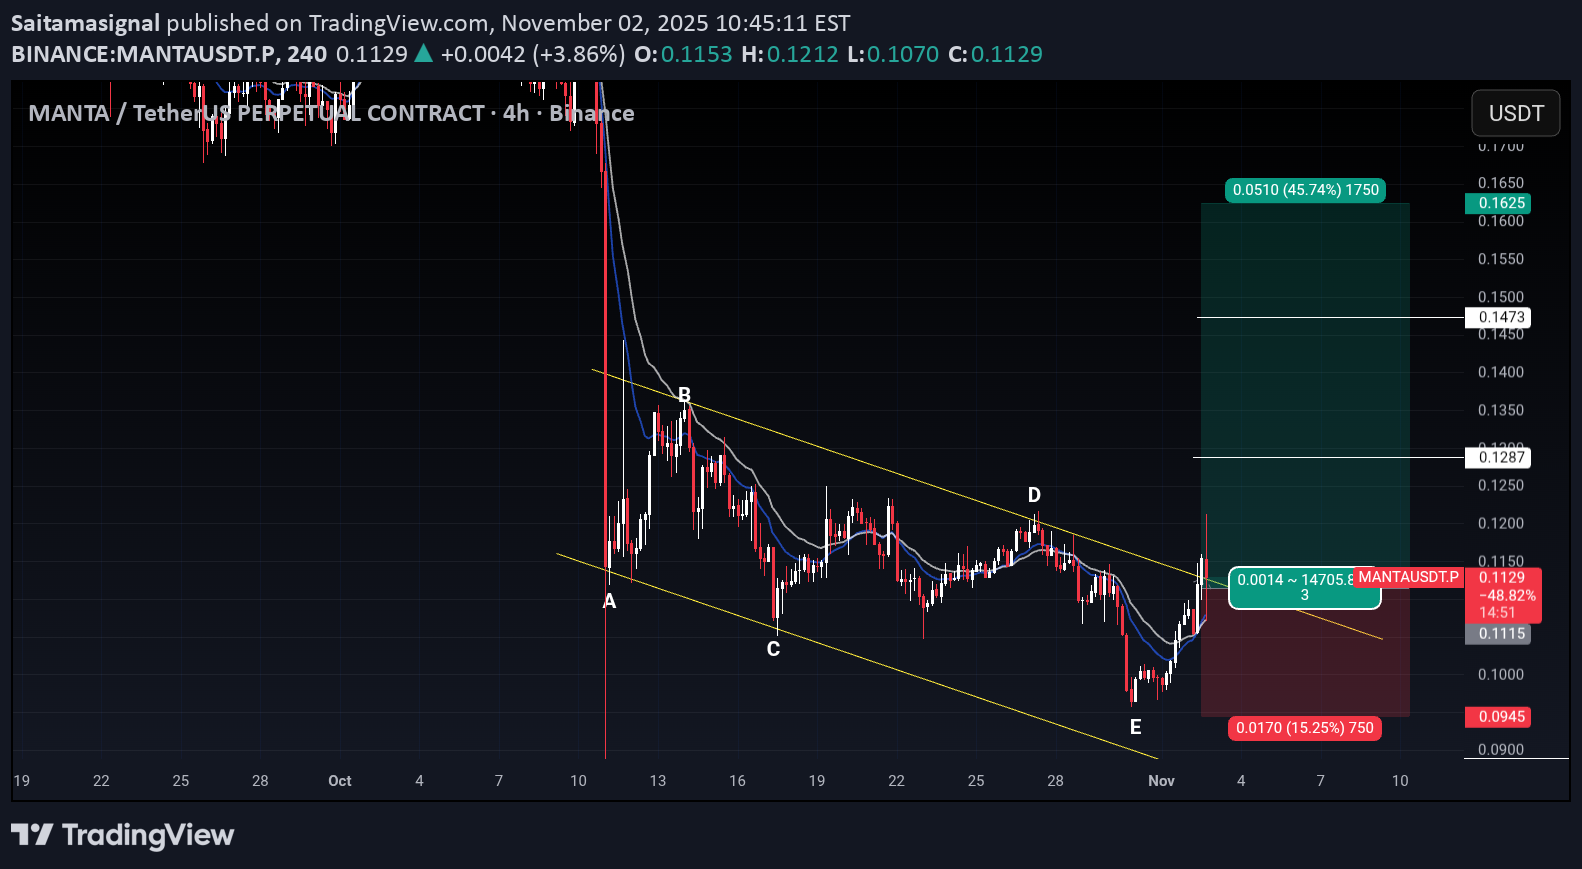
The mantausdt indicator indicates a potential bullish reversal from a long downtrend. The descending channel breakout and higher low structure support a long bias.

senyor
مانتا: راز پول هوشمند در رکود مصنوعی، جایگزین بعدی ماتیک و سلستیا!
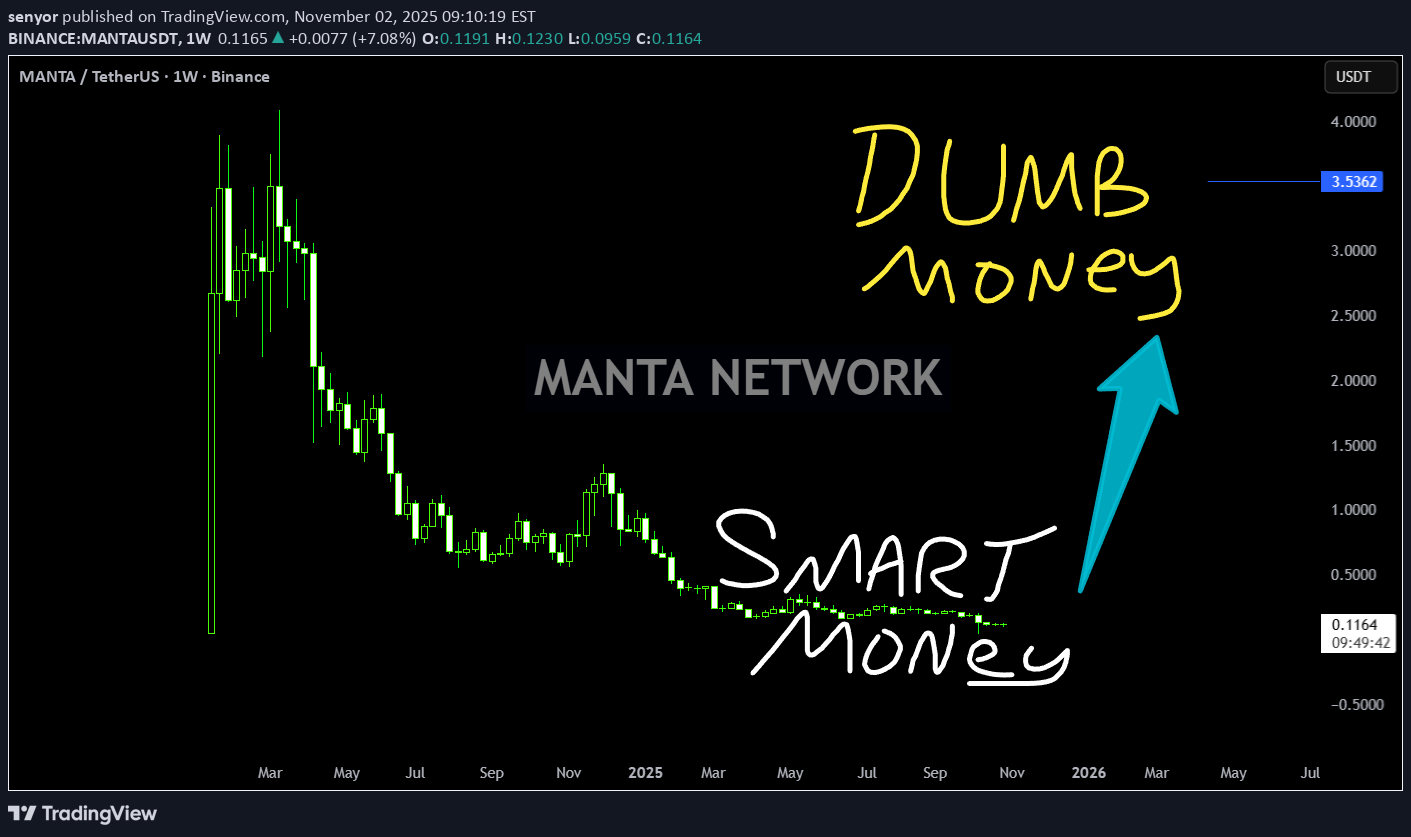
Understanding the mind of Smart Money at artficial depression with a project designed as robust as Matic Celestia and the next best alternative to whatever chain is mainstream low cost under the custody of Gang of 8
HexaTrades
شکست کانال نزولی؛ سیگنال صعودی قوی برای ارز دیجیتال مانتا (MANTA)
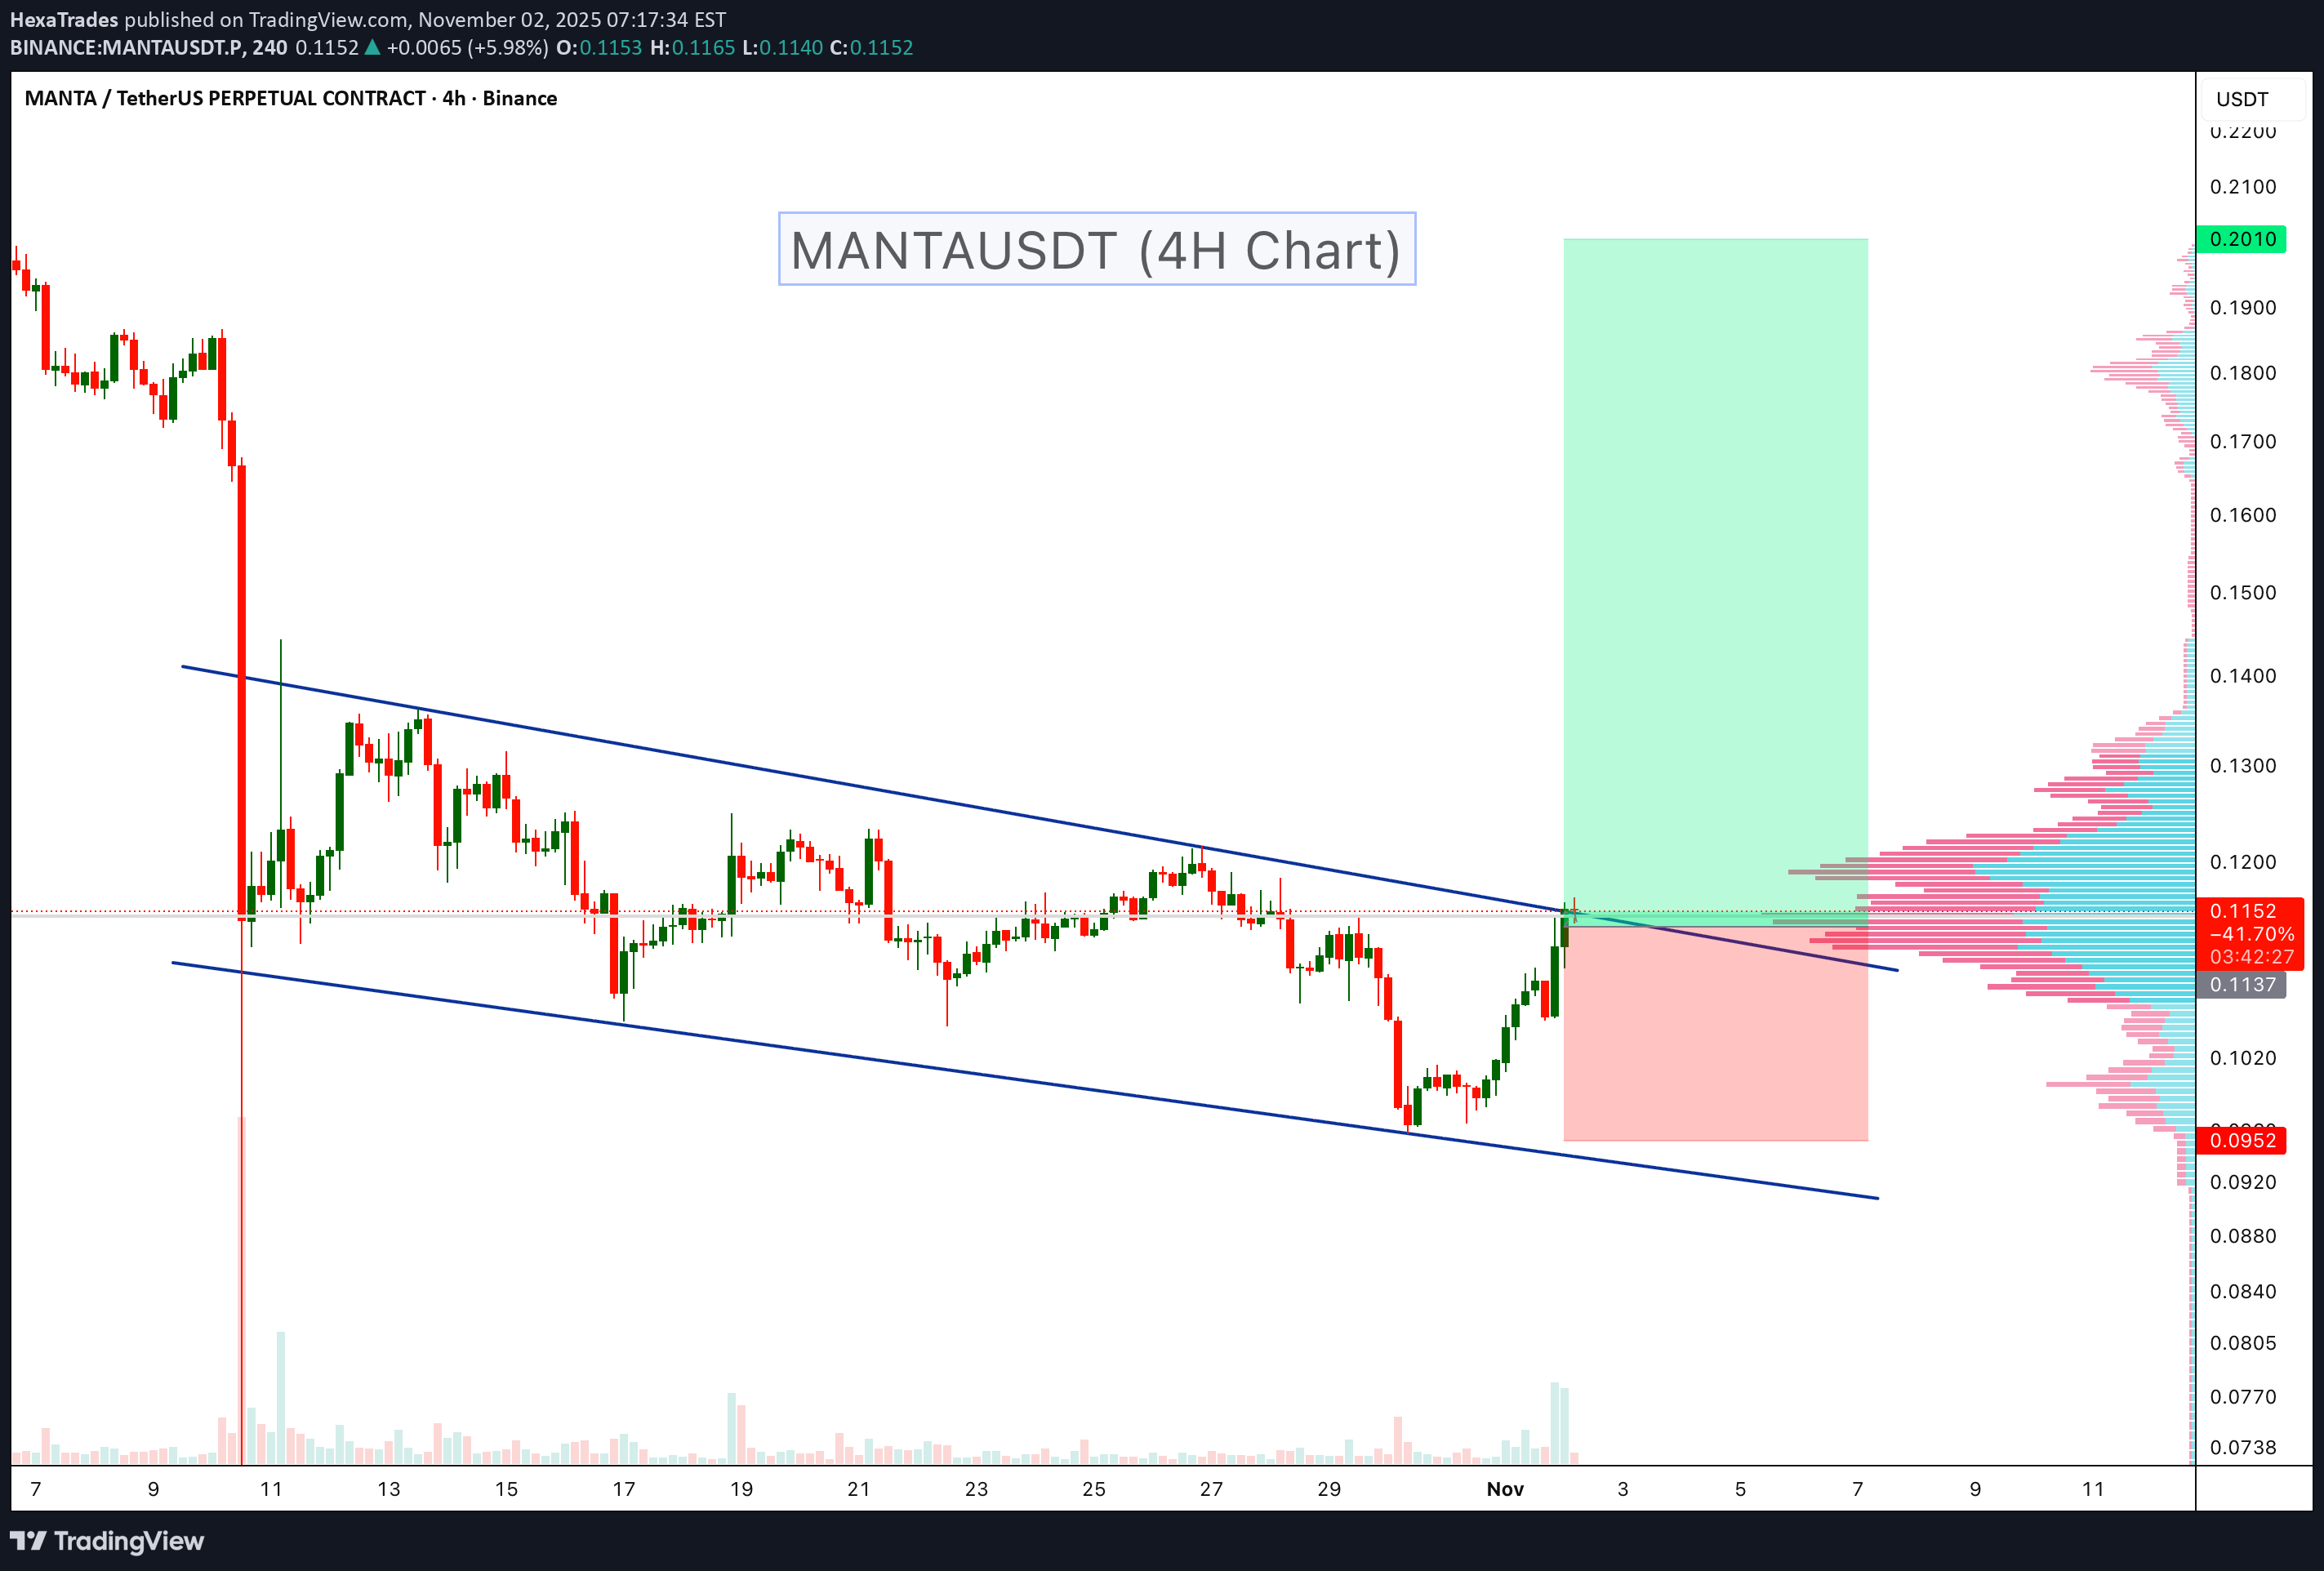
MANTA is showing a potential bullish breakout from a descending channel that has been holding price down throughout October. The recent strong recovery and breakout attempt above the upper trendline indicate early signs of trend reversal and possible momentum shift to the upside. Key Points: -Price has broken the upper boundary of the descending channel after multiple rejections. -Volume increase on breakout confirms buyer activity. - Horizontal volume profile shows a strong liquidity base near $0.10 – $0.11, which could act as solid support. - Short-term target zone lies between $0.18 – $0.20, aligning with the next major supply area. - Ideal invalidation below $0.095. Buy zone : Above $0.115 Stop loss : $0.095 Cheers Hexa MANTA MANTAUSDT

bisttekniknoktacom

AB = CD formation is one of the most commonly used harmonic formations in technical analysis. This structure, which seeks symmetry in price movements, shows potential return zones to investors. The formation consists of four points: A, B, C and D. AB The leg of the CD and the CD leg is usually equal to each other or very close. BC correction usually occurs at 61.8 %or 78.6 %. Investors can open a position by predicting the direction of the price at point D. This formation can be seen in both rise and decrease trends. The right target and stop determination is critical for success.

UnculturedTrade007
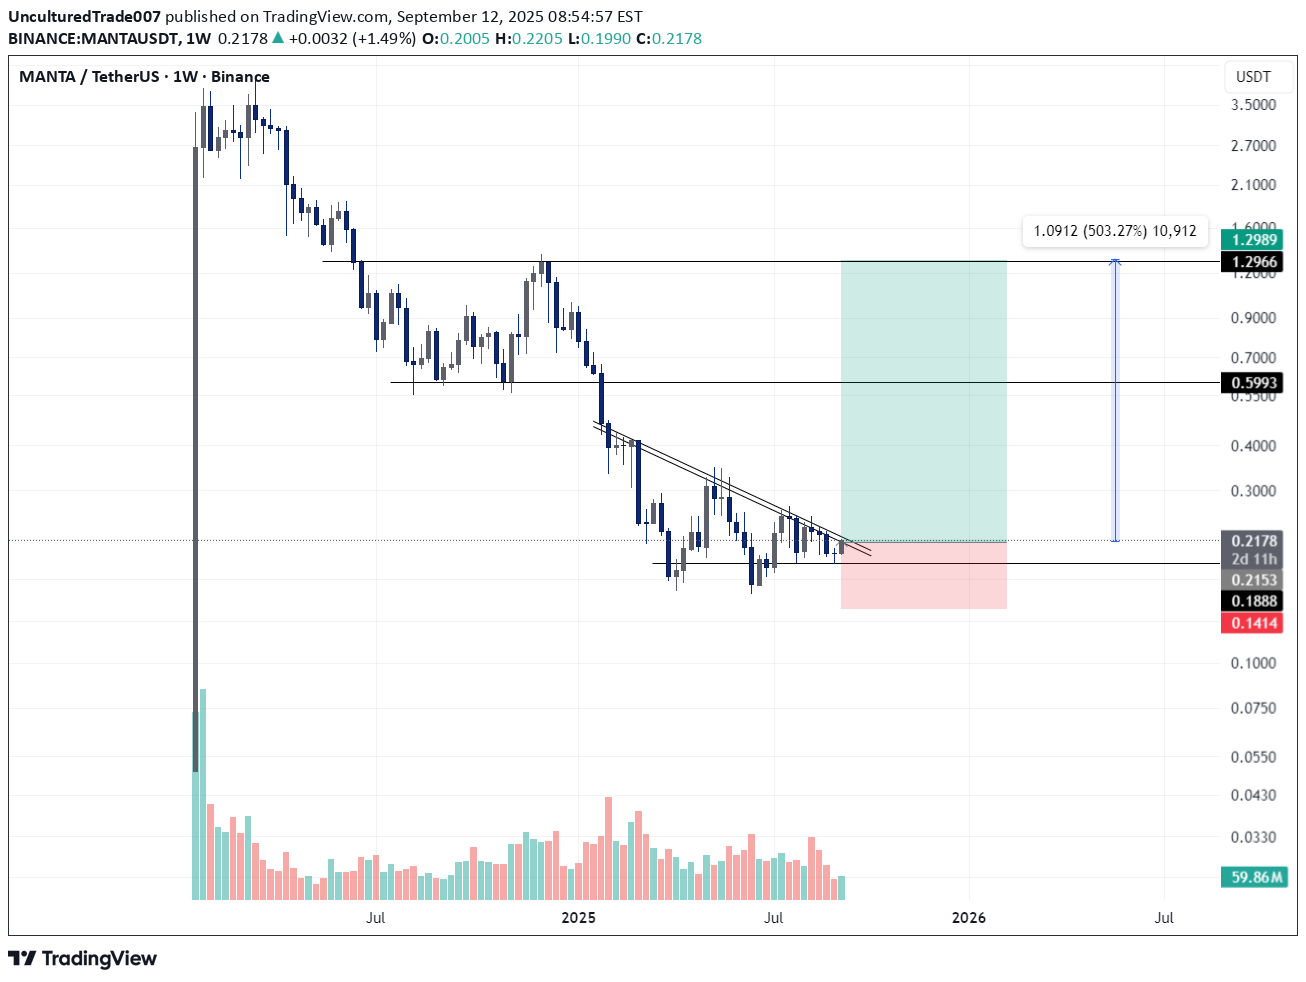
MANTAUSDT Entry: ~$0.21 Stop-loss: ~$0.14 Targets: $0.60 (1st), $1.30 (2nd) Upside: ~500% potential Risk/Reward: Very favorable if breakout holds

CoreCrypto1
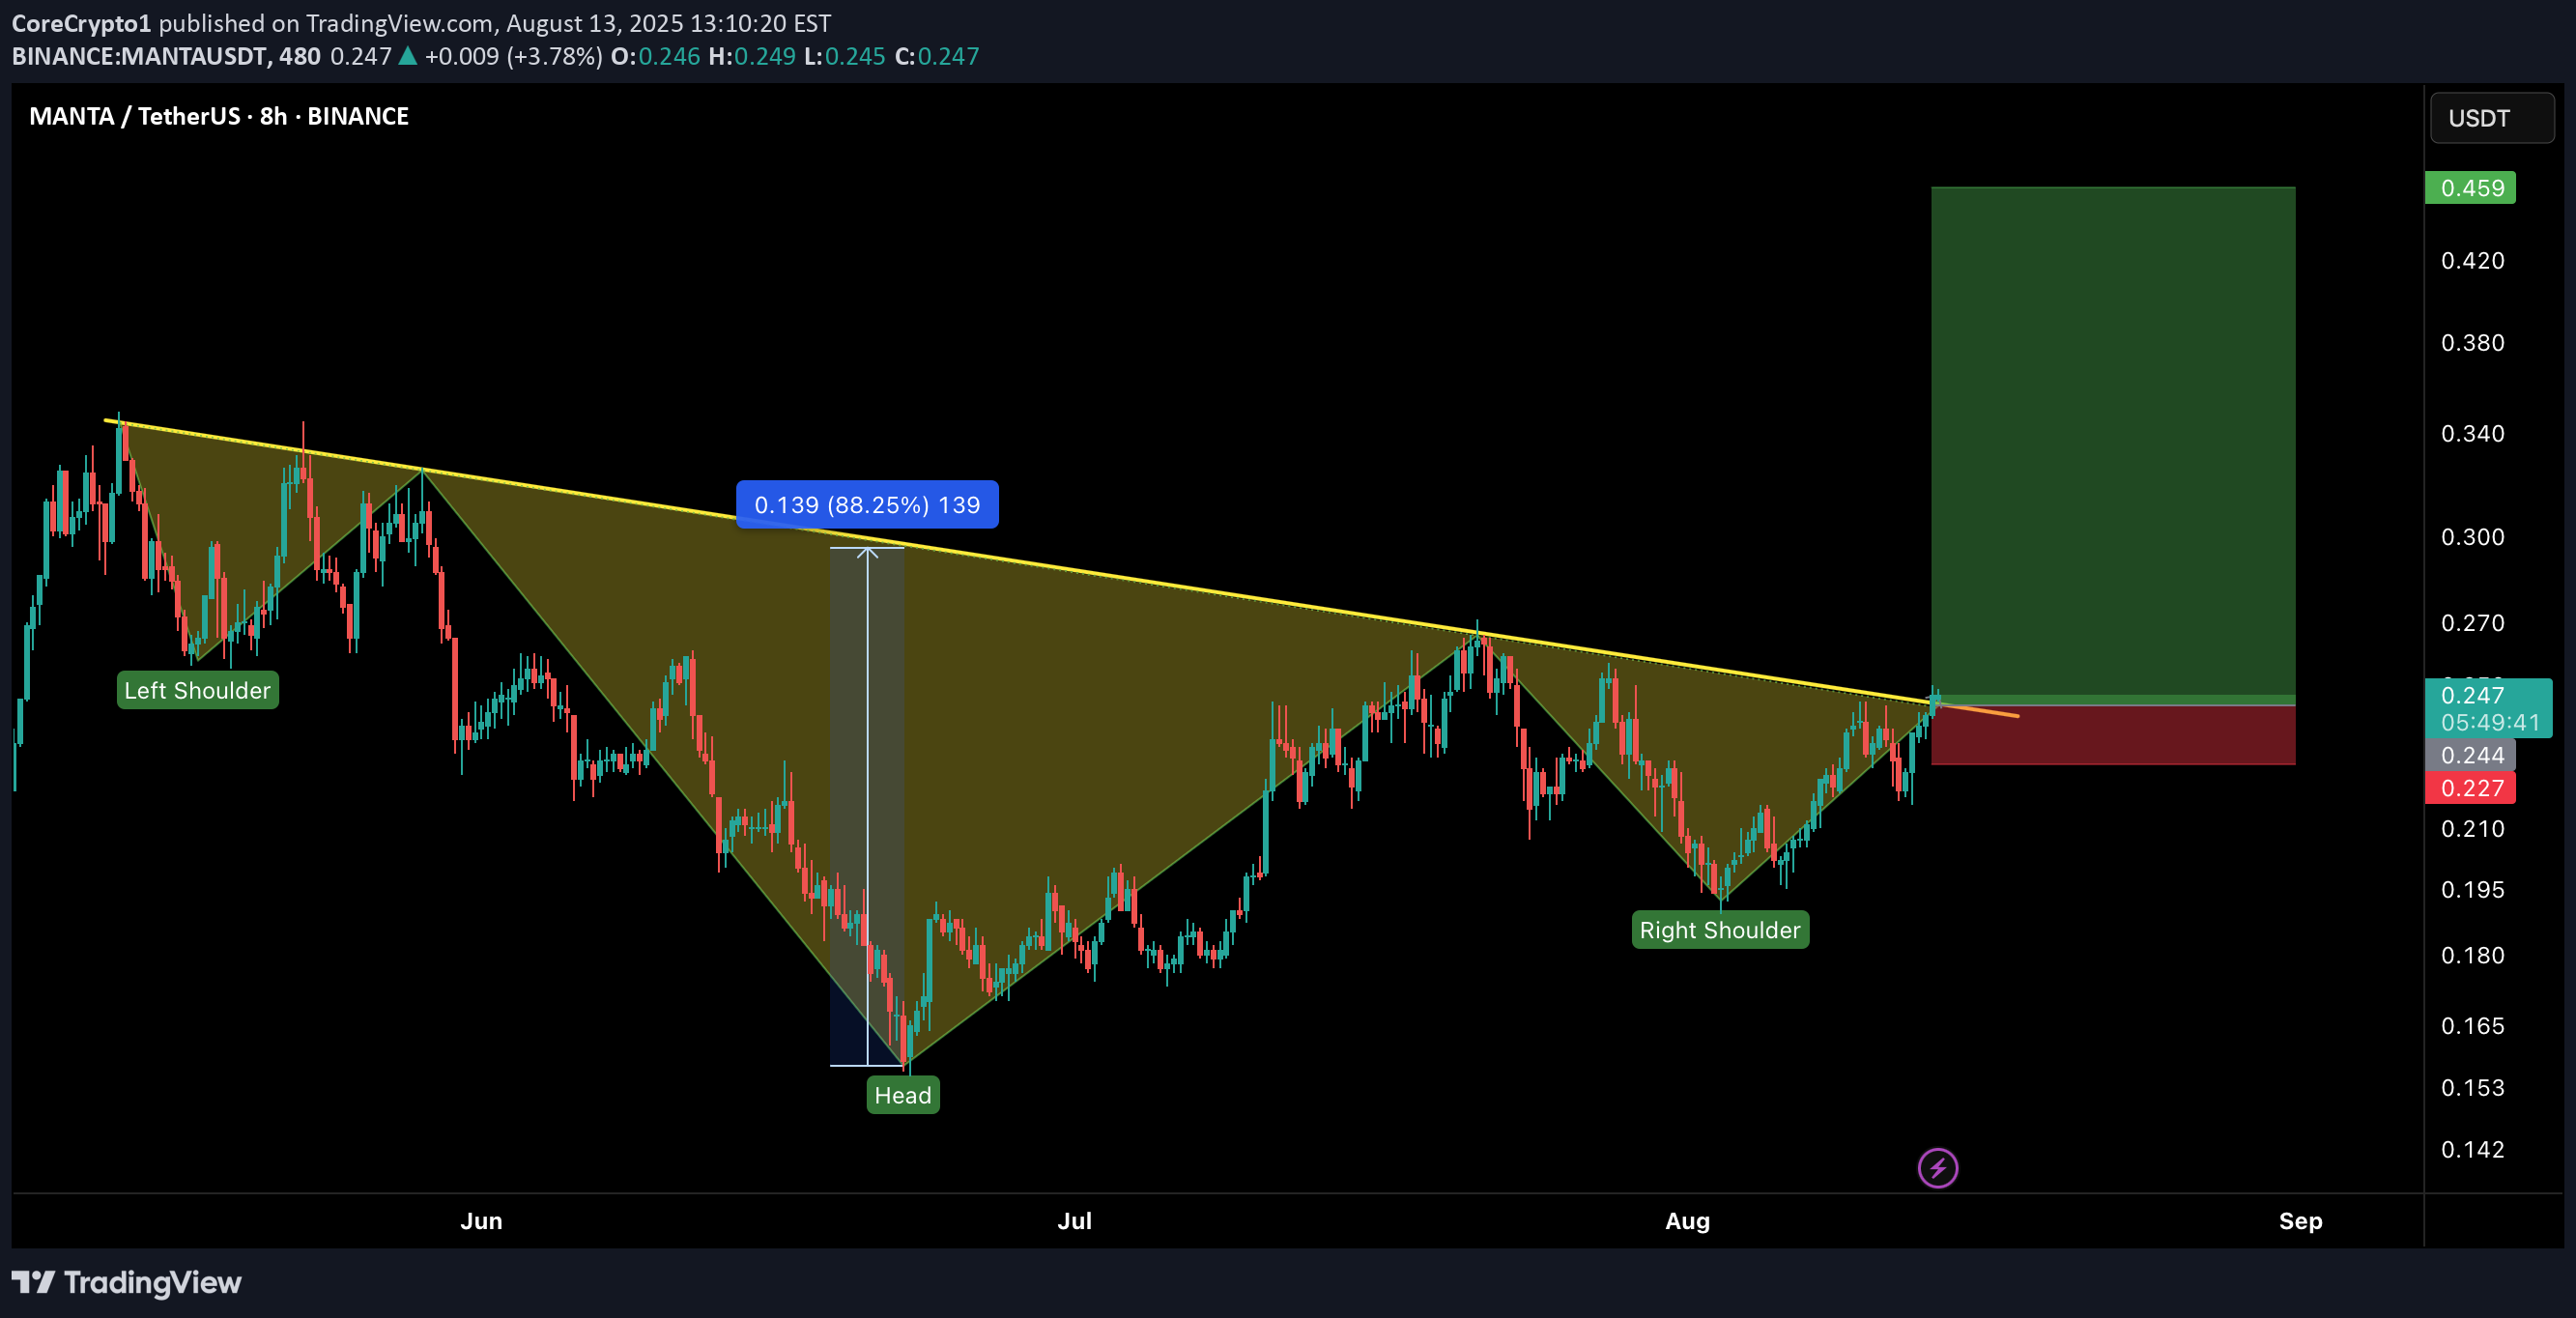
MANTA has just broken out of a massive Inverse Head & Shoulders pattern on the 8H chart — a bullish reversal signal that could ignite a strong upside rally. 📈 Setup Details: Entry: CMP – 0.248 Stop Loss: 0.227 (below neckline retest) Targets: 🎯 TP1: 0.34 🎯 TP2: 0.42 🎯 TP3: 0.459 Leverage: 5x max (adjust risk accordingly) Why This Setup? ✅ Clean breakout above neckline after weeks of consolidation ✅ Volume supporting the breakout ✅ Pattern target aligns with strong resistance zone above ⚠️ Risk Management: Stick to your SL. A failed retest can trap late entries. Bulls are in control — let’s ride this momentum!

CryptoAnalystSignal

#MANTA The price is moving within a descending channel on the 1-hour frame and is expected to break and continue upward. We have a trend to stabilize above the 100 moving average once again. We have a downtrend on the RSI indicator that supports the upward break. We have a support area at the lower boundary of the channel at 0.190, acting as strong support from which the price can rebound. We have a major support area in green that pushed the price upward at 0.186. Entry price: 0.196 First target: 0.205 Second target: 0.214 Third target: 0.225 To manage risk, don't forget stop loss and capital management. When you reach the first target, save some profits and then change the stop order to an entry order. For inquiries, please comment. Thank you.#MANTA First target: 0.205 Reached Second target: 0.214 Reached Third target: 0.225 Reached

Bithereum_io

#MANTA has broken above the descending resistance on the daily chart, and the retest has been successfully completed. It is now facing the daily SMA100. In case of a breakout above it, the targets are: 🎯 $0.269 🎯 $0.338 🎯 $0.393 🎯 $0.448 🎯 $0.527 🎯 $0.628 ⚠️ As always, use a tight stop-loss and apply proper risk management.

Captain-MAO

has been in a downtrend for near 500 days, but the last 100 days show clear signs of reversal. Price has been ranging between the $0.15–$0.30 zone, indicating accumulation. Now it appears to be gearing up for a trend reversal, with the first breakout leg likely to lead into a much bigger move.

ScramblerG
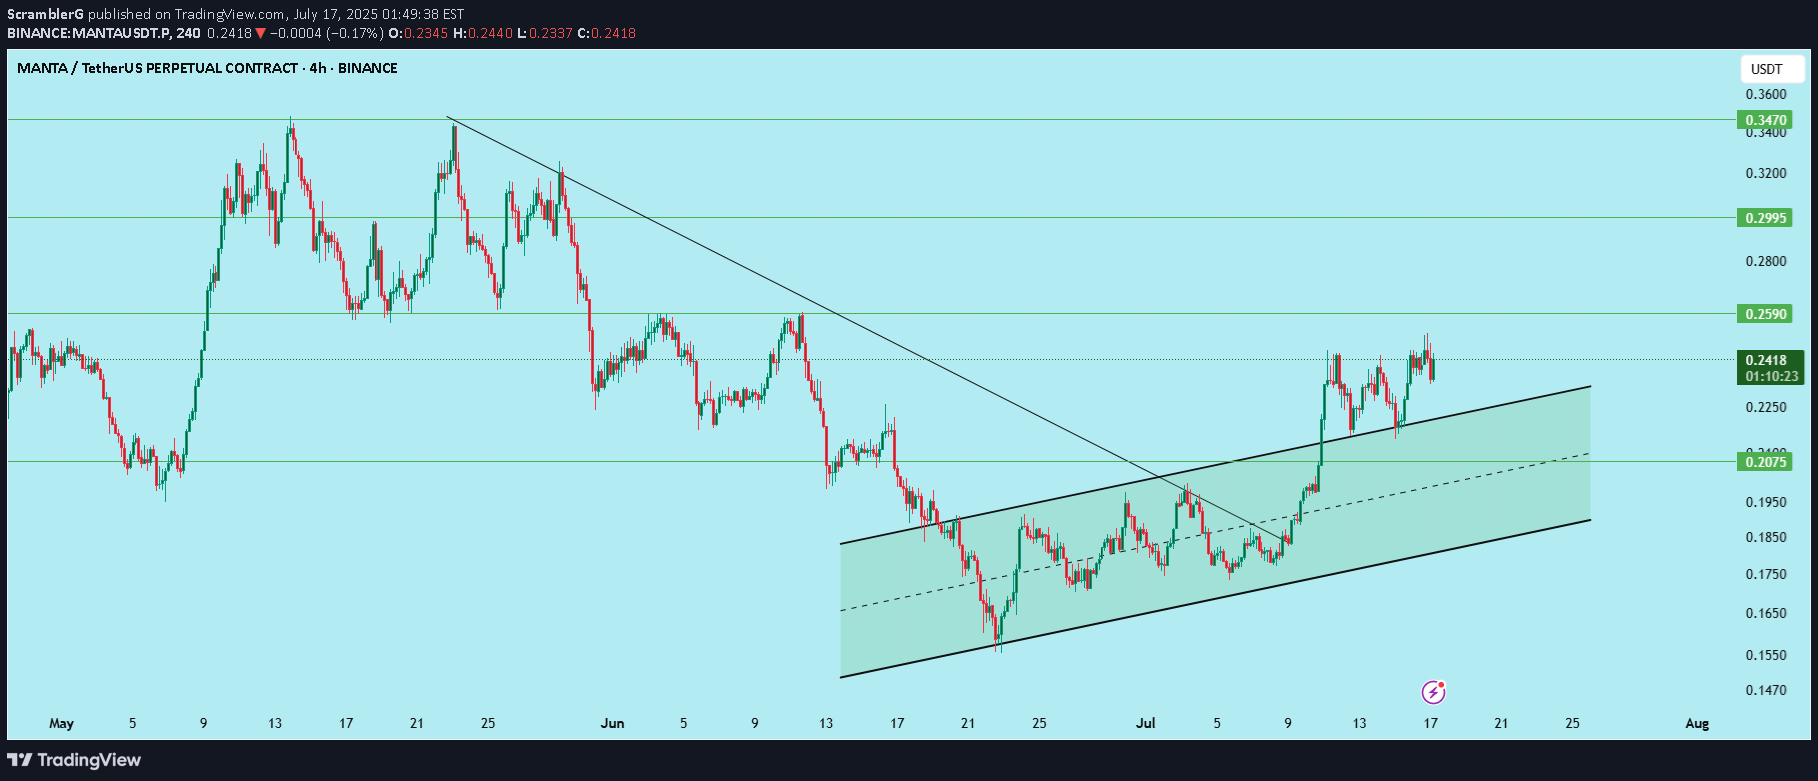
MANTA has broken out of its long-term downtrend and is now trading within a clear rising parallel channel on the 4H chart. Structure: Downtrend broken Higher highs and higher lows forming Price respecting channel boundaries Setup: Entry: 0.225 (wait for retest) Stop Loss: 0.2075 Target 1: 0.259 Target 2: 0.2995 Target 3: 0.347 Support: 0.225 / 0.2075 Resistance: 0.259 / 0.2995 Wait for the retest before entering. Risk-reward is attractive if the structure holds. DYOR. Not financial advice.
Disclaimer
Any content and materials included in Sahmeto's website and official communication channels are a compilation of personal opinions and analyses and are not binding. They do not constitute any recommendation for buying, selling, entering or exiting the stock market and cryptocurrency market. Also, all news and analyses included in the website and channels are merely republished information from official and unofficial domestic and foreign sources, and it is obvious that users of the said content are responsible for following up and ensuring the authenticity and accuracy of the materials. Therefore, while disclaiming responsibility, it is declared that the responsibility for any decision-making, action, and potential profit and loss in the capital market and cryptocurrency market lies with the trader.