
ScramblerG
@t_ScramblerG

What symbols does the trader recommend buying?
Purchase History
پیام های تریدر
Filter
ScramblerG
BTC & Altcoin Market Update – Correction Insights
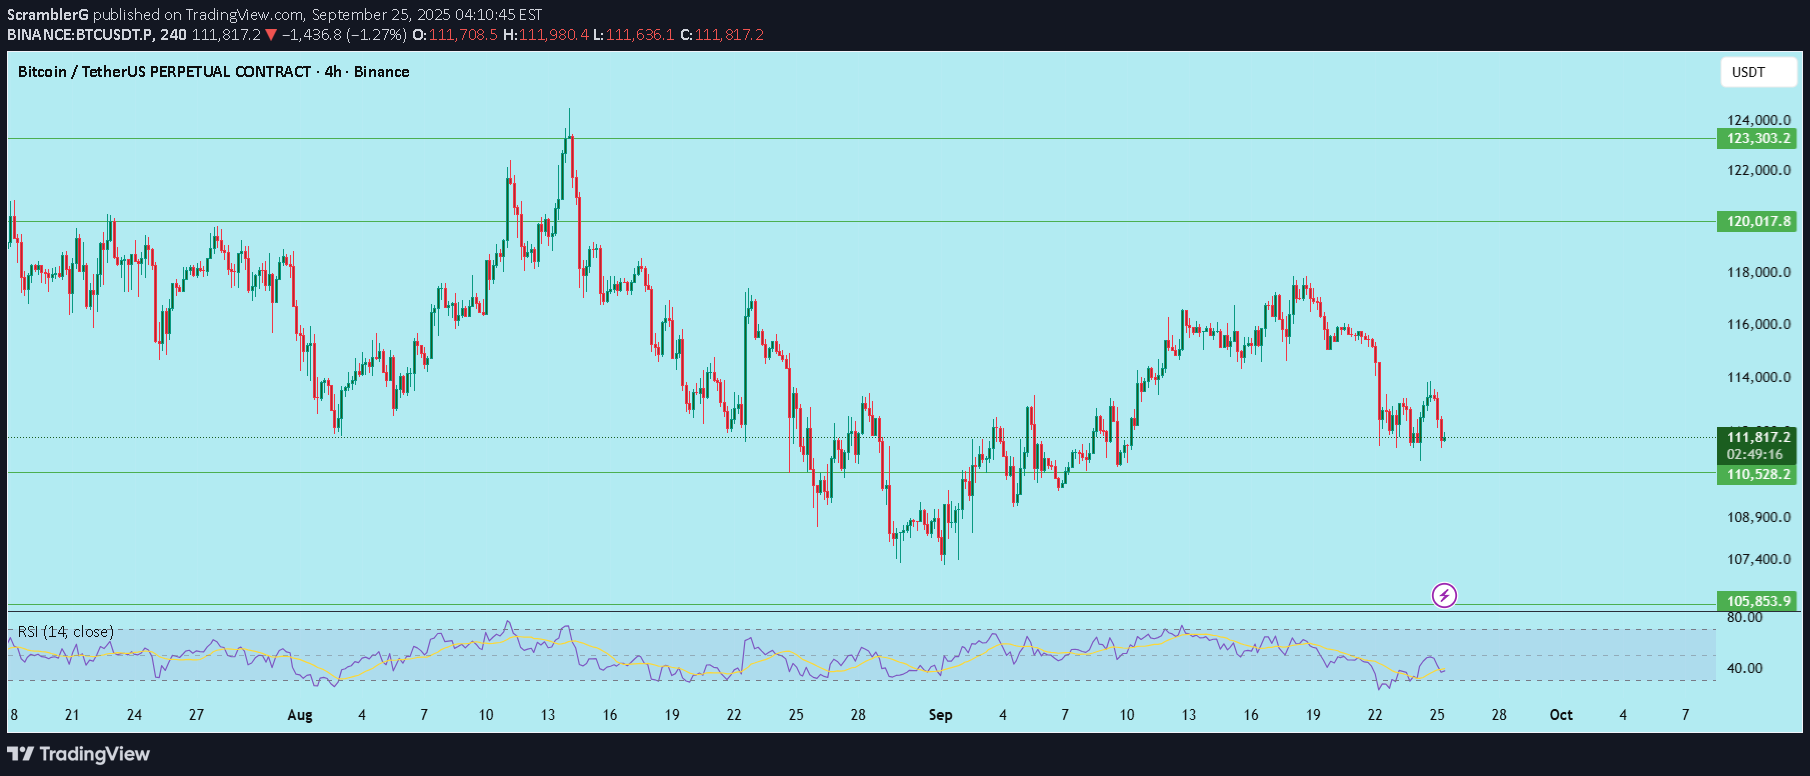
Over the past 48 hours, the crypto market has faced a significant pullback, with BTC retracing sharply and altcoins following suit. Let’s break down the drivers and what to watch next. Key Reasons for the Dump Massive Long Liquidations More than $1.5B in leveraged long positions were wiped out, triggering cascading liquidations across exchanges. This accelerated the sell-off. Overheated Leverage Following the optimism around Fed rate cuts and broader risk-on sentiment, traders piled into high-leverage longs. This left the market vulnerable to sharp corrections. Macro Uncertainty Sticky inflation data and renewed interest rate expectations brought caution back to risk assets. This spilled over to crypto, pressuring sentiment. BTC Dominance Rising As BTC corrected, altcoins bled harder, reflecting capital rotation away from weaker projects. BTC dominance climbing highlights risk-off conditions in alts. Technical Breakdown BTC lost key short-term supports, accelerating selling pressure and triggering panic among retail participants. Chart & Technical Outlook BTC currently sits near the 111K–112K spot support zone, which aligns with a prior demand area. RSI has cooled down from overbought levels, signaling a possible reset. Altcoins remain under pressure, with many trading at or below critical daily supports. A decisive reclaim of 115K on BTC could reignite bullish momentum, while a breakdown below 111K exposes 108K and below. Takeaways Corrections like these are part of a healthy market cycle, especially after extended rallies. Leverage flushes often provide a reset for sustainable upside. For now, caution is warranted until BTC confirms support holding. DYOR | Not Financial Advice
ScramblerG
WLD/USDT — Bullish triangle breakout (1H)
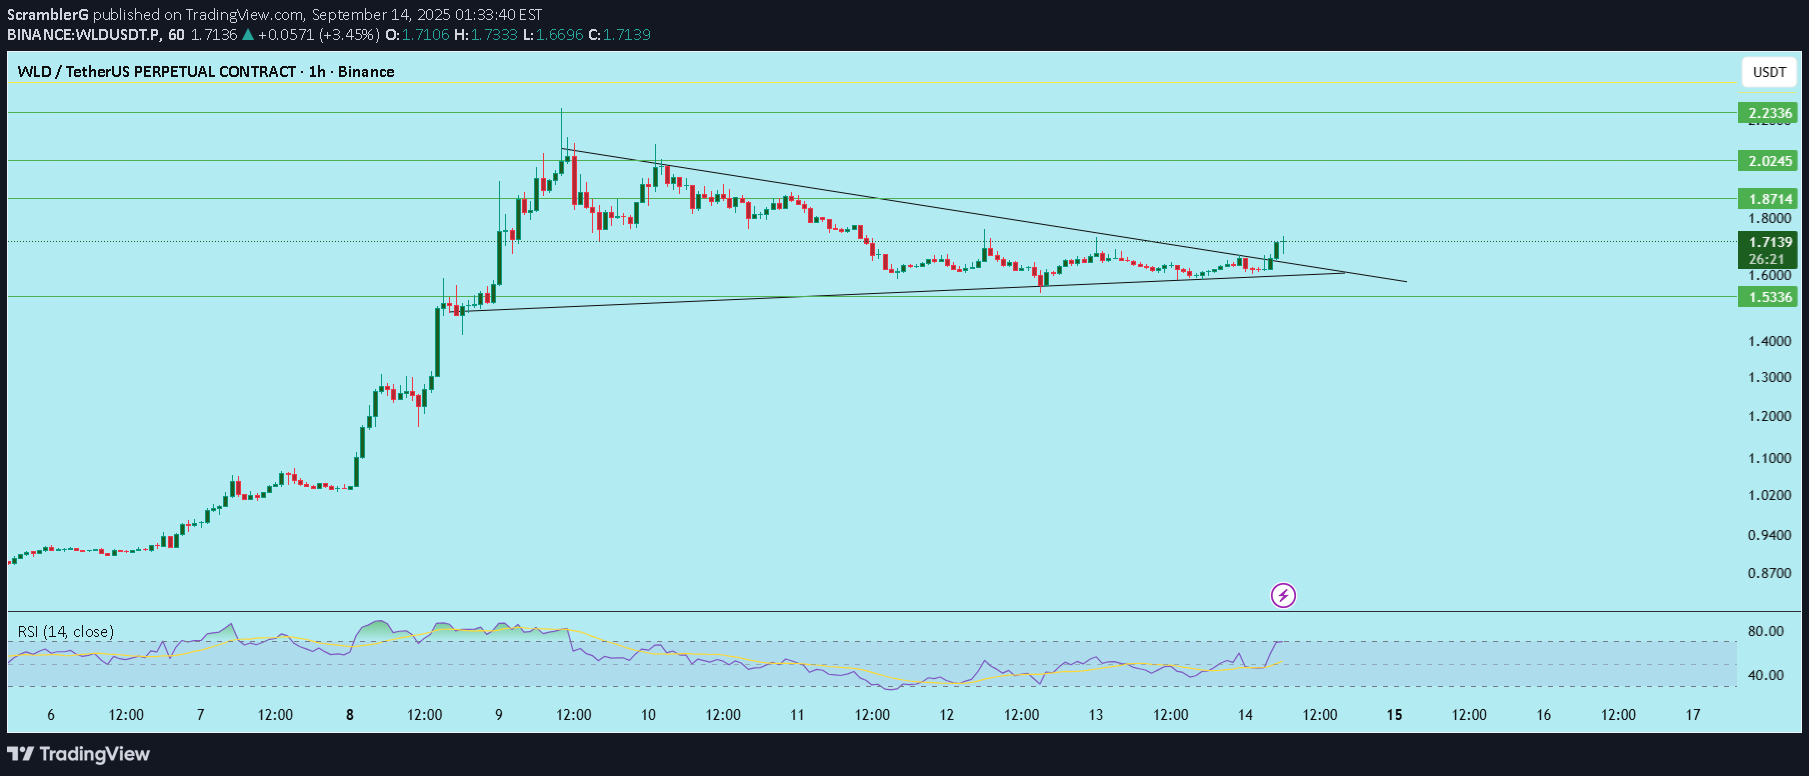
WLD formed a symmetrical triangle after a sharp advance. The price has broken above the triangle’s descending trendline with bullish follow-through candles. Buyers have been defending the rising lower trendline, and RSI has recovered from mid-range to ~59 — momentum is building but not overbought. Key observations Pattern: Symmetrical triangle → breakout to the upside on the hourly chart. Candles: Breakout candle followed by bullish follow-through; watch for a clean retest of the breakout trendline as confirmation. Momentum: RSI ~59 (room to run). Support: 1.53 (strong demand area and triangle base). Immediate resistance cluster: 1.87 → 2.02 → 2.23. Trade plan (if you choose to take it) Entry: 1.65 – 1.70 Stop loss: 1.53 (invalidation of triangle breakout) Targets: T1: 1.87 — Expected profit ≈ 10.00% – 13.33% (entry 1.70 → 1.65). T2: 2.02 — Expected profit ≈ 18.82% – 22.42%. T3: 2.23 — Expected profit ≈ 31.18% – 35.15%. Risk if stopped: loss ≈ 7.27% – 10.00% (depending on entry within the range). Risk notes / invalidation Loss of 1.53 would invalidate the breakout and likely push price back to lower supports; treat 1.53 as the key invalidation level. Ideal confirmation: retest of breakout trendline with clean rejection and/or volume confirmation. Not Financial Advice | DYOR !!
ScramblerG
CRO/USDT – LONG, MAYBE a new HIGH in LINE !!
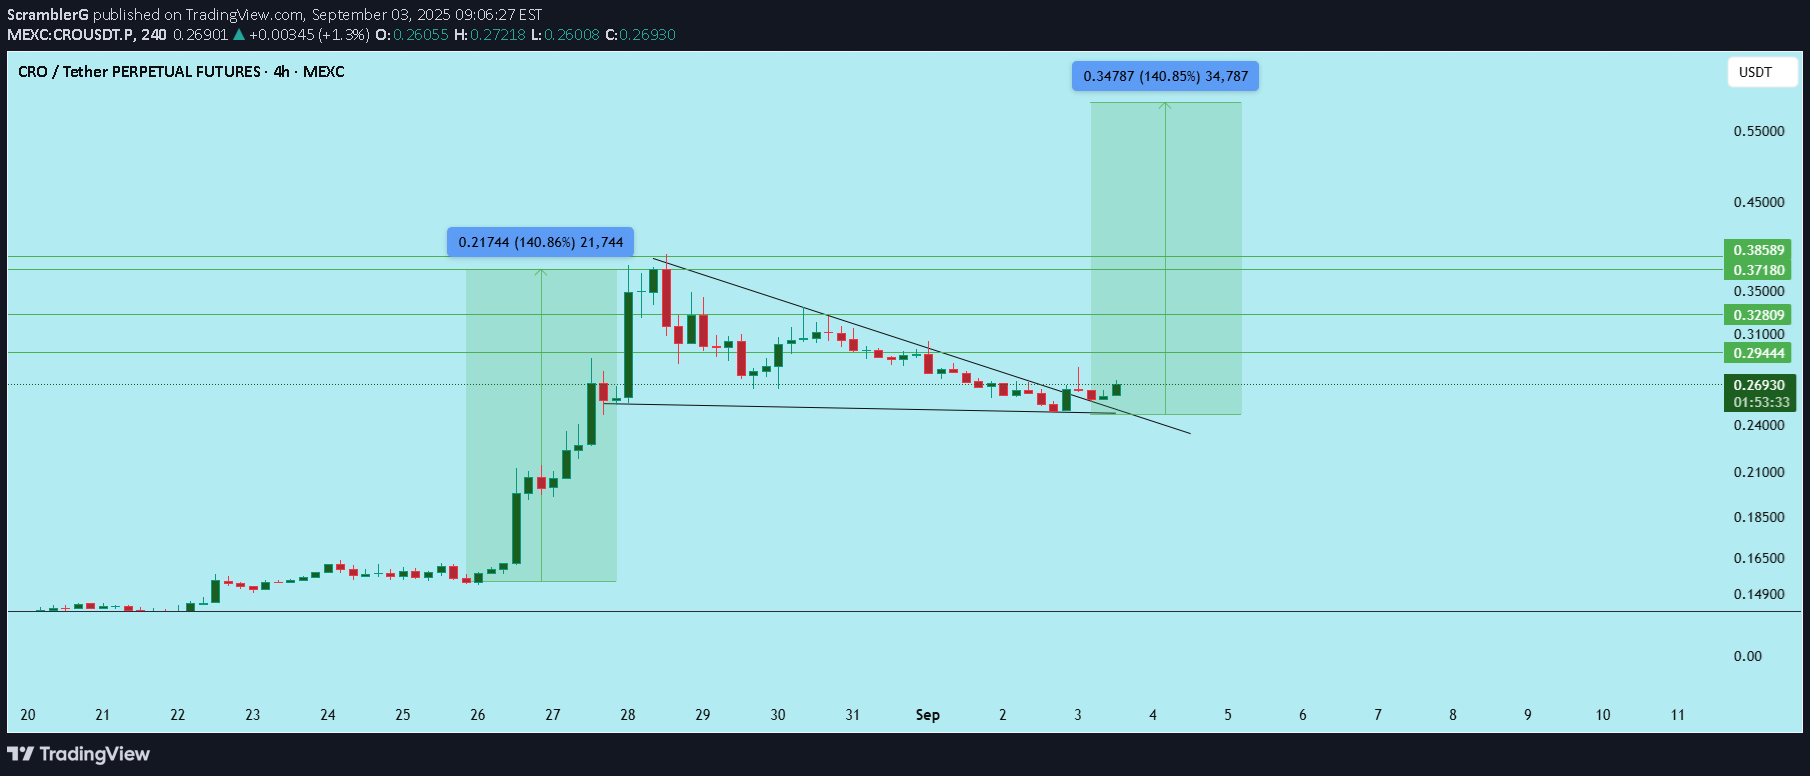
CRO has broken out of a descending wedge pattern on the 4H chart after several weeks of consolidation. Historically, this setup often signals the end of a corrective phase and the beginning of a bullish continuation. Key observations: The breakout candle closed above the wedge trendline with increasing momentum. Price is reclaiming the 0.260–0.270 support zone, which was previously resistance. Strong bullish engulfing candle adds confirmation of demand stepping in. If momentum sustains, CRO could target the upper resistance cluster near 0.328 – 0.385. Entry zone: 0.260 – 0.270 Stop loss: Below 0.240 Targets: T1: 0.294 T2: 0.310 T3: 0.328 Extended: 0.371 – 0.386 Insights: Holding above 0.265–0.270 is critical. Failure to hold could drag price back toward 0.245 before any continuation. DYOR | Not Financial Advice
ScramblerG
OP/USDT Accumulation in Progress !!

Currently, OP is testing the descending trendline while holding above the demand zone at 0.6860–0.6721. RSI sits near neutral (49), suggesting that the next move could determine whether the breakout occurs or further downside is seen. Trade Plan (Long Setup): Entry Zone: CMP (0.7050) → down to 0.6860 Stop Loss: 0.6721 (below demand zone) Targets: 0.7240 0.7407 0.7663 0.8229 Expected Profit: ~16% to the extended target Insights: Break above 0.7240 confirms bullish continuation. Losing 0.6721 invalidates the setup, opening downside risk. RSI divergence is possible if the price retests 0.6860 and bounces strongly. DYOR | Not Financial Advice
ScramblerG
XRP/USDT – Breakdown & Retest

XRP recently broke below its key trendline and has now retested the level, showing rejection — a strong bearish continuation signal. Structure Breakdown of the ascending trendline Retest rejection confirms selling pressure Supports stacked below at key levels Trade Plan Entry: After rejection near the trendline retest Stop Loss: Above broken trendline Targets: 0.3540 → 0.3422 → 0.3310 → 0.3240 Bias Bearish unless XRP reclaims the trendline with a strong close. If reclaimed, the short setup is invalid. Trading Insight This is a classic breakdown + retest setup, often signaling continuation to lower support zones. Manage risk with SL. DYOR | Not Financial Advice
ScramblerG
Bitcoin (BTC/USDT) – 4H Chart Update !!

Bitcoin (BTC/USDT) – 4H Chart Update BTC is trading near $110,000 and respecting a descending trendline. The price is currently consolidating near support with RSI around 40, showing slight weakness. Immediate Support → $109,456 Long-term Support → $98,376 Immediate Resistance → $112,935 Long-term Resistance → $122,879 Possible Scenarios: Bullish Case (Long Setup): A breakout above $112,935 could open doors to $116,818 → $120,001 → $122,879. Long entry valid above breakout confirmation, SL below $109,456. Bearish Case (Short Setup): Failure to hold $109,456 could drag price down to $105,189 → $102,154 → $98,376. Short entry valid below $109,456, SL above $112,935. The market is at a critical decision zone – waiting for a breakout/rejection will give clearer direction. DYOR | Not Financial Advice
ScramblerG
LDO/USDT – Key Support Retest & Possible Reversal Setup
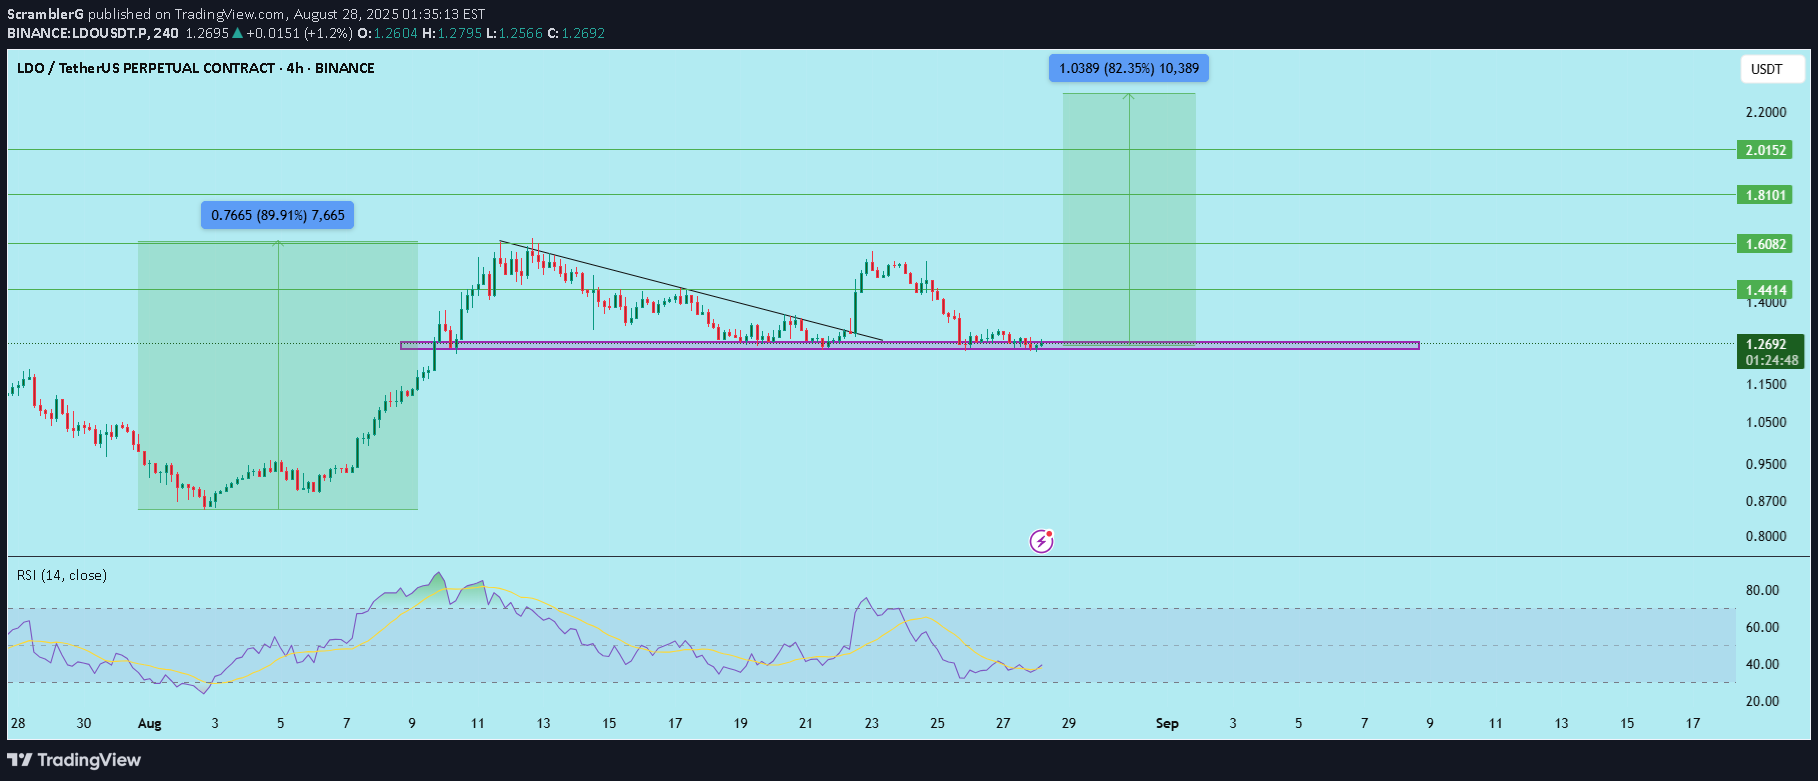
LDO has come back to retest the 1.25–1.27 demand zone, which acted as a strong support level in the past. This zone has historically triggered bullish momentum whenever defended successfully. Analysis & Structure Price recently retraced from its highs and is now testing the previous accumulation zone. Buyers seem to be defending the 1.25–1.27 support (purple rectangle). If this support holds, LDO could bounce towards higher resistance levels. A breakdown below 1.25, however, would invalidate this setup and open the path to further downside. Trade Plan Entry Zone: 1.25–1.27 (support retest) Stop Loss: Below 1.25 (invalidates the bullish structure) Targets: 1.44, 1.60, 1.81, 2.01 Trading Insight This is a risk-reward favorable setup if the support zone holds. Patience is key here – confirmation on higher timeframes is recommended before entering. DYOR | Not Financial Advice
ScramblerG
ETH/USDT Bearish Setup – Rising Wedge Breakdown & Retest

Ethereum (ETH/USDT) has broken down from a rising wedge — a classic bearish pattern — and is now showing signs of rejection after a clean retest of the broken trendline around $3,679. Structure: Rising wedge pattern on the higher timeframe Breakdown confirmed with retest of lower trendline as resistance No bullish follow-through after retest Trade Plan: Bias: Bearish below $3,680 Entry Zone: Anywhere below $3,670–3,680 if rejection is confirmed Stop Loss: Above $3,720 (invalidation) Targets: Target 1: $3,298 Target 2: $2,880 Target 3: $2,640 Key Notes: If ETH reclaims and holds above $3,680, the setup gets invalidated Watch BTC behavior — ETH tends to follow Volume shows no strength from bulls post-breakdown This setup presents a high-risk, high-reward opportunity if the price continues to decline from this zone. Conclusion: Stay cautious, as the market could see more downside if ETH stays below $3,680. Manage risk accordingly. DYOR | Not Financial Advice
ScramblerG
BCHUSDT : Potential Long Setup – Trendline Support Falling Wedge

BCH has been trading in a well-defined ascending channel on the 4H chart. After multiple higher highs and higher lows, price recently corrected to the channel support and formed a falling wedge — a bullish reversal pattern. Current Price: ~$528 Entry Zone: $520–$540 Stop Loss: Below $495 (clean invalidation below channel support) Targets: TP1: $560 TP2: $590 TP3: $605 TP4: $646 TP5: $693 Potential Upside: +32% from entry zone Analysis: The falling wedge breakout near channel support confirms buyer interest. Volume drop during the correction phase supports bullish reversal conditions. Risk-reward ratio favorable near the channel low. Trade Plan: Start building position between $520–$540 using DCA. Keep SL below $495. Expect gradual move toward the upper resistance zones if the breakout sustains. Watch for breakout confirmation above $540–$550 for momentum entry. DYOR | Not Financial Advice
ScramblerG
#XRP/USDT – Breakout from Downward Channel | Bullish Outlook

XRP has finally broken out of the long-standing downward parallel channel on the 4H chart — a strong bullish signal supported by volume and structure shift. Falling Channel Structure: XRP had been consolidating within a well-defined descending channel since late 2024. This structure capped price advances and formed a strong resistance ceiling. Breakout Confirmation: Recent price action cleanly broke above the upper trendline with volume expansion, followed by a classic retest of the breakout zone near 2.53, confirming the breakout is valid and not a fakeout. Volume Analysis: Breakout was supported by a noticeable increase in buying volume. The retest phase is happening on reduced volume, which is typical for a healthy bullish structure. Support Zones: 2.53 – Key breakout level and current support 1.87 – Mid-channel level, strong previous base 0.638 – Long-term demand zone (unlikely to revisit unless severe macro breakdown) Resistance Levels / Targets: 3.64 – Local resistance, recent swing high 4.29 – Major horizontal resistance Further upside open if macro trend remains bullish Setup Summary: Structure: Falling Channel → Breakout → Retest Entry Zone: Between 2.53 and CMP (~2.83) using DCA Stop Loss: Below 2.38 to protect against fakeouts Targets: TP1: 3.64 TP2: 4.29 Long-Term Open Why This Matters: XRP breaking out of a 9-month downtrend indicates a major sentiment shift. Similar breakouts in the past have led to 600%+ moves, and current structure resembles that setup. Macro trend shows buyers stepping in with conviction. DYOR | Not Financial Advice
Disclaimer
Any content and materials included in Sahmeto's website and official communication channels are a compilation of personal opinions and analyses and are not binding. They do not constitute any recommendation for buying, selling, entering or exiting the stock market and cryptocurrency market. Also, all news and analyses included in the website and channels are merely republished information from official and unofficial domestic and foreign sources, and it is obvious that users of the said content are responsible for following up and ensuring the authenticity and accuracy of the materials. Therefore, while disclaiming responsibility, it is declared that the responsibility for any decision-making, action, and potential profit and loss in the capital market and cryptocurrency market lies with the trader.