
HexaTrades
@t_HexaTrades

What symbols does the trader recommend buying?
Purchase History
پیام های تریدر
Filter
HexaTrades
هشدار بزرگ بیت کوین: آیا الگوی سر و شانه، سقوط بزرگ بعدی را رقم میزند؟
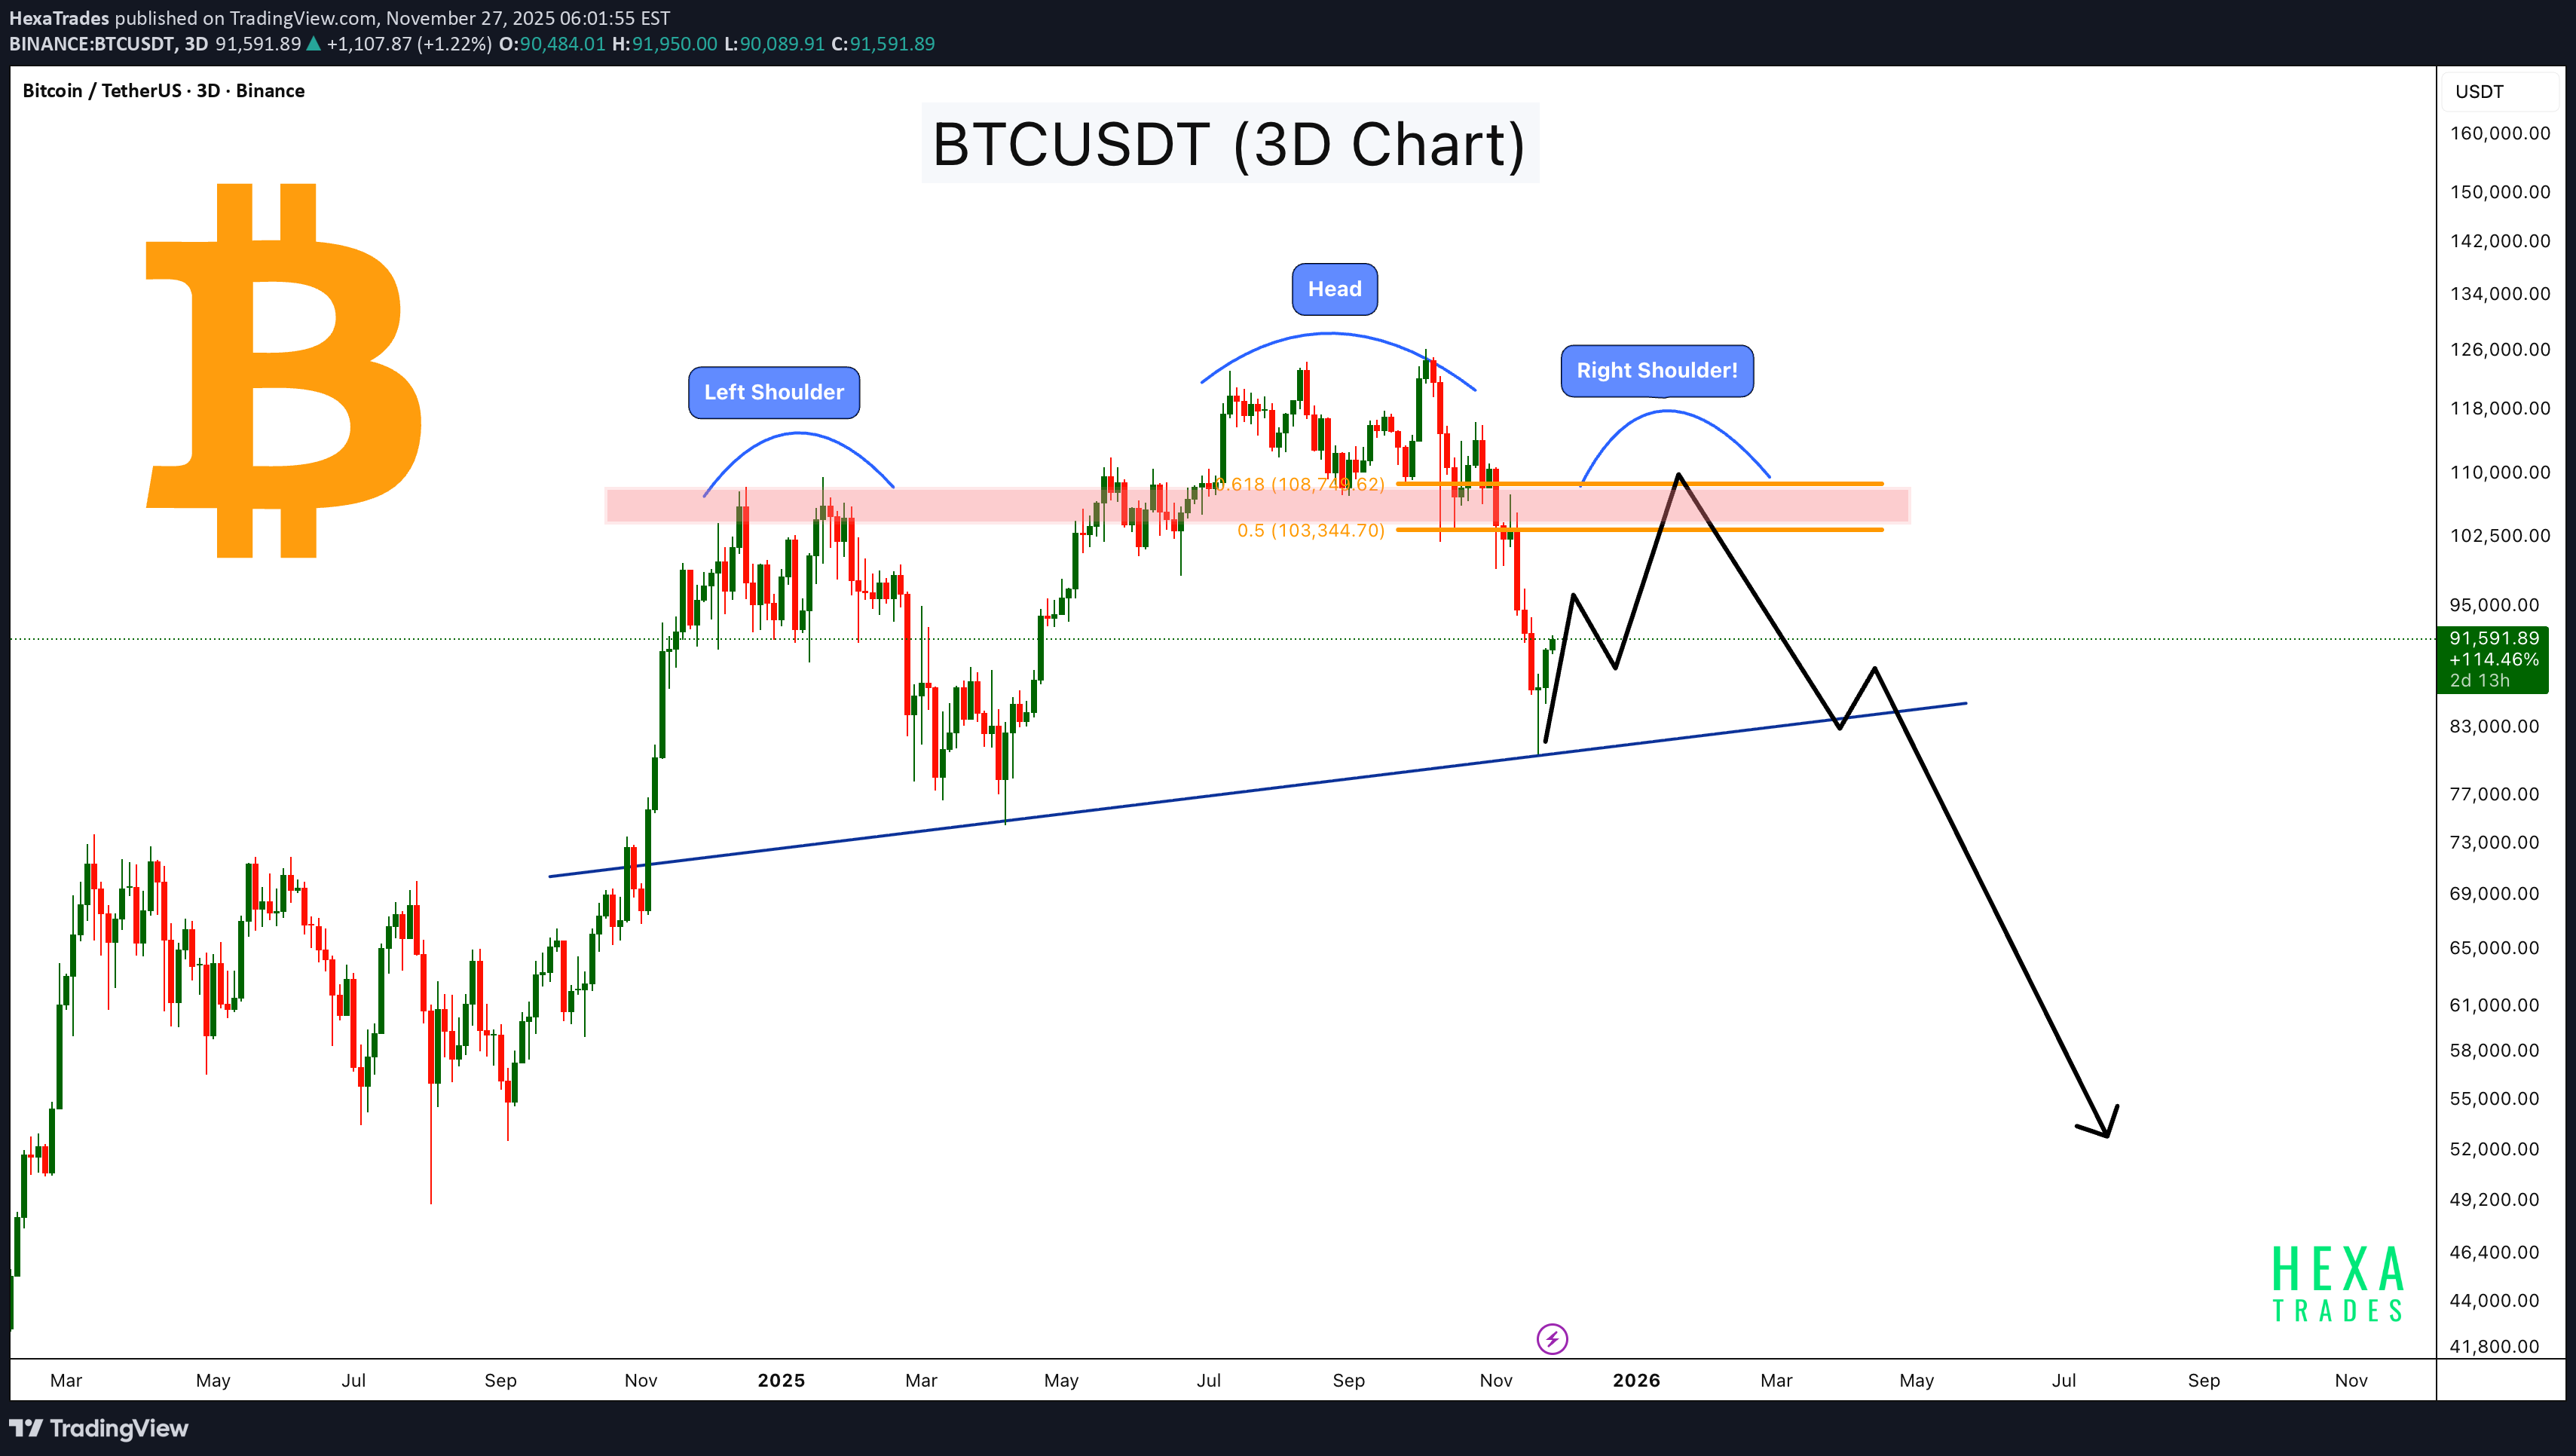
Bitcoin is forming a large Head & Shoulders pattern on the 3-day chart, with the left shoulder and head already completed, and the right shoulder now developing within the major resistance zone around the 0.5–0.618 retracement (103,000–108,000). Price recently bounced from the long-term ascending trendline, but the overall structure still suggests a potential macro reversal unless Bitcoin breaks above the resistance zone with strong momentum. If the right shoulder completes and price rejects from the supply zone, BTC could retest the trendline again. A breakdown of this trendline may open the door for a deeper correction toward the lower demand zones. This is a medium-term pattern and may take 1–3 months to validate fully. Key Points: - Left Shoulder, Head, and Right Shoulder zone highlighted - Major resistance at $103,000–$108,000 - Price bouncing from long-term ascending trendline - Breakdown below the trendline may trigger a strong downside move - Right shoulder formation may take a few more weeks Cheers Hexa
HexaTrades
اتریوم در آستانه انفجار؟ سیگنالهای حیاتی برای بازگشت بزرگ!
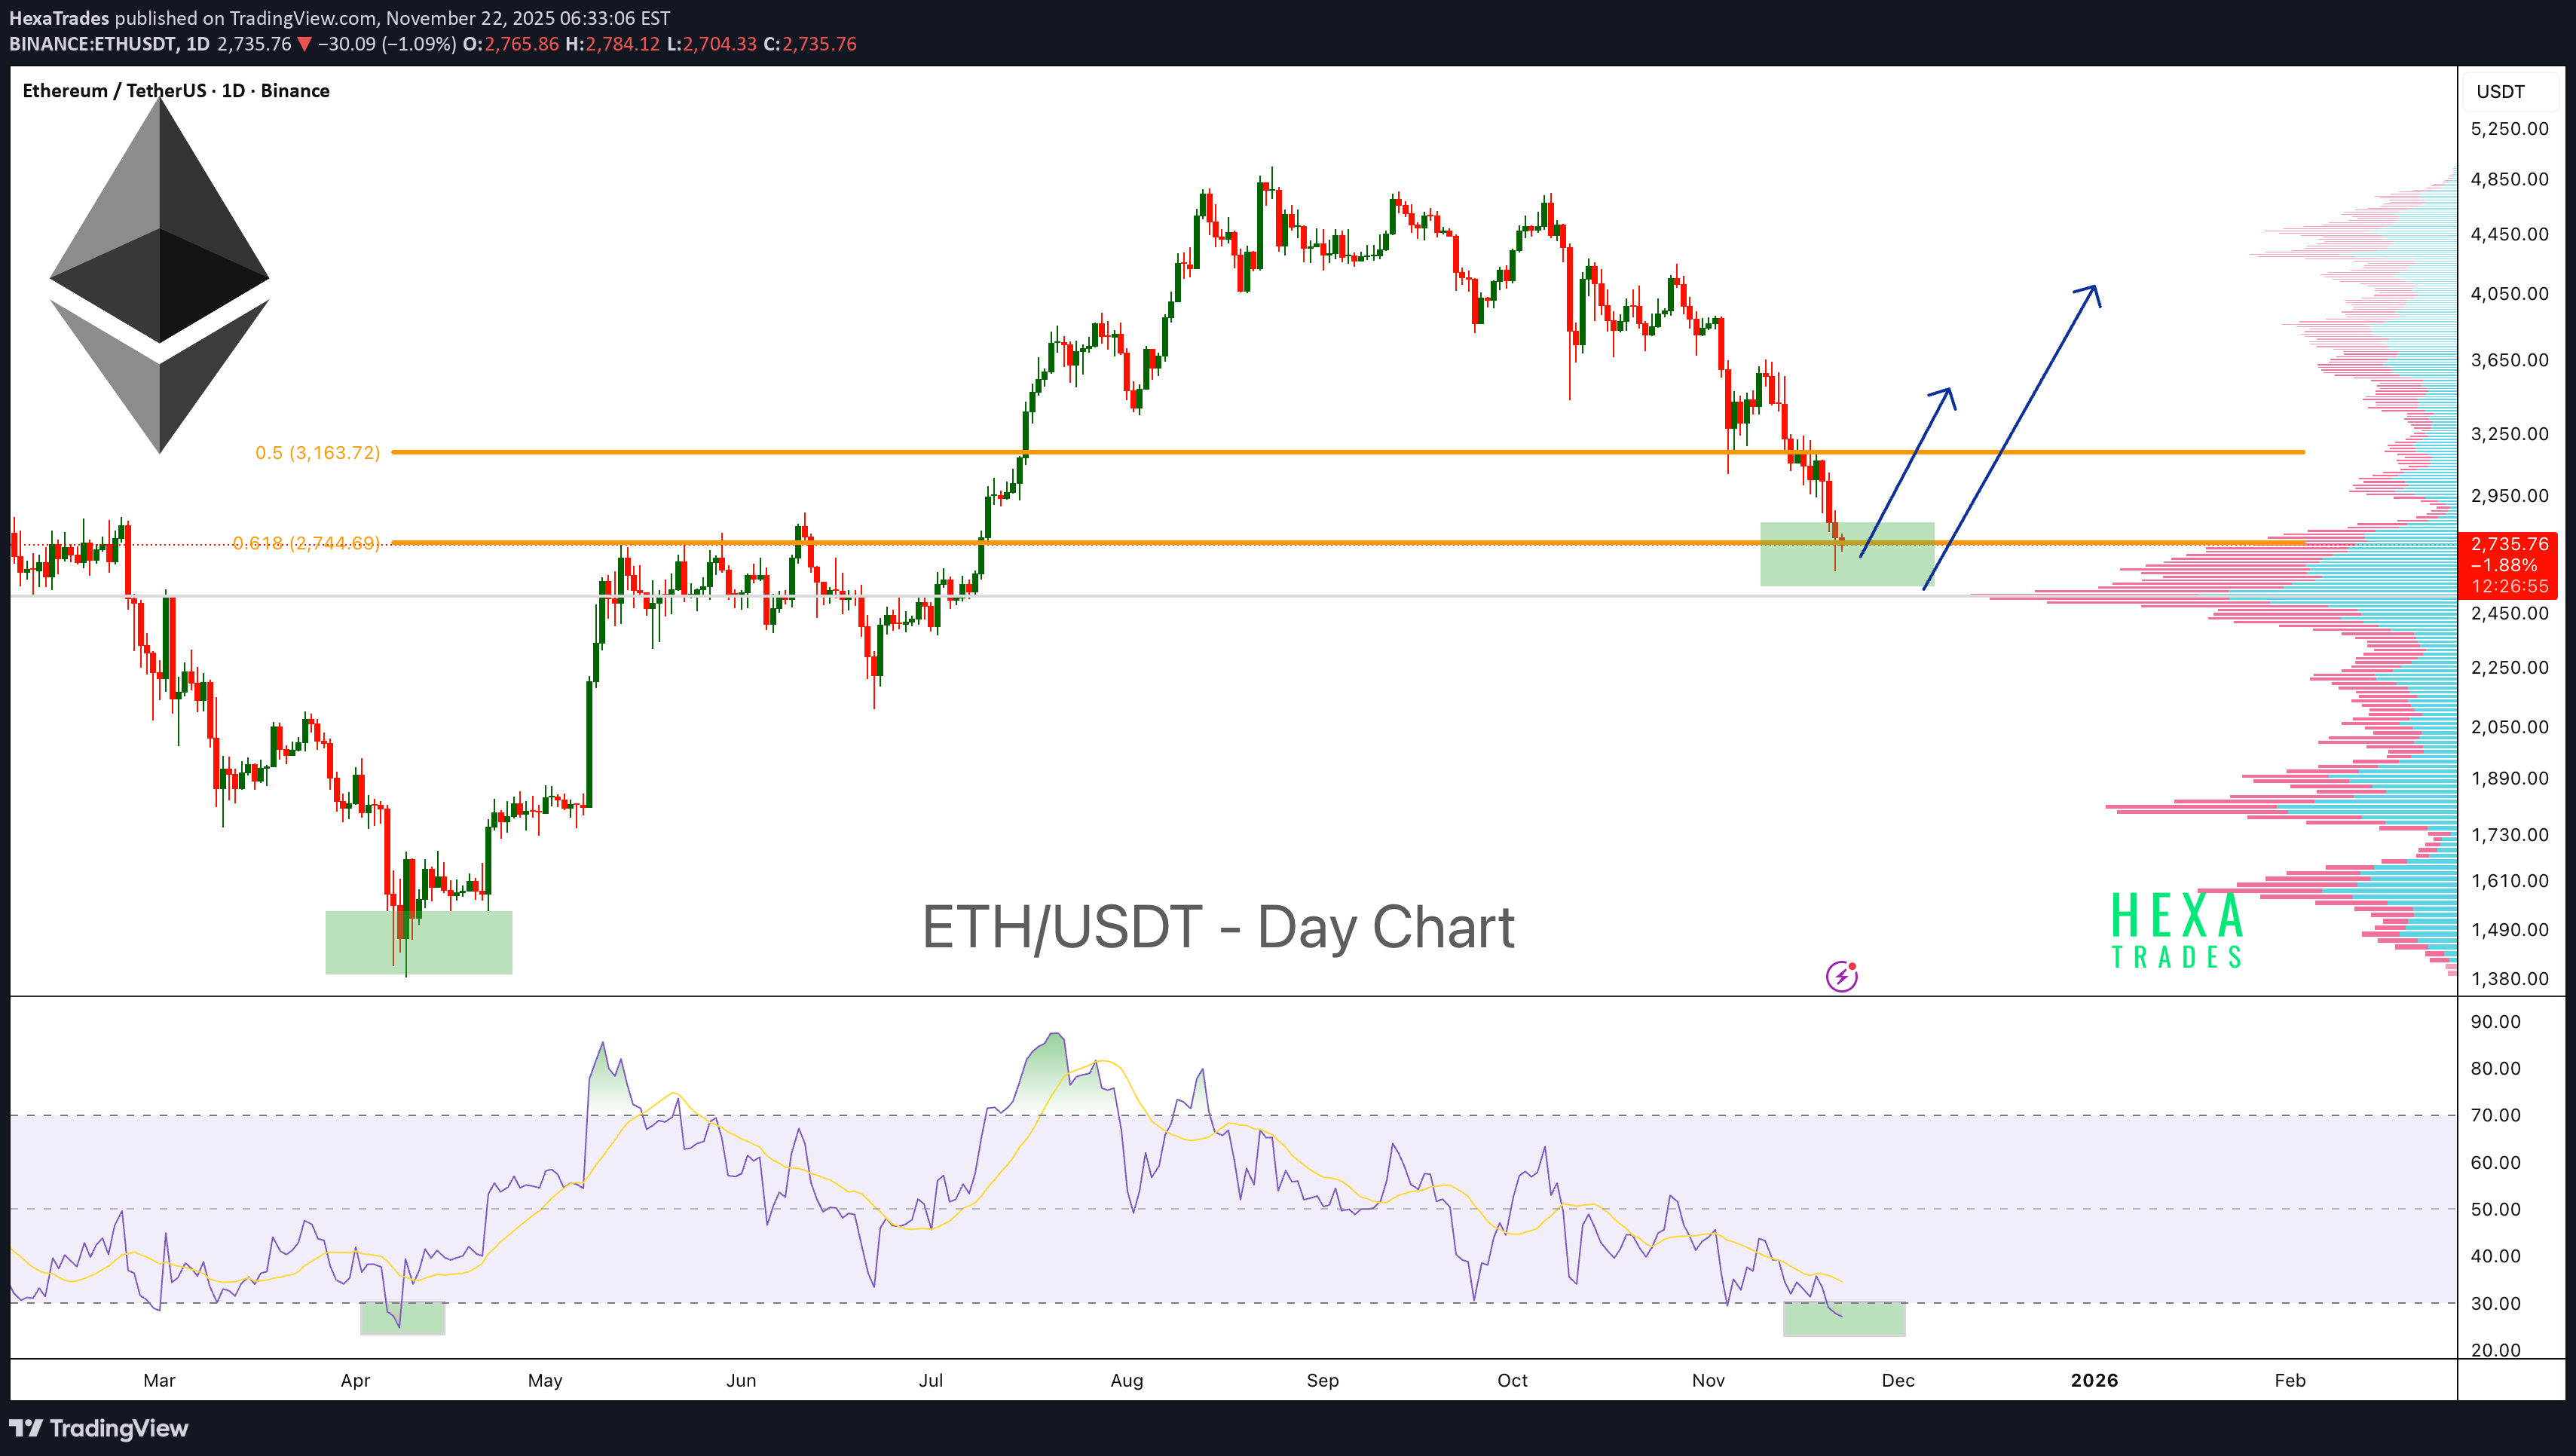
Ethereum is currently trading at a major support zone, an area where price has historically shown strong reactions and multiple bounces. This demand zone has acted as a key reversal region several times, and ETH is once again testing it. Price is also sitting near the 0.618 Fibonacci retracement (Golden Zone), which is commonly used to identify potential reversal points during market corrections. The Volume Profile shows a high-volume node exactly at the current support area, indicating strong interest and previous accumulation. This increases the probability that this zone will act as a strong support. On the momentum side, the RSI has entered oversold territory once again. Historically, whenever ETH’s daily RSI dipped below 30, it marked strong bottom areas followed by significant bounces. Key Highlights - ETH retesting a major historical support zone. - Trading inside the 0.618 Fibonacci Golden Zone. - Daily RSI oversold (<30) — historically a strong bounce region. - Volume Profile high-volume node aligns with support, increasing the strength of the zone. - Potential for a short-term reversal if the support continues to hold. Cheers Hexa
HexaTrades
هشدار جدی برای بیت کوین: آیا اصلاح قیمتی بزرگ در راه است؟ (سیگنال ماهیانه MACD)
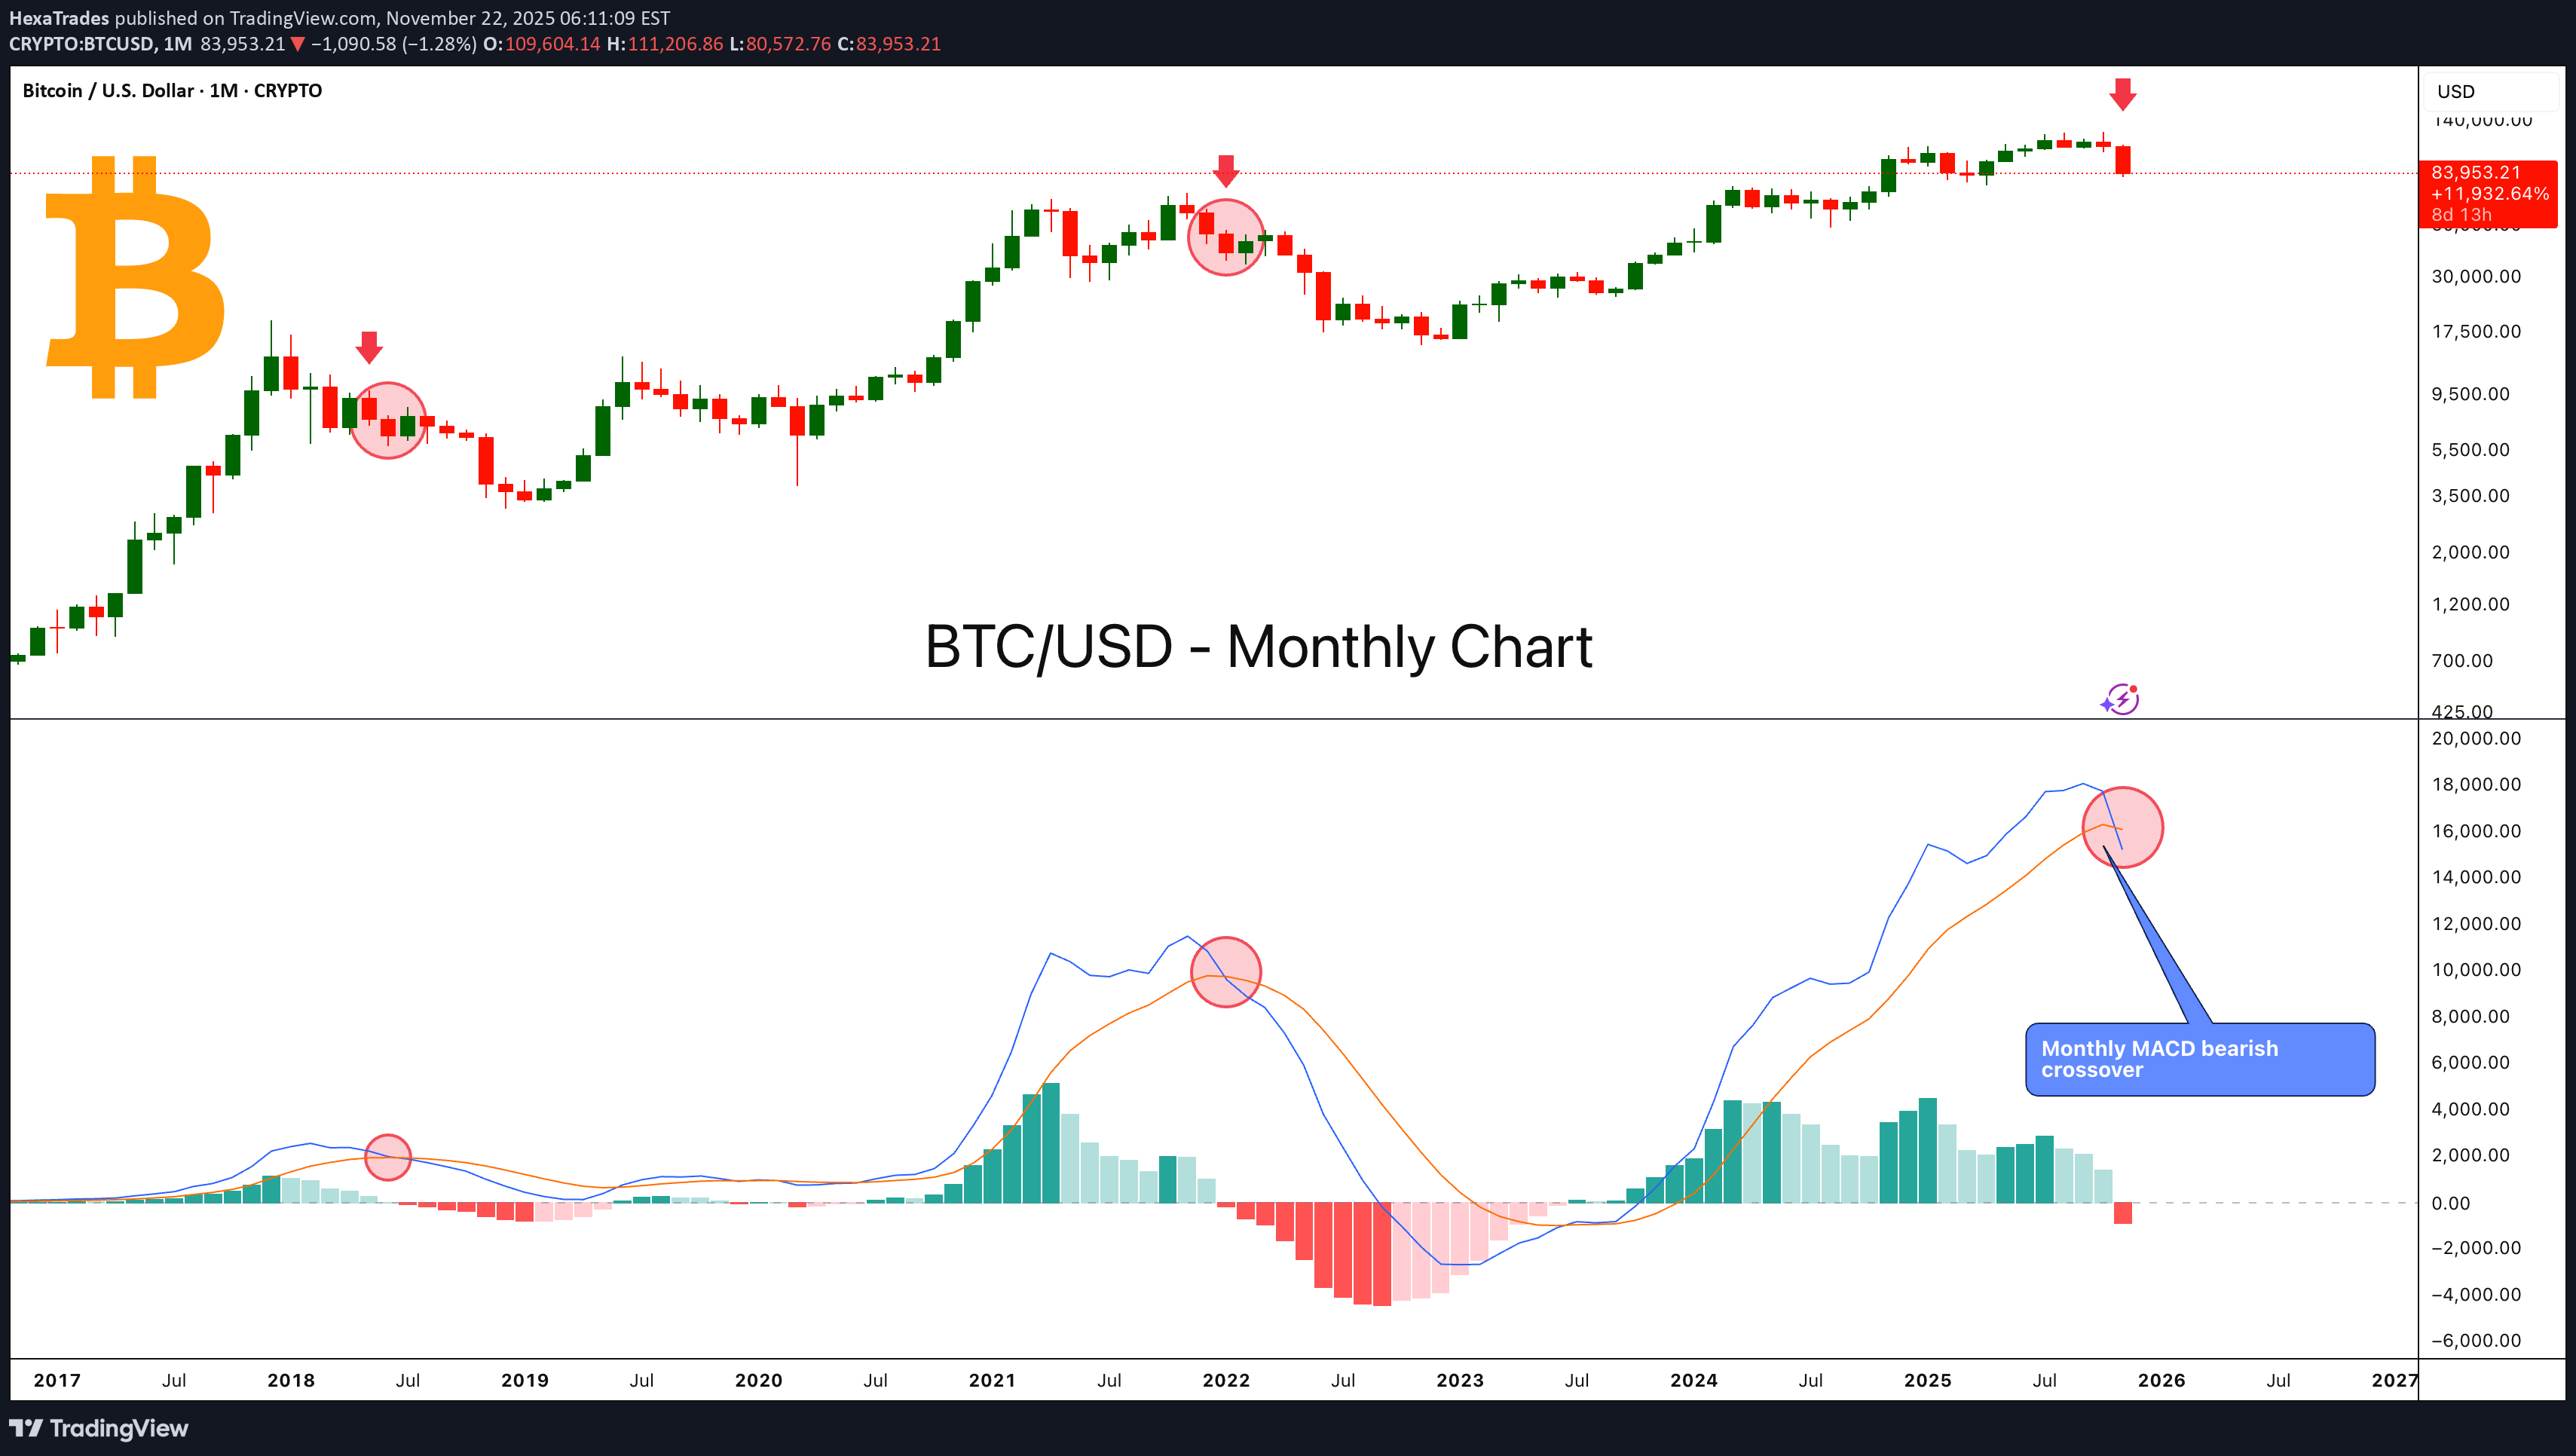
Bitcoin has printed a bearish MACD crossover on the monthly timeframe, a signal that has historically aligned with the start of major market corrections. This pattern appeared during the 2018 top, again near the 2022 macro peak, and the chart now shows a similar bearish crossover forming once more. Each previous monthly MACD bearish crossover occurred after a prolonged rally and was followed by a multi-month downtrend. The current crossover resembles those same market conditions, suggesting that BTC may be entering a deeper corrective phase if history repeats. Key Highlights - Monthly MACD bearish crossover, historically signals macro trend reversals. -Similar crossovers occurred before the 2018 and 2022 bear markets. -Strong rejection candle near major resistance aligns with previous cycle tops. - Momentum weakening after an extended rally suggests potential for further downside. - Monthly timeframe signals carry high weight and can drive long-term market direction. Cheers Hexa
HexaTrades
بیت کوین در آستانه ریزش بزرگ؟ ساختار سر و شانه ماکرو در تایم فریم هفتگی!
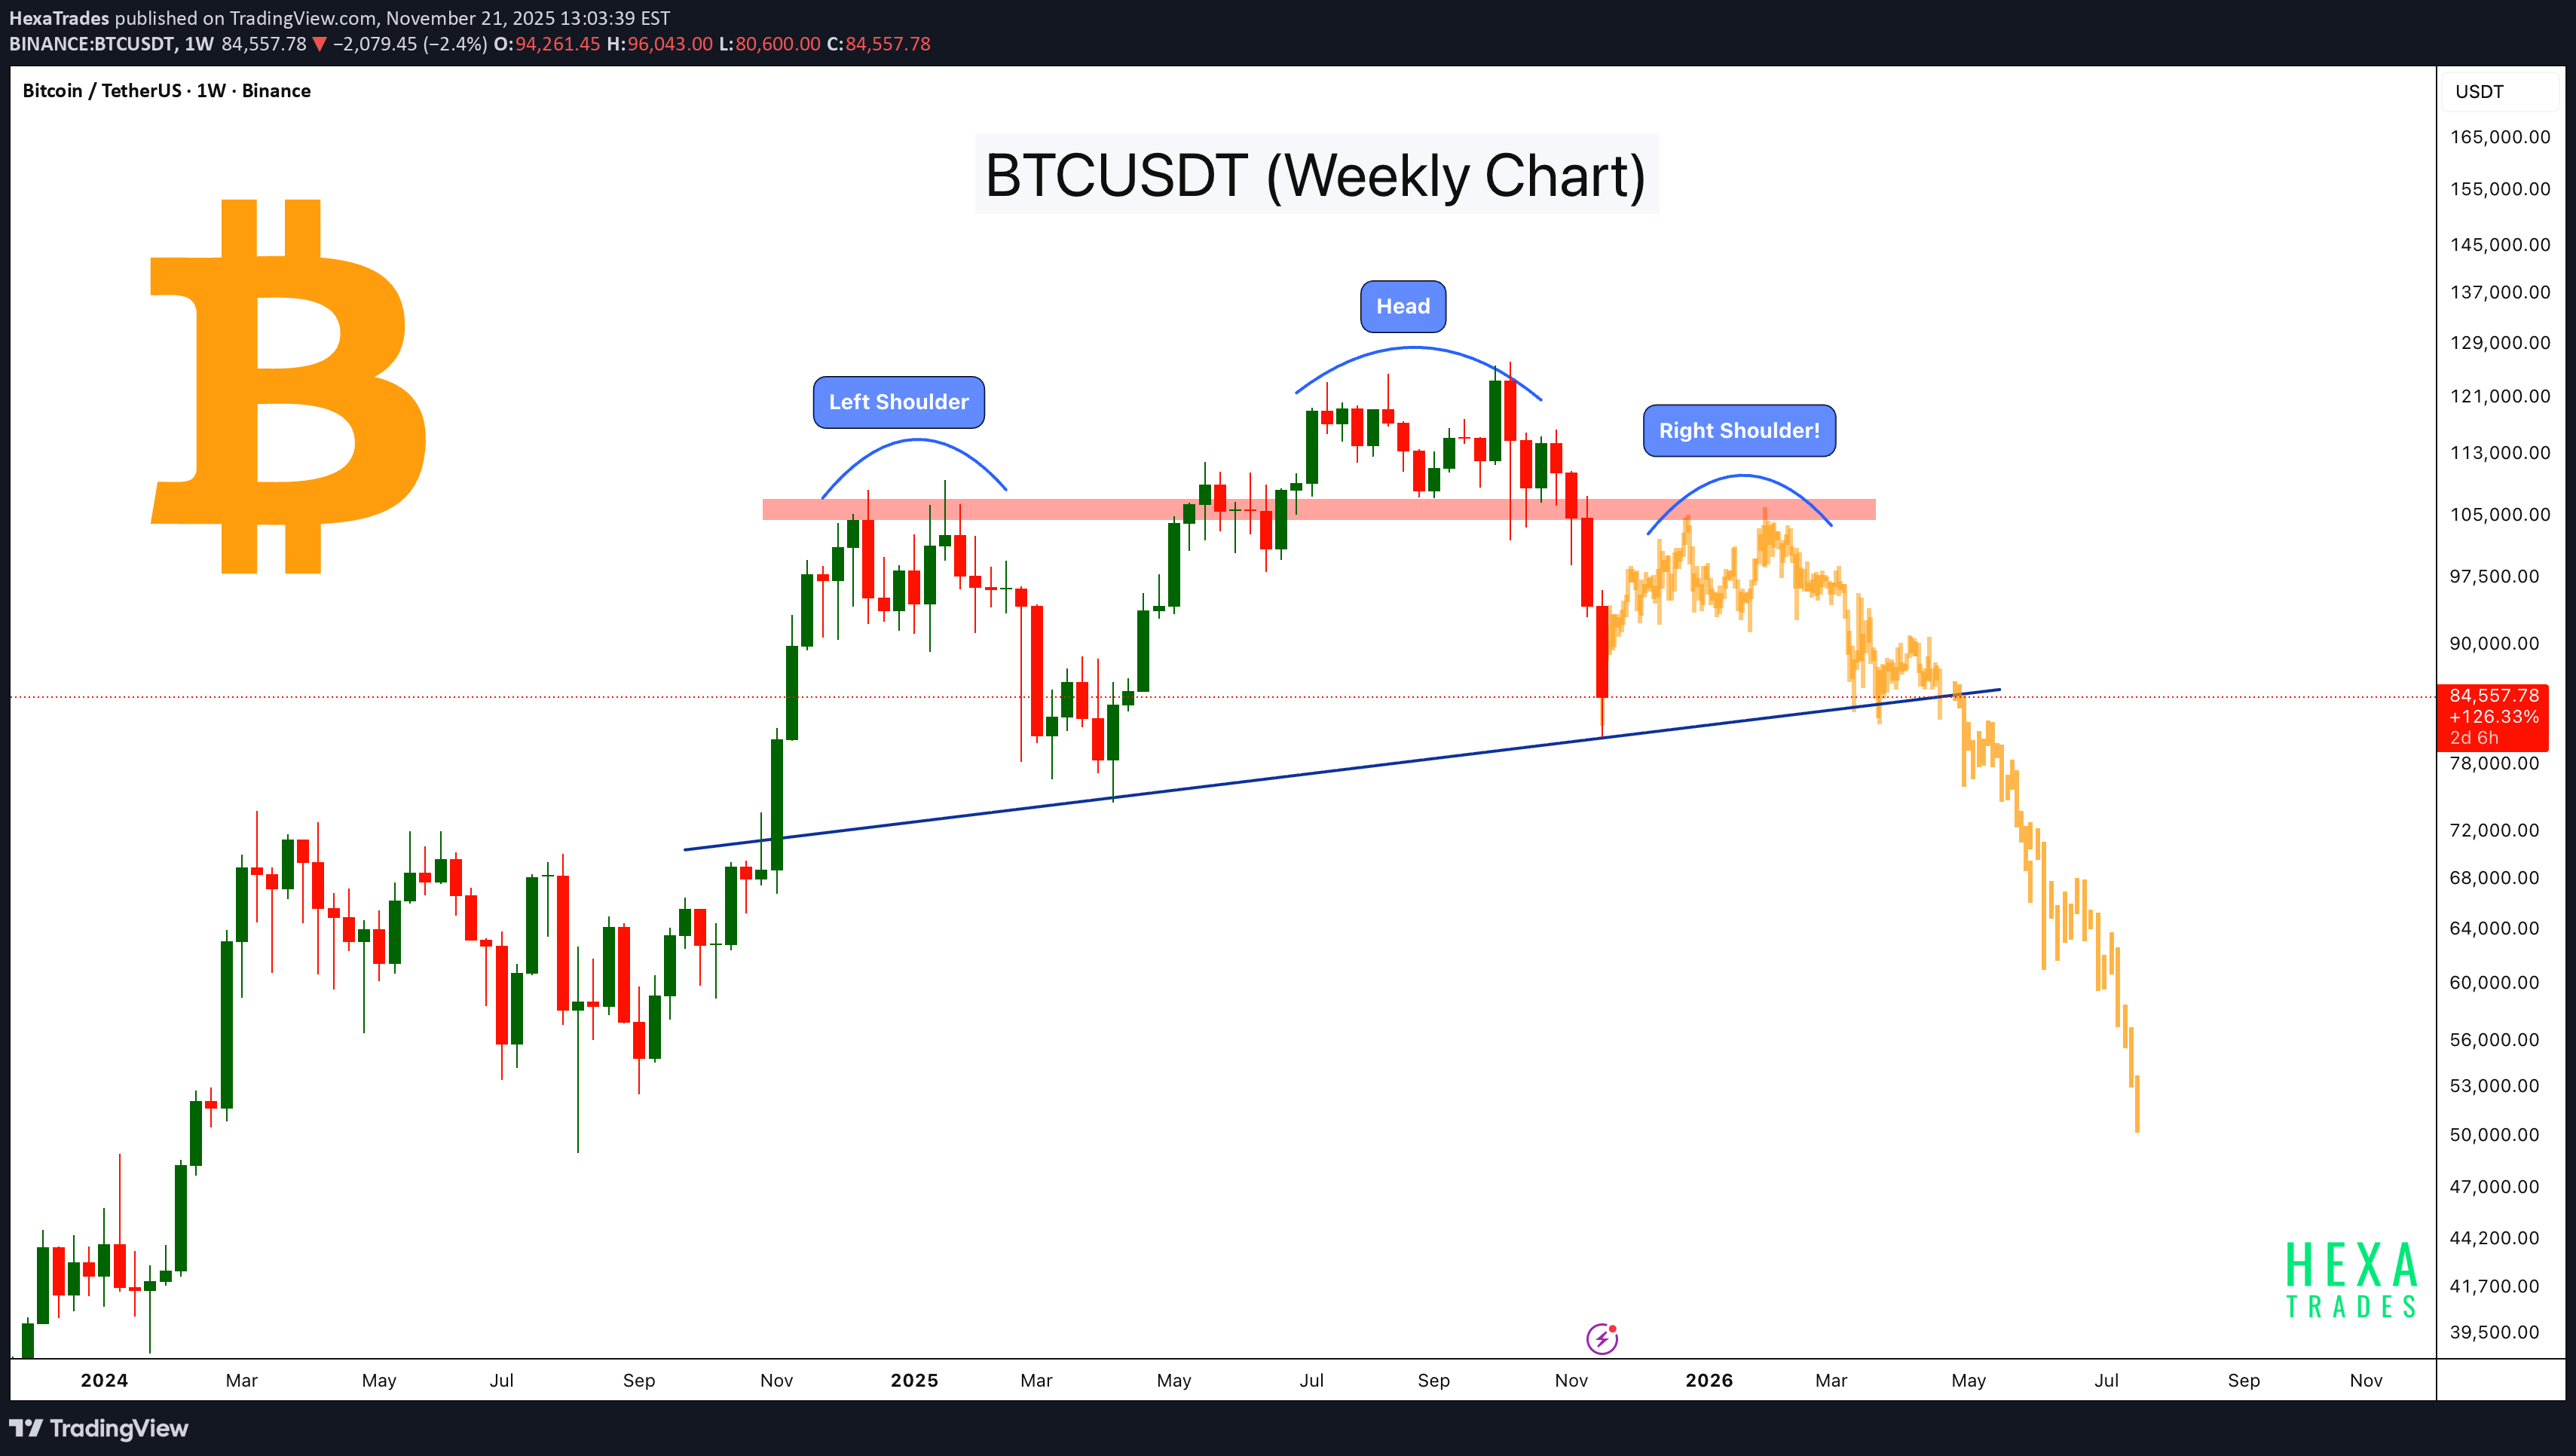
Bitcoin is developing a potential Head and Shoulders pattern on the weekly timeframe, a classic bearish reversal structure. The price has repeatedly rejected the major resistance zone marked in red, indicating strong selling pressure. As of now, the left shoulder and head are already formed, and based on the current structure, the right shoulder could form within the next 1–3 months if BTC continues to face resistance near this zone $100k- $107k Price is currently hovering near the long-term ascending trendline (neckline), which will play a key role in determining whether this pattern completes and confirms. The yellow candles represent a forecast, illustrating a possible scenario if the right shoulder forms and the neckline breaks. Key Highlights - Left shoulder and head are already formed; right shoulder may form in the next 1–3 months. - Strong rejection from major resistance, similar to classic H&S structures. - Ascending neckline acting as final support. - Yellow candles are only a forecast, not actual price data. - Pattern confirmation requires a decisive break below the neckline. This is an early-stage macro pattern, and traders should watch how BTC reacts around the resistance zone and the neckline in the coming weeks. Cheers Hexa
HexaTrades
بیت کوین تکرار تاریخ؟ شباهت نگرانکننده ساختار قیمتی 2021 و آینده!
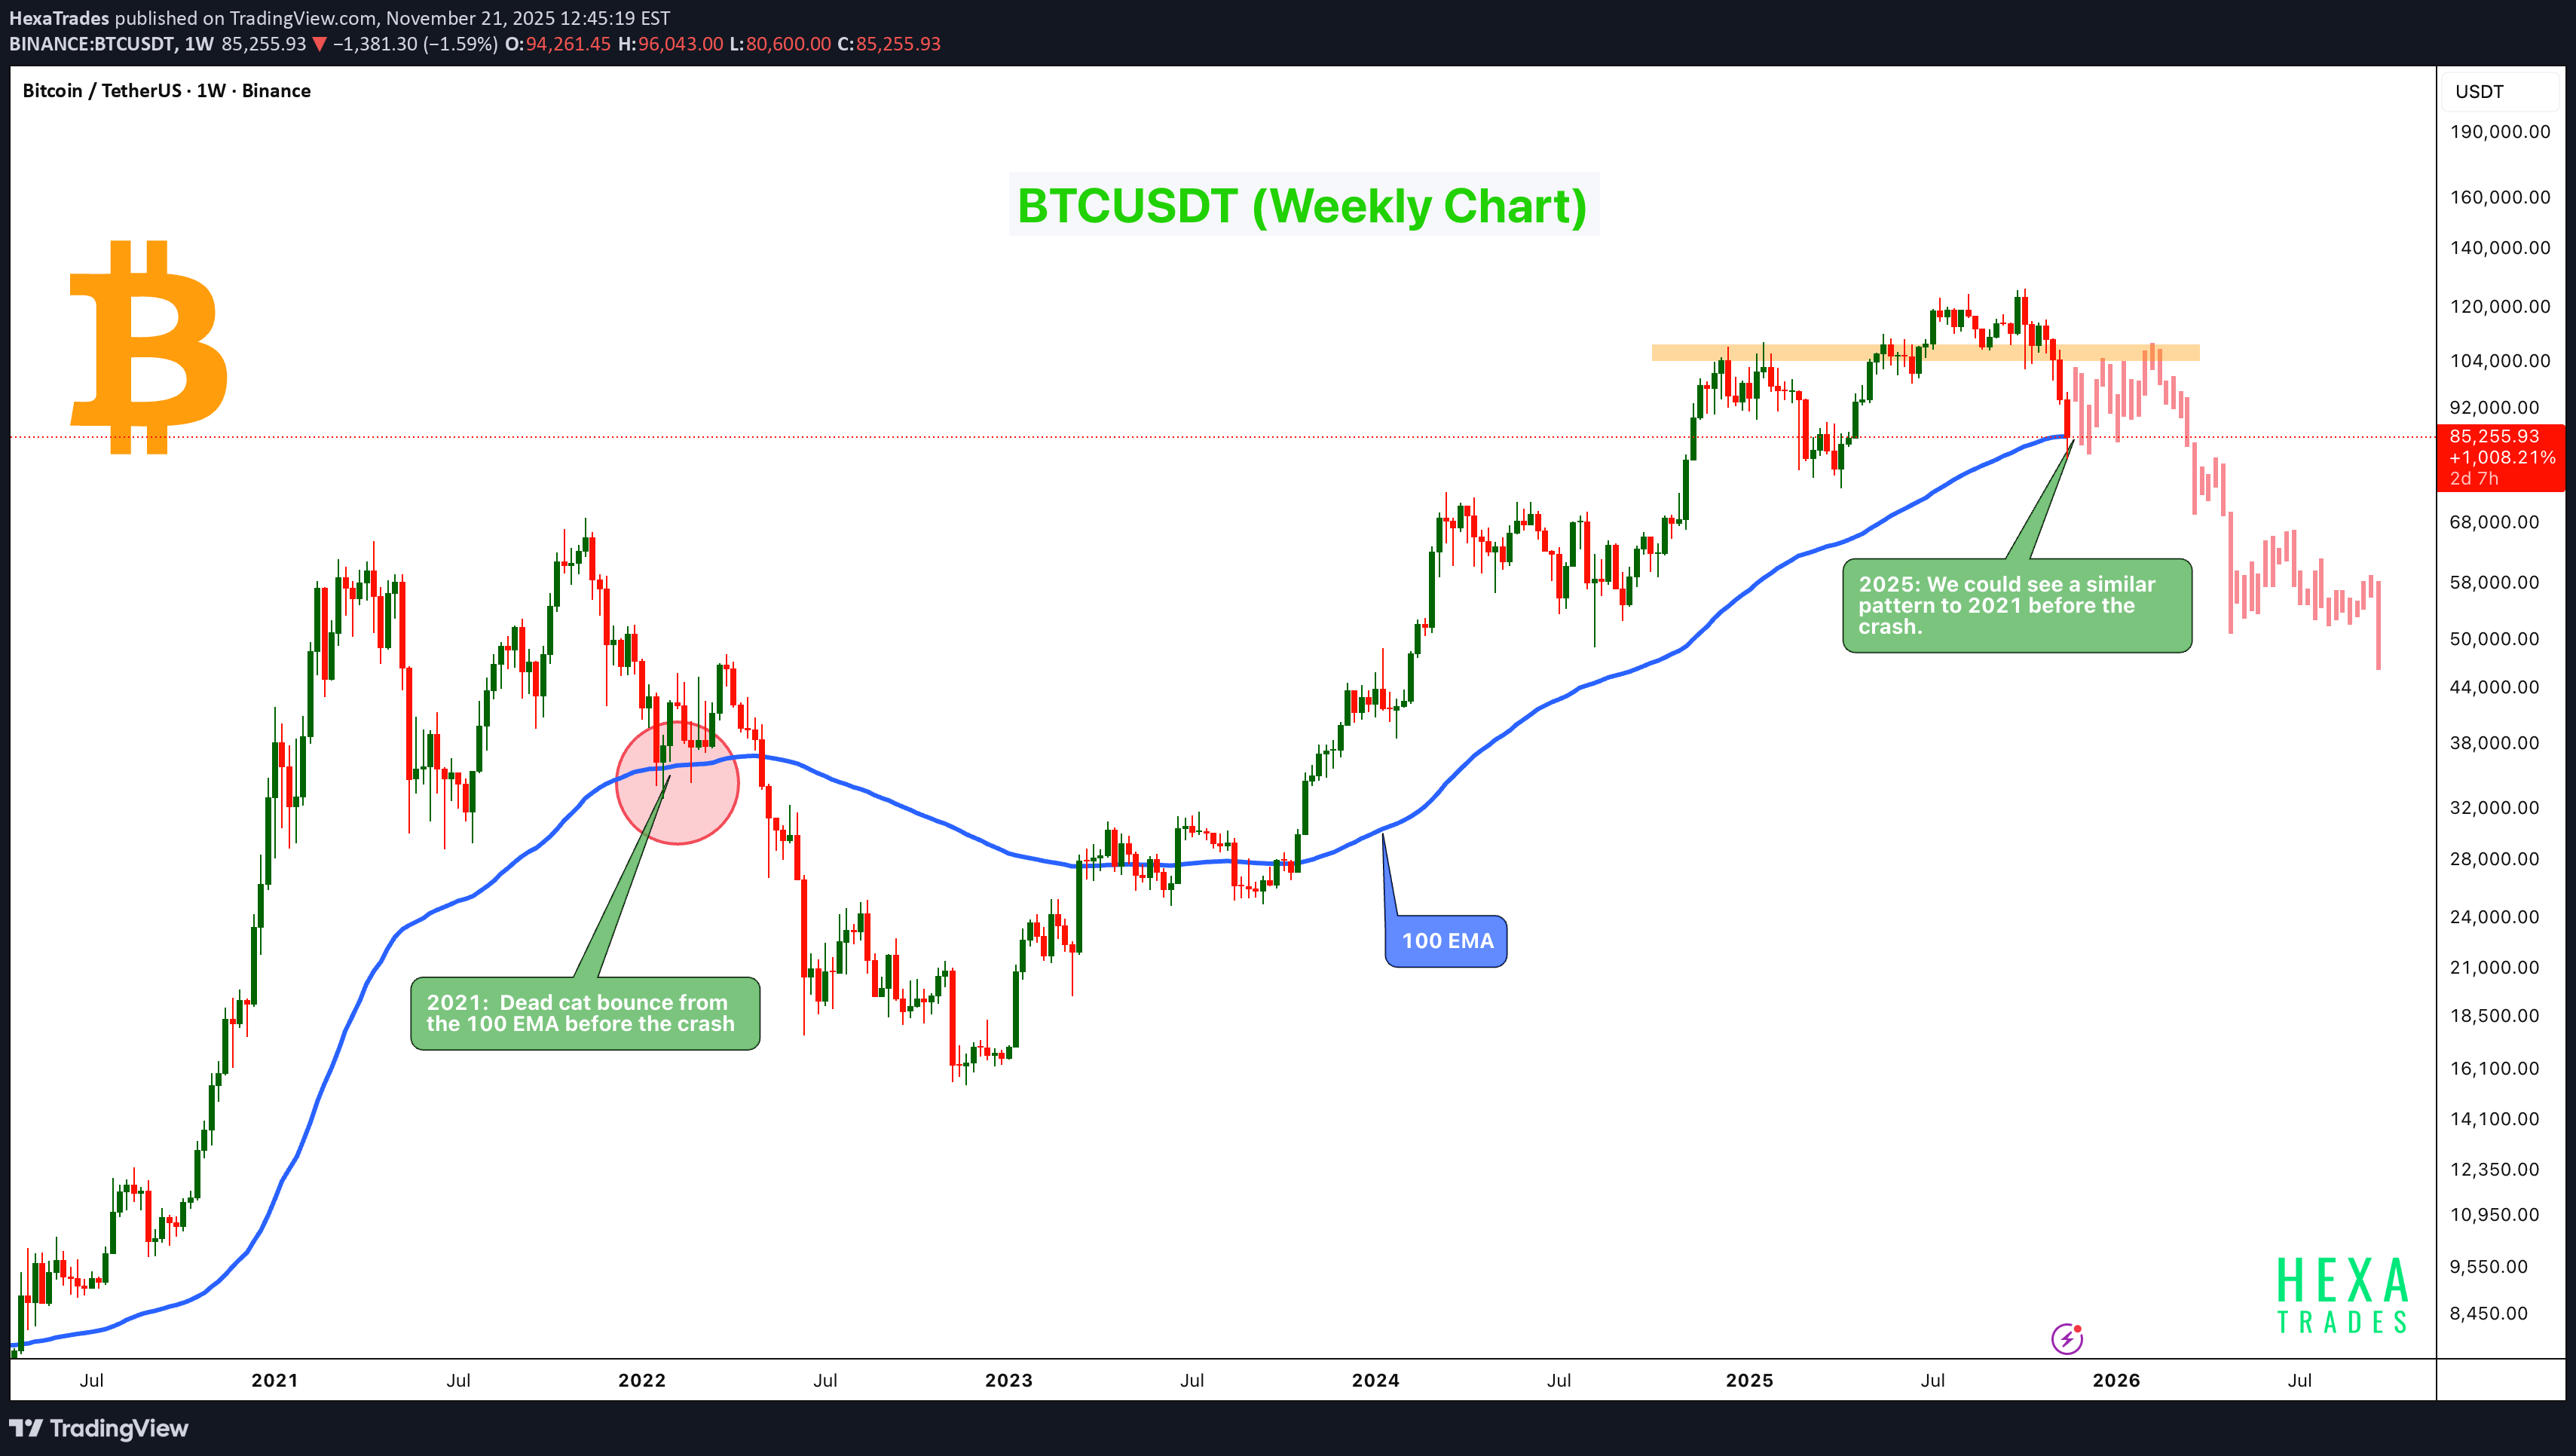
Bitcoin is showing a price structure very similar to the 2021 macro top, where BTC formed a dead-cat bounce from the 100 EMA before beginning a major correction. On the current cycle, BTC is once again testing the 100 EMA, and the price reaction looks very similar to the 2021 pattern: a brief bounce followed by continued downside pressure. Key Points: - 2021 Pattern: BTC bounced from the 100 EMA before the macro crash. - 2025 Price Action: Showing a similar bounce and reject structure at the same weekly EMA. - Major Weekly Resistance: Market showing exhaustion and lower-high structure, just like previous cycle tops. - Potential Dead-Cat Bounce: We could see a bounce toward the $100K–$107K zone before the downtrend continues. - Possible Repeat Scenario: If BTC fails to hold above the 100 EMA, history suggests a deeper correction may follow. Cheers Hexa
HexaTrades
اتریوم در آستانه انفجار؟ ترکیب طلایی حمایت، RSI اشباع فروش و فیبوناچی!
ETH is currently trading inside a major historical support zone, an area where price has repeatedly been rejected and bounced in the past. This level has acted as a strong demand zone multiple times, and the price is once again testing it. On the momentum side, the RSI has dipped below 30 on the daily chart. Historically, every time ETH’s RSI dropped into the oversold region, it marked a strong bottom formation followed by a notable bounce. Price is also sitting inside the Fibonacci golden zone, adding further confluence that this area could act as a potential reversal point. Key Points: - Strong multi-tested support zone - Price reacting inside the Fib golden pocket - Daily RSI oversold (<30) - historically reliable bottom signal for ETH - High probability bounce zone if the support holds - This is a critical level to watch for bullish reactions or early reversal signals. Cheers Hex
HexaTrades
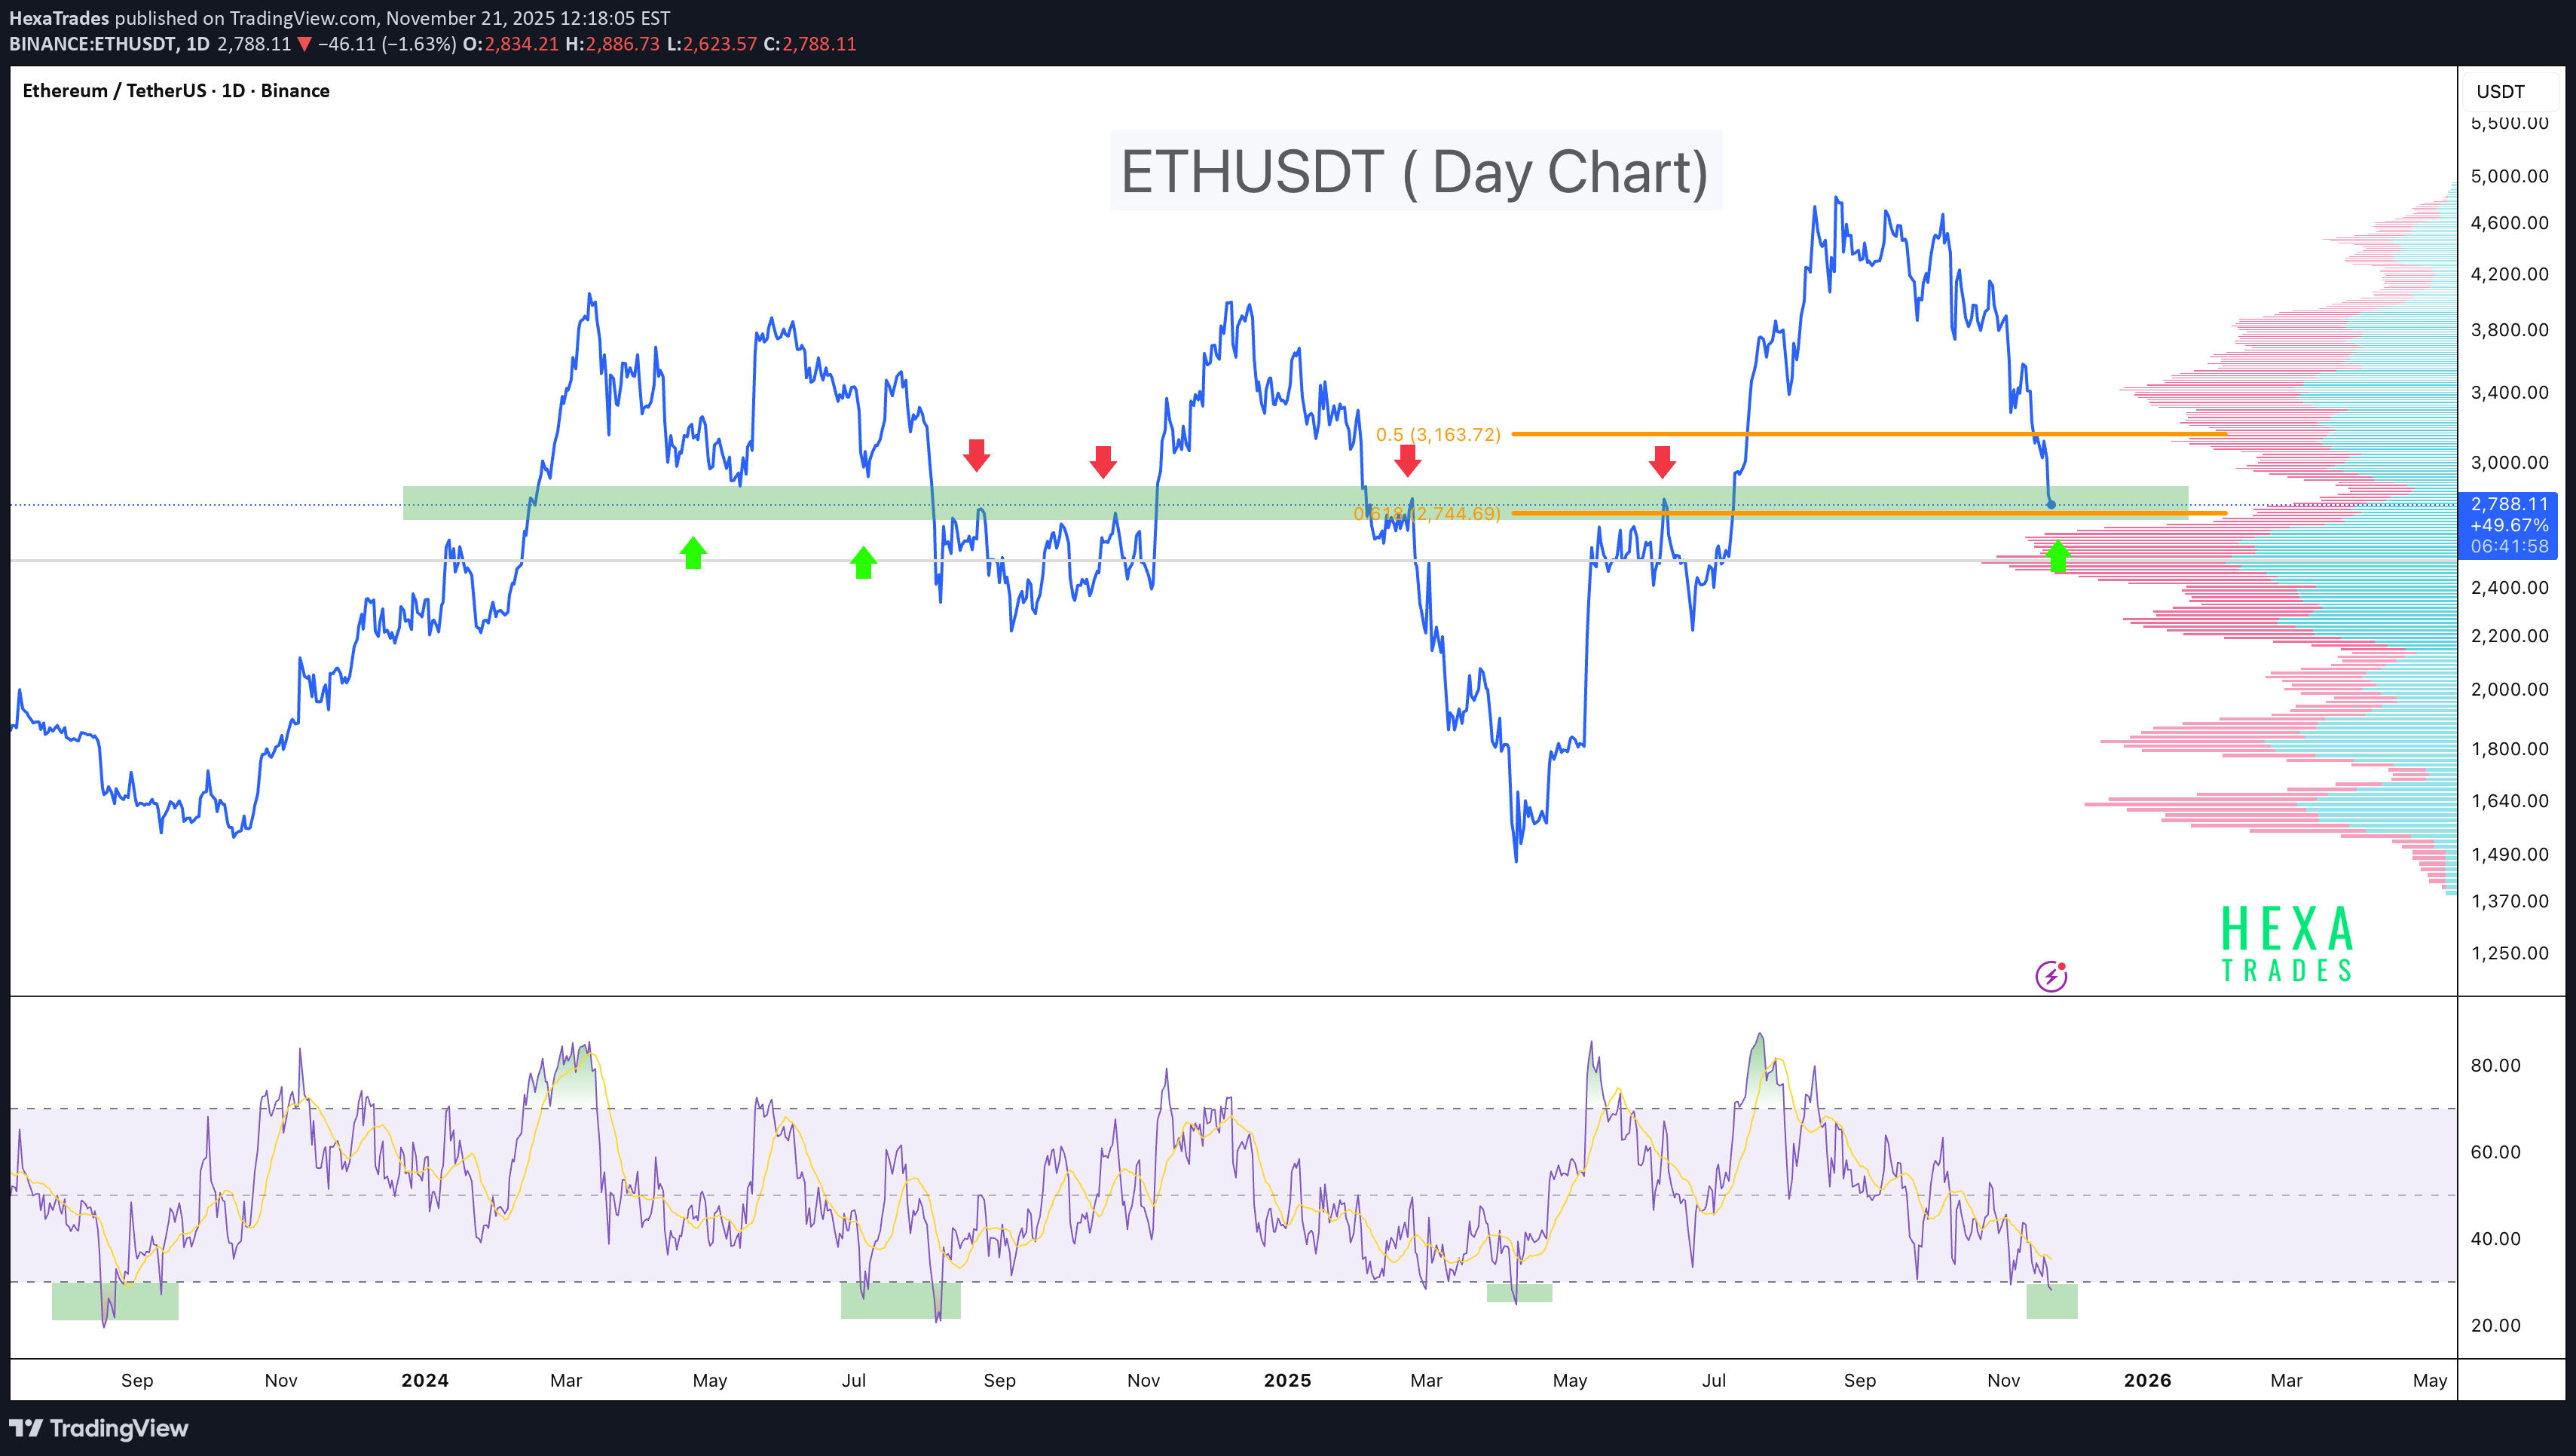
بیت کوین دوباره در منطقه اشباع فروش: آیا جهش بزرگ بعدی در راه است؟

Bitcoin chart highlights a repeating pattern on Bitcoin’s daily timeframe: every time the RSI drops into oversold territory (below 30), it has historically marked a major local bottom followed by a strong recovery. On the price chart above, each green arrow represents a previous swing low. On the RSI panel, the boxed areas show moments when RSI dipped below 30. Every one of these events has been followed by a noticeable rebound in Bitcoin’s price. We are now seeing the same setup again. RSI has once again fallen into the oversold zone, aligning with another green arrow on the chart. If history repeats, we could see a similar recovery this time too, just as Bitcoin has done consistently over previous cycles. Key Points - Historically on the daily chart, whenever RSI dropped below 30, Bitcoin experienced a recovery soon after. - The current RSI reading is tapping this same level again. - This confluence suggests a potential bottoming zone and possible trend reversal. - While not a guarantee, the pattern has been reliable across multiple past cycles. Cheers hexa
HexaTrades
احتمال انفجار قیمت اتریوم از حمایت مهم؛ آماده تماشای رالی بزرگ باشید!

ETH is currently respecting the lower boundary of a broadening wedge pattern, a structure known for sharp reversals once price taps the support zone. The latest reaction shows buyers defending this area, indicating a potential upside move. Entry: Current support area of the broadening wedge, below $3200 Stop-Loss: $2900 Take-Profit: 10%, 20% , 40% Cheers Hexa
HexaTrades
شکست کانال نزولی؛ سیگنال صعودی قوی برای ارز دیجیتال مانتا (MANTA)
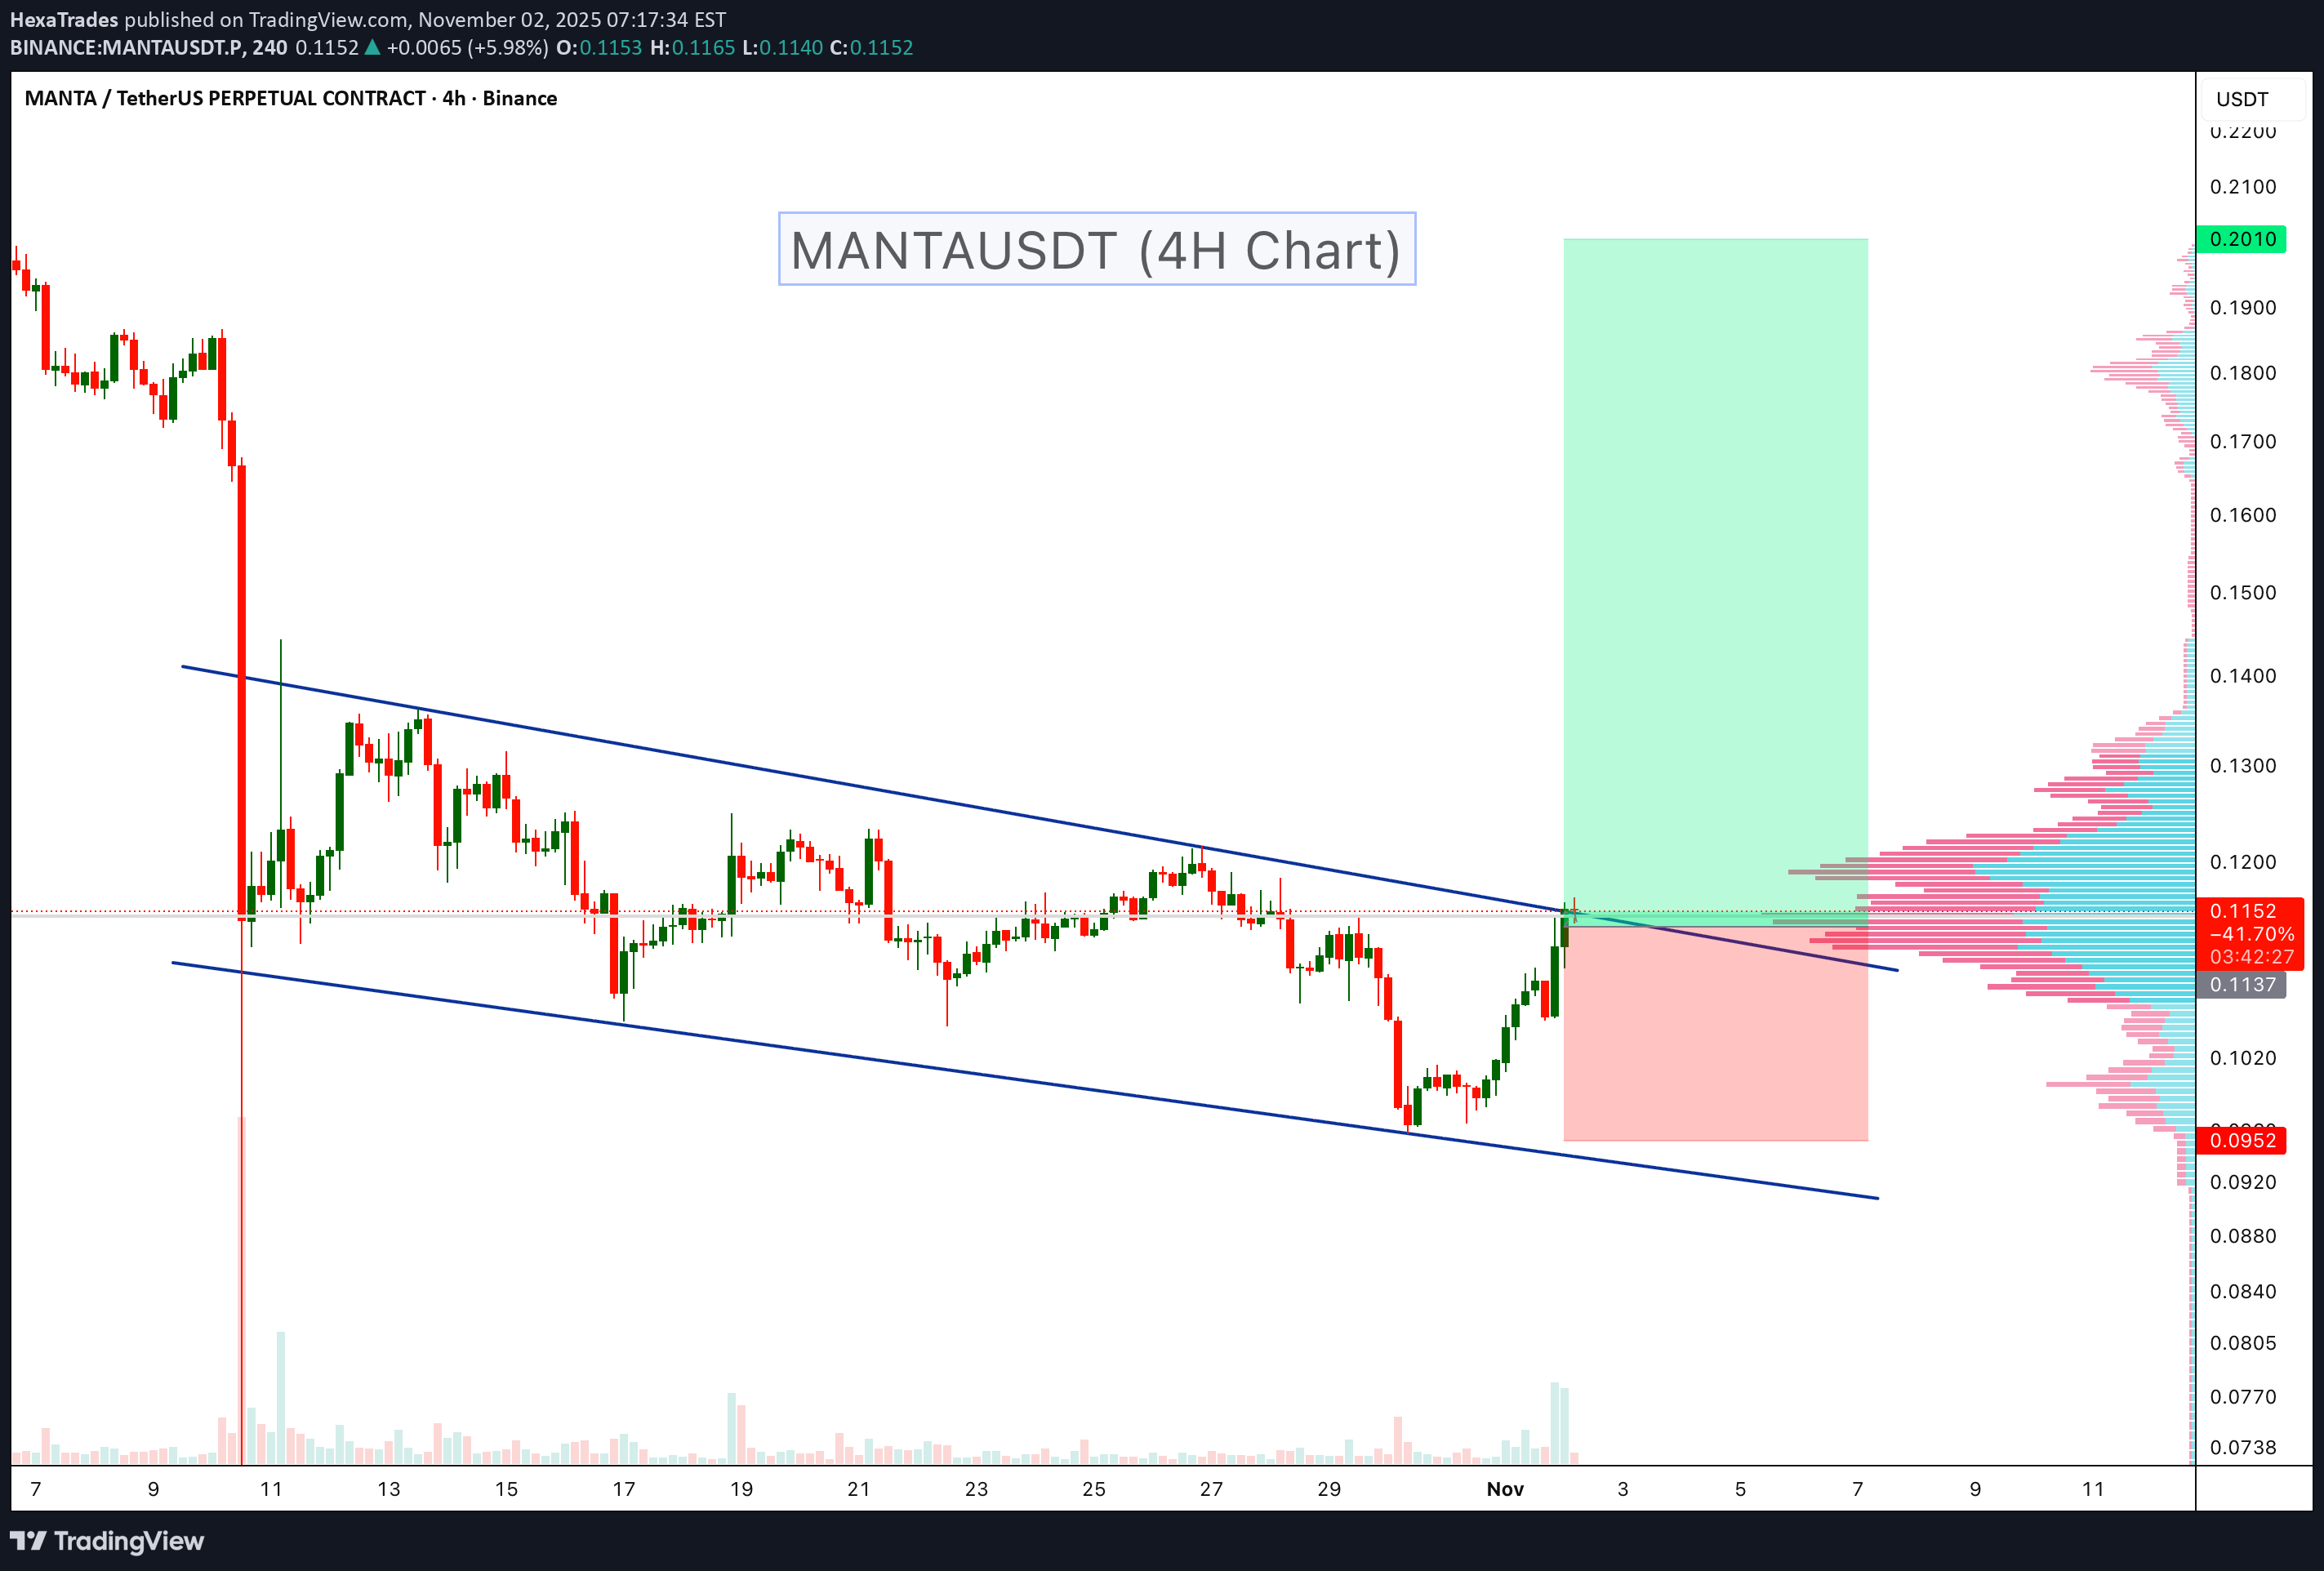
MANTA is showing a potential bullish breakout from a descending channel that has been holding price down throughout October. The recent strong recovery and breakout attempt above the upper trendline indicate early signs of trend reversal and possible momentum shift to the upside. Key Points: -Price has broken the upper boundary of the descending channel after multiple rejections. -Volume increase on breakout confirms buyer activity. - Horizontal volume profile shows a strong liquidity base near $0.10 – $0.11, which could act as solid support. - Short-term target zone lies between $0.18 – $0.20, aligning with the next major supply area. - Ideal invalidation below $0.095. Buy zone : Above $0.115 Stop loss : $0.095 Cheers Hexa MANTA MANTAUSDT
HexaTrades
آیا دَش (DASH) در آستانه یک رالی بزرگ است؟ شکست سقف کانال چند ساله!
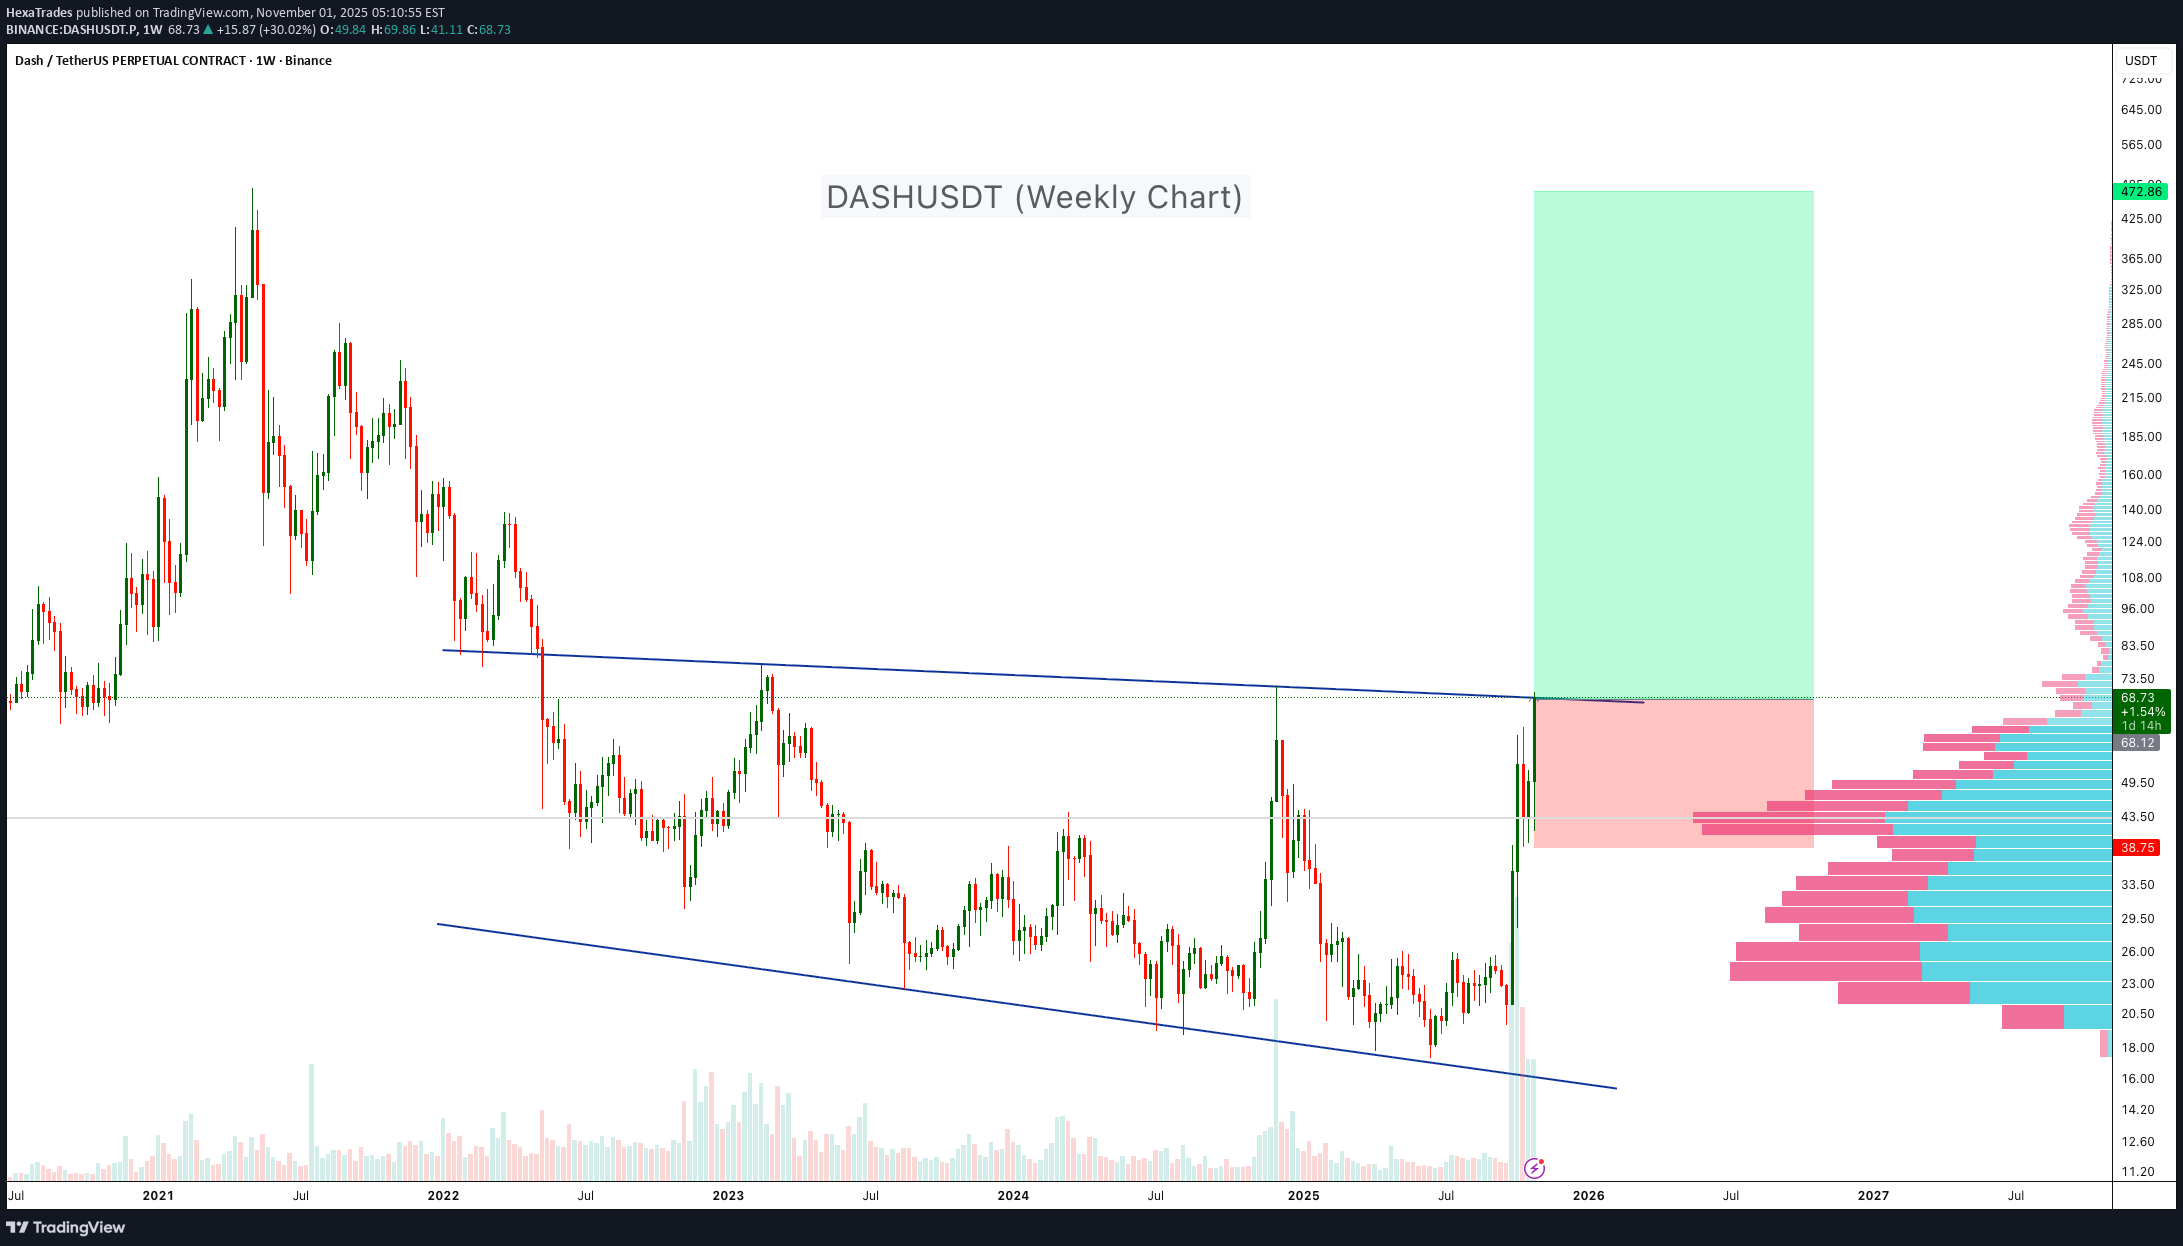
DASH has been trading inside a multi-year descending channel since early 2021. After several rejections from the upper boundary, the price has finally shown a strong breakout with a massive weekly candle, signaling potential trend reversal. Key Points: - Price has clearly broken out from the upper trendline of the descending channel. - Strong buying volume supports the breakout confirmation. - Historical volume profile shows a major liquidity gap above $70, suggesting room for a fast move once the price holds above the breakout zone. 🔷 Entry Zone: Below $70 🔷 Stop Loss: Below $38 🔷 Target: $400–470 (long-term potential) Conclusion: A confirmed breakout from a long-term descending channel could mark the beginning of a major uptrend for DASH. Sustained momentum above $70 may attract more volume and push the pair toward higher resistance zones. Cheers Hexa DASH DASHUSDT
Disclaimer
Any content and materials included in Sahmeto's website and official communication channels are a compilation of personal opinions and analyses and are not binding. They do not constitute any recommendation for buying, selling, entering or exiting the stock market and cryptocurrency market. Also, all news and analyses included in the website and channels are merely republished information from official and unofficial domestic and foreign sources, and it is obvious that users of the said content are responsible for following up and ensuring the authenticity and accuracy of the materials. Therefore, while disclaiming responsibility, it is declared that the responsibility for any decision-making, action, and potential profit and loss in the capital market and cryptocurrency market lies with the trader.