
KAVA
Kava
| تریدر | نوع سیگنال | حد سود/ضرر | زمان انتشار | مشاهده پیام |
|---|---|---|---|---|
No results found. | ||||
Price Chart of Kava
سود 3 Months :
سیگنالهای Kava
Filter
Sort messages by
Trader Type
Time Frame

KAVAUSDT-bearish
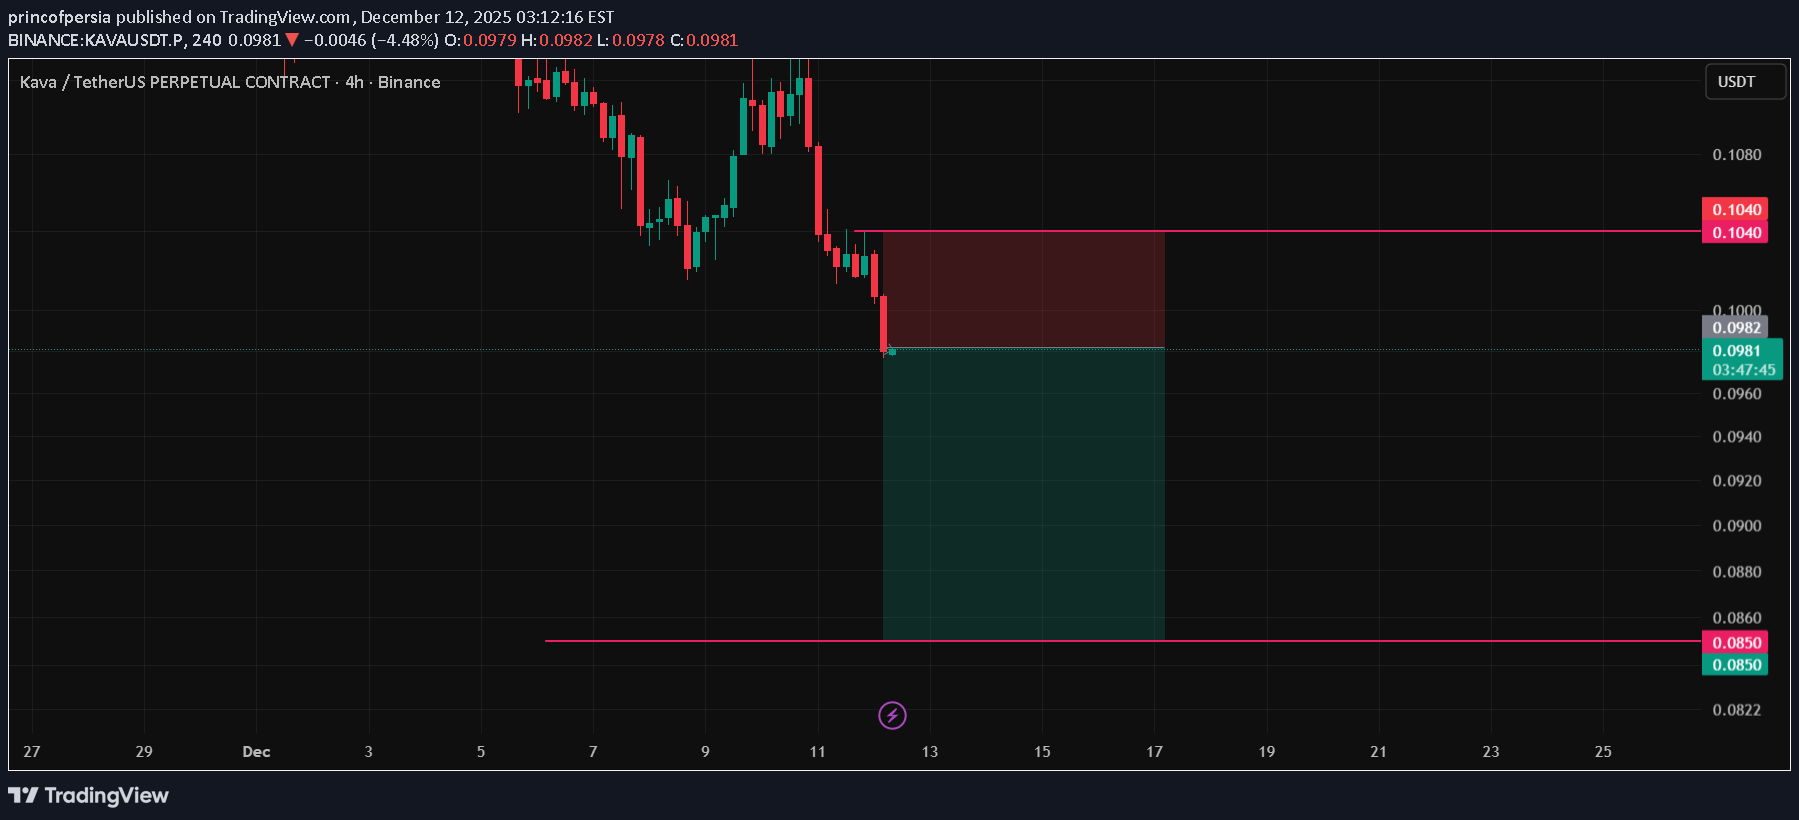
KAVA USDT bearish 4H SL : 0.1045 TP 1 : 0.0850 TP 2: 0.0800 daily SL : 0.1150 TP : 0.0680KAVA USDT bearish 4H SL : 0.1045 TP 1 : 0.0850 (15.00%) Successfully 3D-8H TP 2: 0.0800 daily SL : 0.1150 TP : 0.0680KAVA USDT bearish 4H SL : 0.1045 TP 1 : 0.0850 (15.00%) target 3D-8H TP 2: 0.0800 (22.00%) trigger 5D-6H daily SL : 0.1150 TP : 0.0680

DAY11

pullbacksignal
سیگنال فروش فوری KAVAUSDT: آماده کسب سود با تحلیل تکنیکال قوی!

Trading Setup: There is a Trading Signal to Sell in KAVAUSDT KAVA (Futures) (1h) Traders can open their Sell Trades NOW ⬇️ Sell now or Sell on 0.135 ⭕️SL @ 0.14 🔵TP1 @ 0.122 🔵TP2 @ 0.115 🔵TP3 @ 0.10 What are these signals based on? Classical Technical Analysis Price Action Candlesticks Fibonacci RSI, Moving Average , Ichimoku , Bollinger Bands Risk Warning Trading Forex, CFDs, Crypto, Futures, and Stocks involve a risk of loss. Please consider carefully if such trading is appropriate for you. Past performance is not indicative of future results. If you liked our ideas, please support us with your likes 👍 and comments .✅ KAVAUSDT KAVAUSDT (Futures) (1h) TP1 hit TA Update — The price has reached the target, traders can close part of the trade in profit.✅✅ KAVAUSDT KAVAUSDT (Futures) (1h) TP1 & TP2 hit TA & setup Update — The price has reached the target, traders can close part of the trade in profit. — SL Move to BE Point (Risk-Free)

profitanium
کاوای (KAVA) در آستانه انفجار قیمتی: آماده جهش ناگهانی!

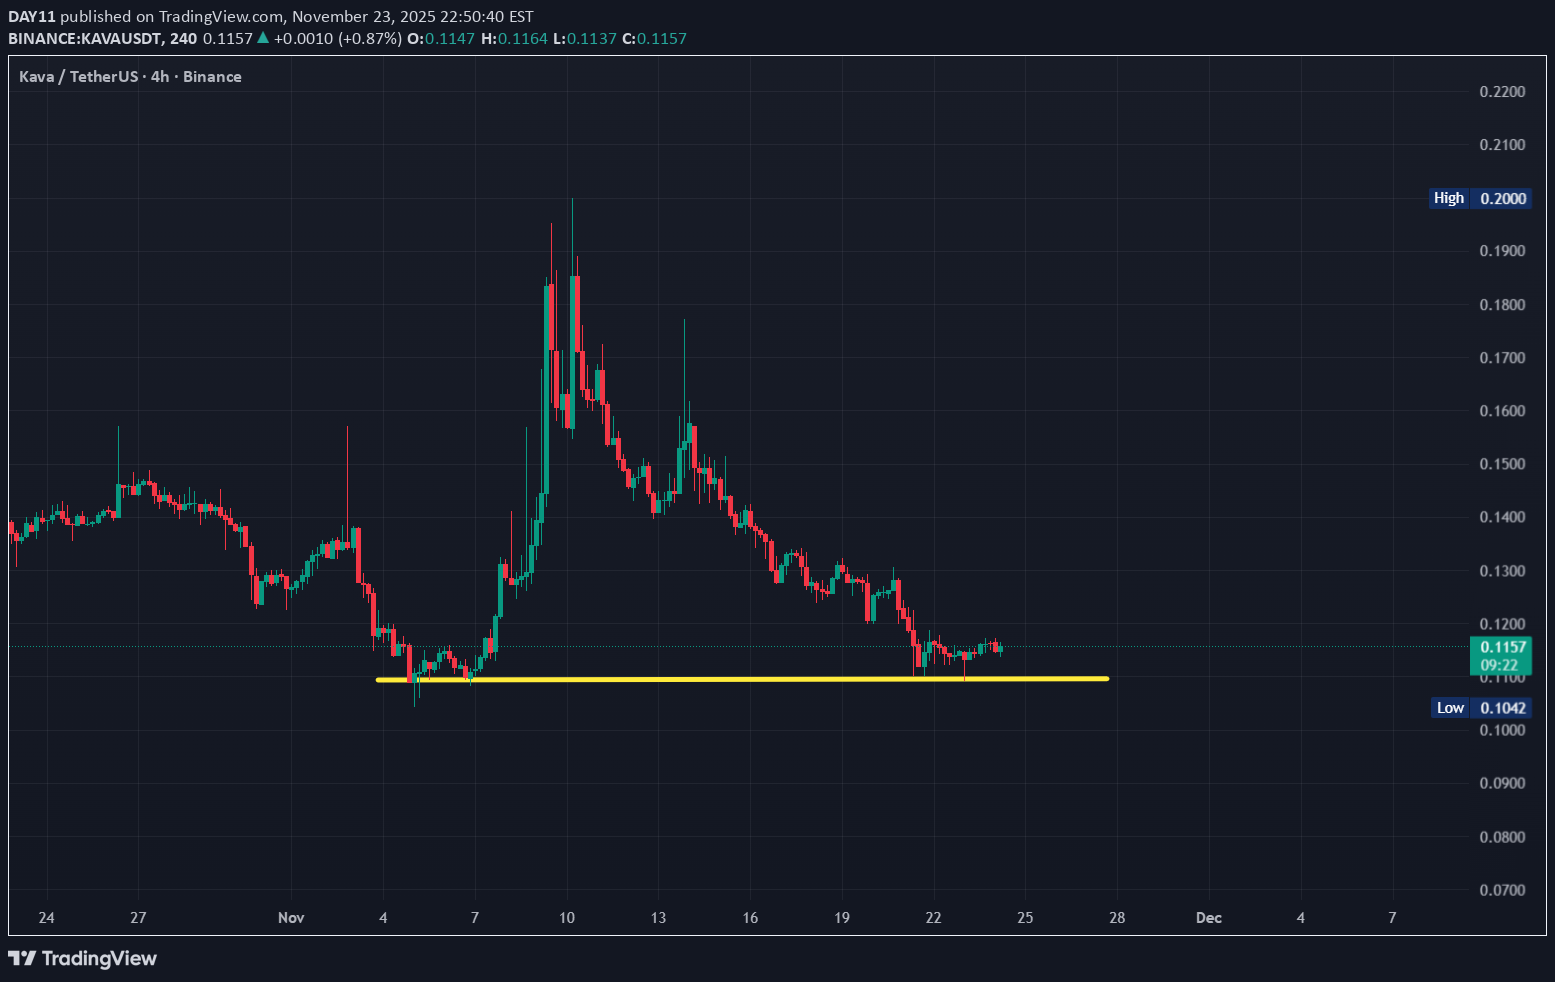
KAVAUSDT is heavily oversold and will likely rebound quickly to complete its mean reversion.

zenkedisi
خرید کاوا (KAVA): سه مرحلهای که باید بدانید!

https://www.tradingview.com/x/JiDySspF/ I made a spot purchase and I'm uploading it here as a souvenir from 3 levels. Good luck :)

asilturk
کاورای آماده پرواز: اصلاح تمام شد، انتظار حرکات انفجاری در هفتههای آینده!

Another alt coin we will share today is KAVA, its current price is 0.1240$, market value is 134Million dollars, number of shares in total circulation is 1Billion, dominance weight is 0.0038%, platform concentration rate is 5.24, transaction volume is 28Million$. Kava coin Cross-Chain Compatibility (Cross-Chain),"Thanks to Cosmos' IBC protocol, it can interact smoothly and quickly with assets (BTC, XRP etc.) on different blok chains."Hybrid Architecture (EVM & Cosmos), Offers both Ethereum (EVM) compatibility and the speed and scalability of Cosmos at the same time. High Speed and Scalability, Fast transaction confirmations and low transaction confirmations thanks to Tendermint consensus provides transaction fees. Governance and Security,"KAVA token holders have a say in the future of the project through voting, and tokens can be staked to secure the network." Artificial Intelligence (AI) Integration,An effort to automate DeFi strategies and integrate AI tools into the platform for yield optimization. As for the downsides, Competitive Intensity competes with many large and established competitors in the Layer-1 and DeFi spaces (Ethereum, Solana, etc.). Perception of Complex Structure,Co-Chain architecture can make it difficult to understand for,new developers and users. Token Inflation Risk, The inflation mechanism implemented to promote network security has the potential to increase the circulating supply of KAVA. Market Volatility is sensitive to general cryptocurrency market risks and fluctuations. Decentralization Level: Compared to some Layer-1 competitors, the number of validators and the level of decentralization may be questioned. From a technical perspective, we see a weekly recovery. The volume is quite good, OBV is also showing an upward trend from horizontal, RSI is still far from the overbought region, but there is no formation other than DUKE for now. Different price targets may be realized in the coming weeks for KAVA, which has a positive outlook in general. I wish you pleasant spending.

miladchikol


DragonCaoB
تحلیل تکنیکال KAVA: فرصت خرید بزرگ در منطقه اشباع فروش با پتانسیل سود 2.7 برابری!

💎 Scalp Long – KAVA RSI is in the buy zone — momentum clearly recovering. The short-term downtrend line has been broken, and price is well-supported by the demand zone. Volume is surging, confirming buyers’ strength returning. 🎯 Plan: → Enter after a clean retest of the trendline or nearby support. → TP: 0.1534 | SL: 0.1347 | RR: 1 : 2.7 Short-term structure has flipped bullish — momentum favors the upside. Keep position size light, trail SL as price moves. Discipline first — no chasing, only execution.

MuratKrkn
انتظار پامپ کاوا (KAVA) تا پایان سال: تحلیل و اهداف قیمتی


CryptoNuclear
KAVA/USDT — Descending Triangle at a Major Decision Zone!

KAVA is currently standing at a critical crossroads. After a prolonged downtrend from its all-time high, the price is now consolidating inside a descending triangle on the weekly timeframe. Lower highs keep pressing the price downward, while the historical support zone at $0.24 – $0.32 is still holding as the last line of defense. The triangle is getting tighter (apex approaching), which often signals an imminent big move — either a bullish reversal or a bearish continuation. --- 🔎 Pattern Analysis Main pattern: Descending Triangle → Traditionally seen as a bearish continuation, but if the support holds strong, it could act as a springboard for a major reversal. Historical support: $0.24 – $0.32 (yellow box), a make-or-break area before entering uncharted lower territory. Falling trendline: The multi-year descending line from 2021 remains the key resistance that bulls must reclaim. --- 🚀 Bullish Scenario 1. Breakout confirmation → A weekly close above the descending trendline. 2. Stronger signal → Break + retest above $0.53. 3. Upside targets: $0.70 → first psychological barrier. $1.16 → strong historical resistance. $2.22 → mid-term breakout target. 4. Extra signals: Rising volume + RSI recovery from oversold would strengthen bullish momentum. --- 🐻 Bearish Scenario 1. Breakdown confirmation → A weekly close below $0.24 with strong volume. 2. Downside targets: Below $0.24 → opens room for deeper lows. Sustained breakdown would confirm the continuation of the multi-year bearish trend. 3. Risk factor: Watch for potential false breakdowns (bear traps) if price quickly reclaims the support. --- 🎯 Conclusion $0.24 – $0.32 is KAVA’s do-or-die zone. Holding this level → chances of a major reversal. Losing this level → the bearish trend extends even further. KAVA is in its final stage of accumulation or distribution. Traders should wait for clear breakout confirmation before committing, as volatility is likely to expand once price exits this structure. --- KAVA/USDT is consolidating at historical support $0.24 – $0.32, trapped inside a descending triangle. The apex is near → a decisive move is coming. Bullish case: Breakout above the trendline and $0.53 → targets $0.70 – $1.16 – $2.22. Bearish case: Breakdown below $0.24 → opens the door for deeper lows. This is a multi-year turning point for KAVA. Patience for confirmation could reward traders with the next major move. --- #KAVA #KAVAUSDT #Crypto #Altcoins #PriceAction #DescendingTriangle #SupportResistance #CryptoAnalysis #BreakoutTrading
Disclaimer
Any content and materials included in Sahmeto's website and official communication channels are a compilation of personal opinions and analyses and are not binding. They do not constitute any recommendation for buying, selling, entering or exiting the stock market and cryptocurrency market. Also, all news and analyses included in the website and channels are merely republished information from official and unofficial domestic and foreign sources, and it is obvious that users of the said content are responsible for following up and ensuring the authenticity and accuracy of the materials. Therefore, while disclaiming responsibility, it is declared that the responsibility for any decision-making, action, and potential profit and loss in the capital market and cryptocurrency market lies with the trader.