
MuratKrkn
@t_MuratKrkn

What symbols does the trader recommend buying?
Purchase History
پیام های تریدر
Filter
MuratKrkn
پیشبینی بیت کوین (ETH/USD) تا ۲۰۲۶: رسیدن به حمایتها یا شروع خرسدوره؟
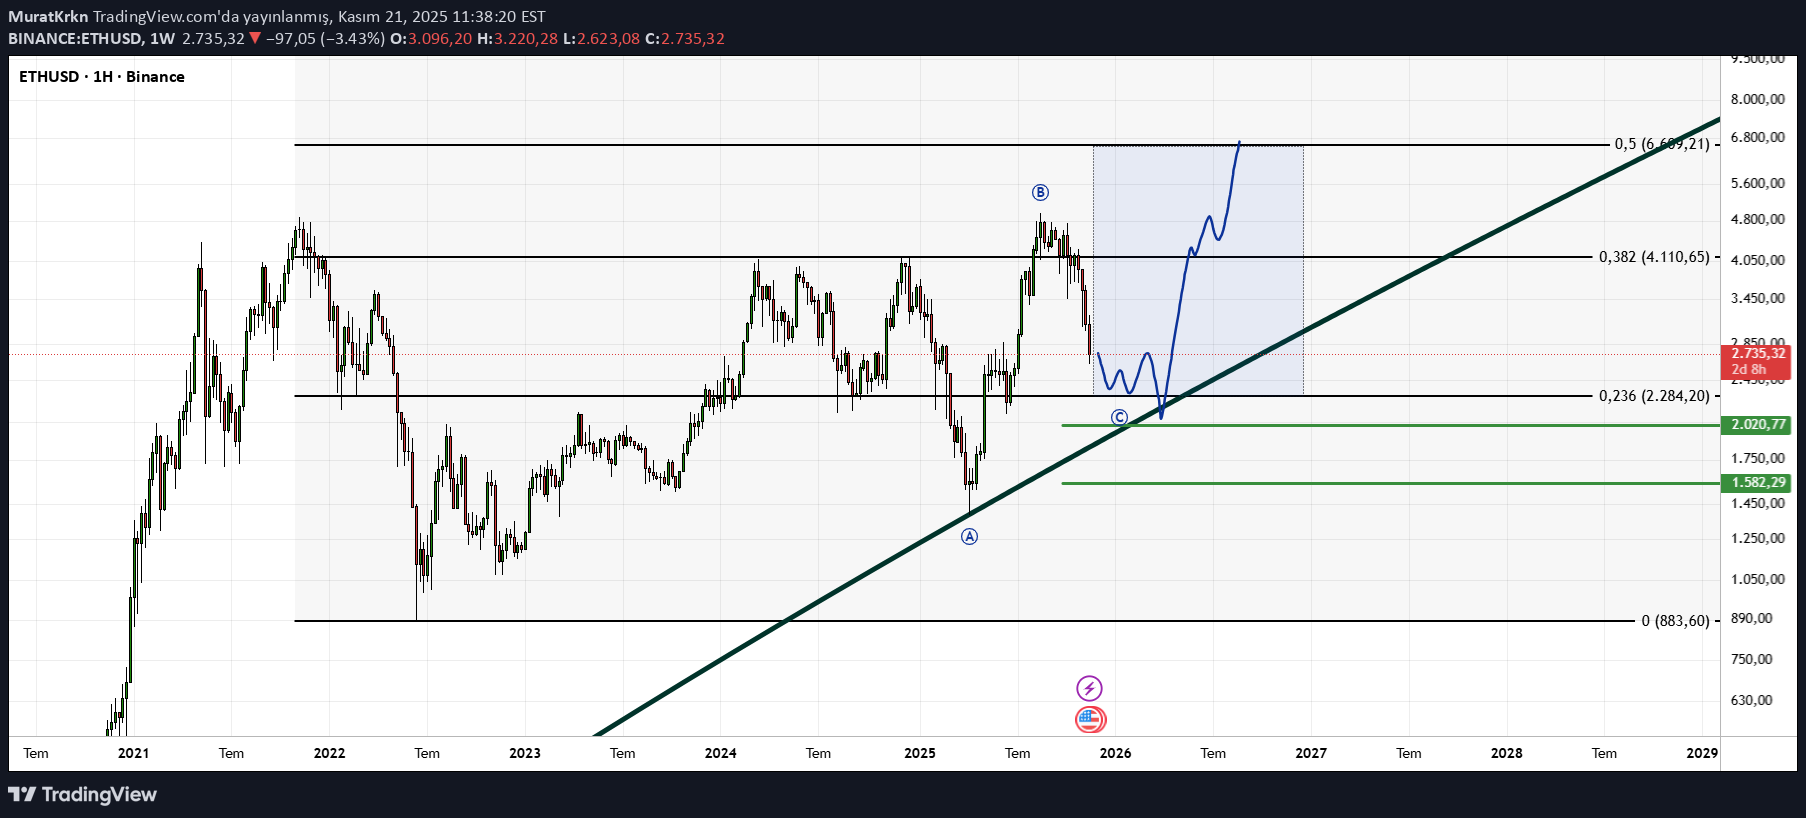
If the monthly weekly close is below the favorite number 2.285, the green lines below are my next support areas. I hope we enter 2026 with a bull run. Because the general picture already looks like it will continue into a deep bear season of 2026.
MuratKrkn
پیشبینی هیجانانگیز قیمت ROSE تا سال 2026: آیا این ارز صعود خواهد کرد؟
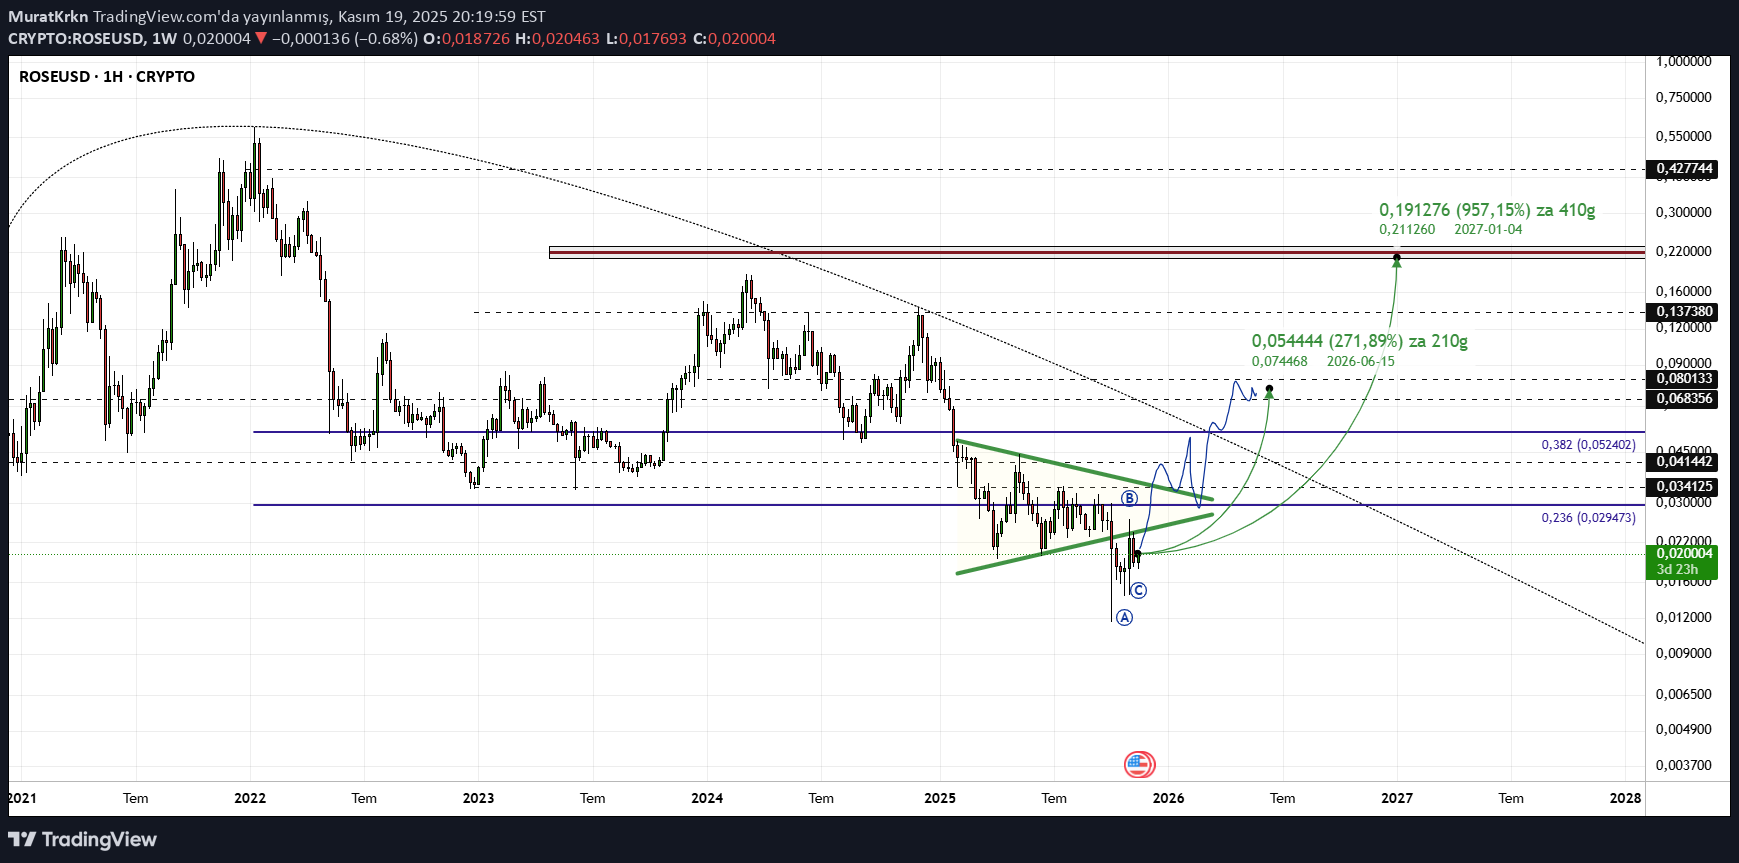
My 2026 goal for Rose. In the chart, I have indicated the levels I expect the rise to reach, which will start in December. rose movements are very positive. The level to be cleared starts within the green triangle. Since it is a weekly chart, I make updates over time according to the flow.
MuratKrkn
اتم (ATOM) از کما بیرون میآید: پیشبینی صعودی بزرگ تا پایان سال!
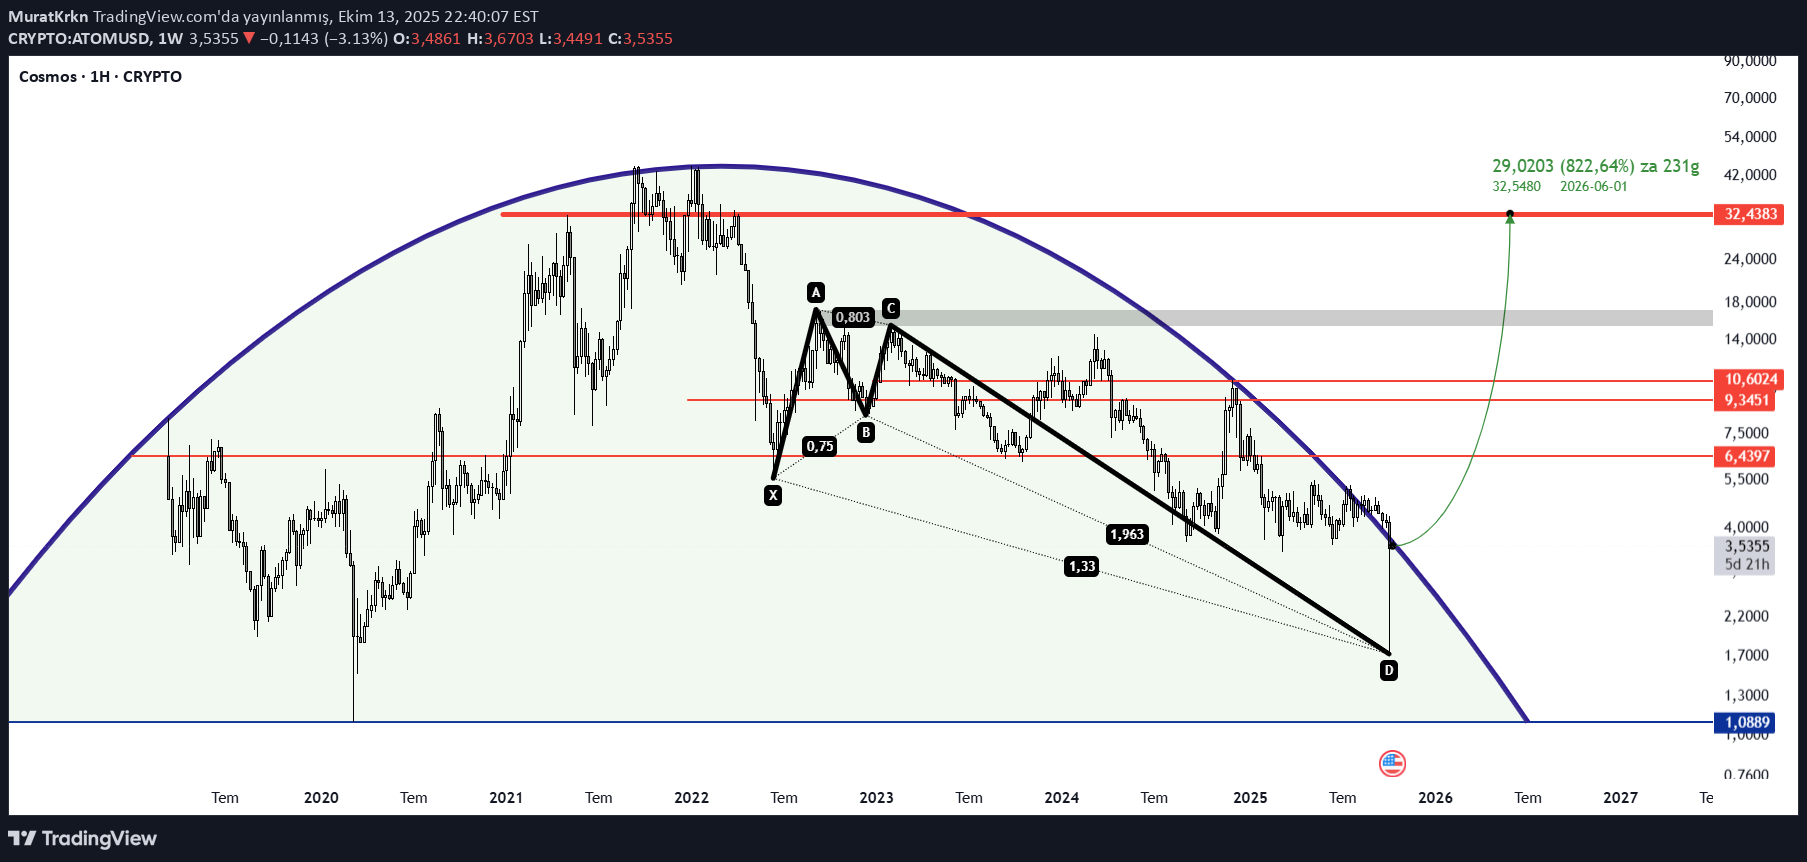
It's time for Atom to come out of the vegetative state. I don't want to overwhelm the chart by going into details. But let me tell you briefly, if it closes October around $10-12, I will expect it to close November around $17-21. If it reaches the areas I expect in November, I will be at the top level of $32 by the end of the year until the last week of December... Just watch, this week it will enter a relentless upward cycle with a day closing above 4.20...
MuratKrkn
انتظار پامپ کاوا (KAVA) تا پایان سال: تحلیل و اهداف قیمتی

MuratKrkn
AVAX | USD

Hello. Gentlemen Greens under the support of the weekly monthly as long as we do not close Long avax. Blue Search Resist. After the first region we have to overcome the blue, I will be waiting for orange -colored 54 and 109 levels. By the end of the year, I foresee that it will be a love of $ 109. It can be 109 in 3 months. 2 days left to enter the last quarter. If we throw it on 35 days in 2 days, it returns to the Bull market avax. The process we are under the controversy is between 27 38. Of course, if we go below 27, we will enter the deep liquidity operation and then the possibility of hanging up to $ 17. 27 I think it should be stopped, it makes more sense to be posing again when I close it.
MuratKrkn
AVAX | USD

Avax If it can earn $ 26, it can make rapid progress to target areas. With the closure of the day under $ 20, it can be entered from the current level to stop. The current structure is quite good risk reward rate. I foresee that an ascension wave starts in subcoins until October. The market can return to the bear again, but now we can see a green volatil environment, especially towards the end of August.
MuratKrkn

MuratKrkn
BTC|USD

These are the levels I find important. I don't think you can go to the red area above. Below is a very strong support zone of the blue and green area. Since this graph is a medium long term graphics, we need to see that we need to see at least weekly or monthly closing under the support or parabolic trend. In this context, 107k level should not be lost If it loses, we can experience a oscillation around 93 k 82 k .. Btcusd Btcusd BTC USDT .D BTC .d Btcusdt
MuratKrkn
ETH | USD

Hello! This is my bearish scenario for ETH. If we get a weekly or monthly candle close below the red lines above, I’ll be expecting a downward phase toward the 1930 levels within 1–2 months. However, if we can close July above 3725, then my bullish outlook will remain intact. ETHUSD ETHUSDT ETHUSDT.P ETH.D ETHBTC ETH ETHUSD ETHUSDT
MuratKrkn

Disclaimer
Any content and materials included in Sahmeto's website and official communication channels are a compilation of personal opinions and analyses and are not binding. They do not constitute any recommendation for buying, selling, entering or exiting the stock market and cryptocurrency market. Also, all news and analyses included in the website and channels are merely republished information from official and unofficial domestic and foreign sources, and it is obvious that users of the said content are responsible for following up and ensuring the authenticity and accuracy of the materials. Therefore, while disclaiming responsibility, it is declared that the responsibility for any decision-making, action, and potential profit and loss in the capital market and cryptocurrency market lies with the trader.