zenkedisi
@t_zenkedisi
What symbols does the trader recommend buying?
Purchase History
پیام های تریدر
Filter
zenkedisi
آپدیت بزرگ اتریوم: ساختار جدید بازار و نقطهی چرخش احتمالی صعودی!
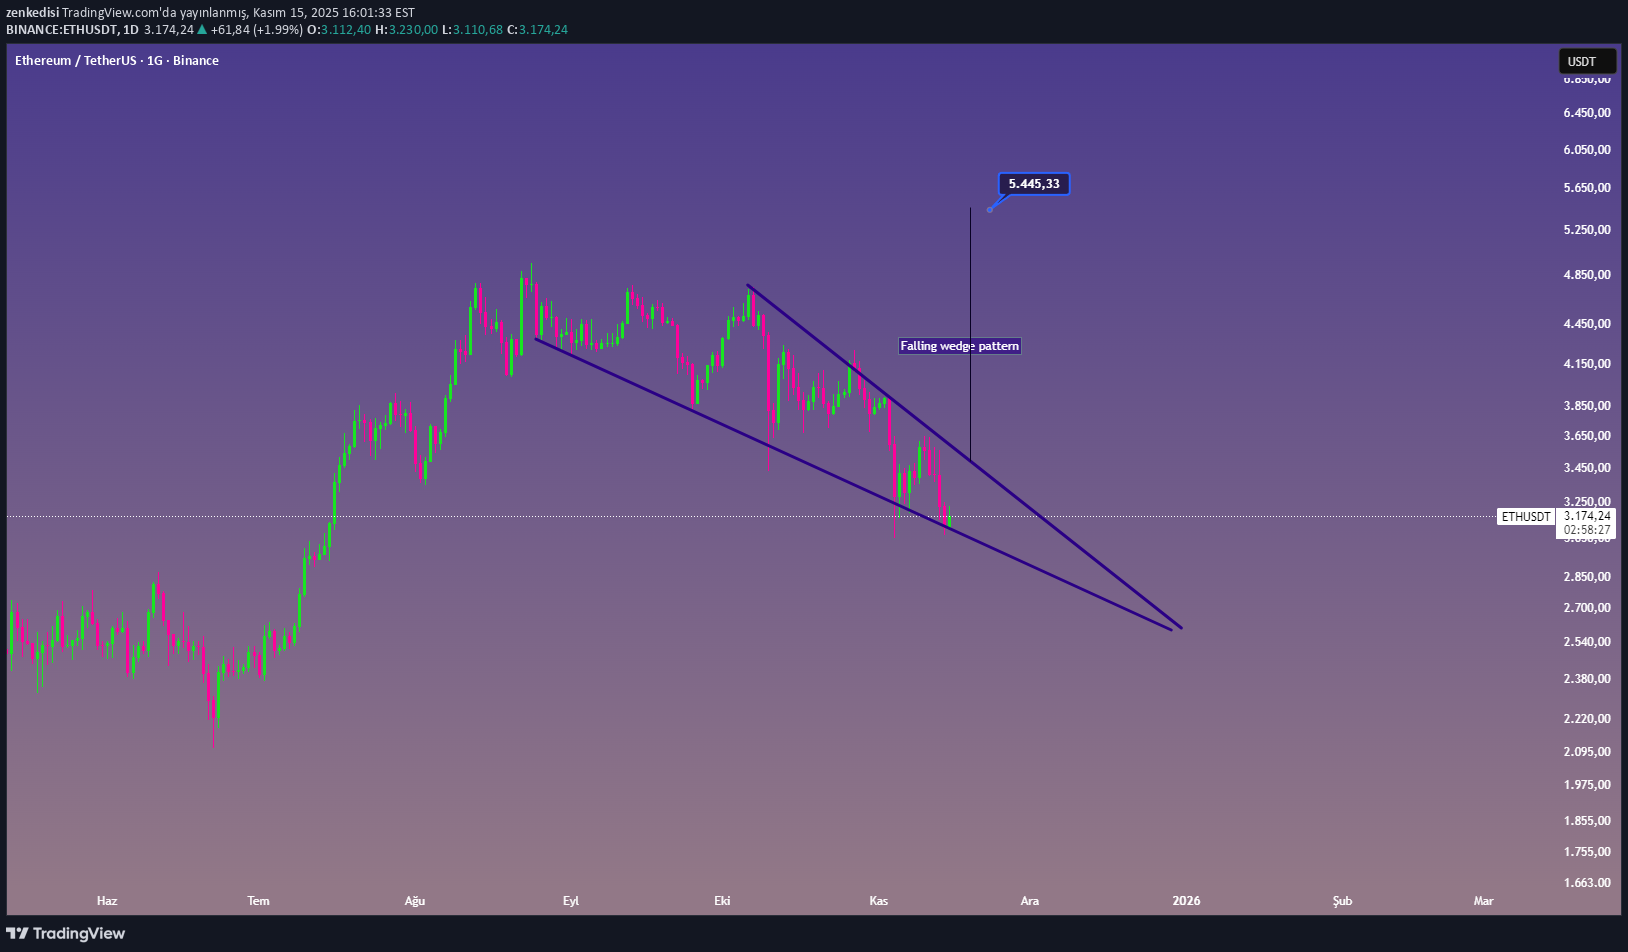
https://www.tradingview.com/x/sCItfzB7/ Since the previous structure was disrupted by deep needles and there was a hunt for liquidity, the broadening wedge pattern was canceled and continued with a descending wedge. Men are changing the structure and I am changing it too. We are looking at where it will come from. While everyone is saying that we have entered the bear season, we are looking for potential regions and structures that are at the beginning of the rise. Good luck to us.
zenkedisi
آپدیت جدید بیت کوین: آیا الگوی مگافون به پایان رسید؟ (تحلیل فنی و سرنخهای جدید)
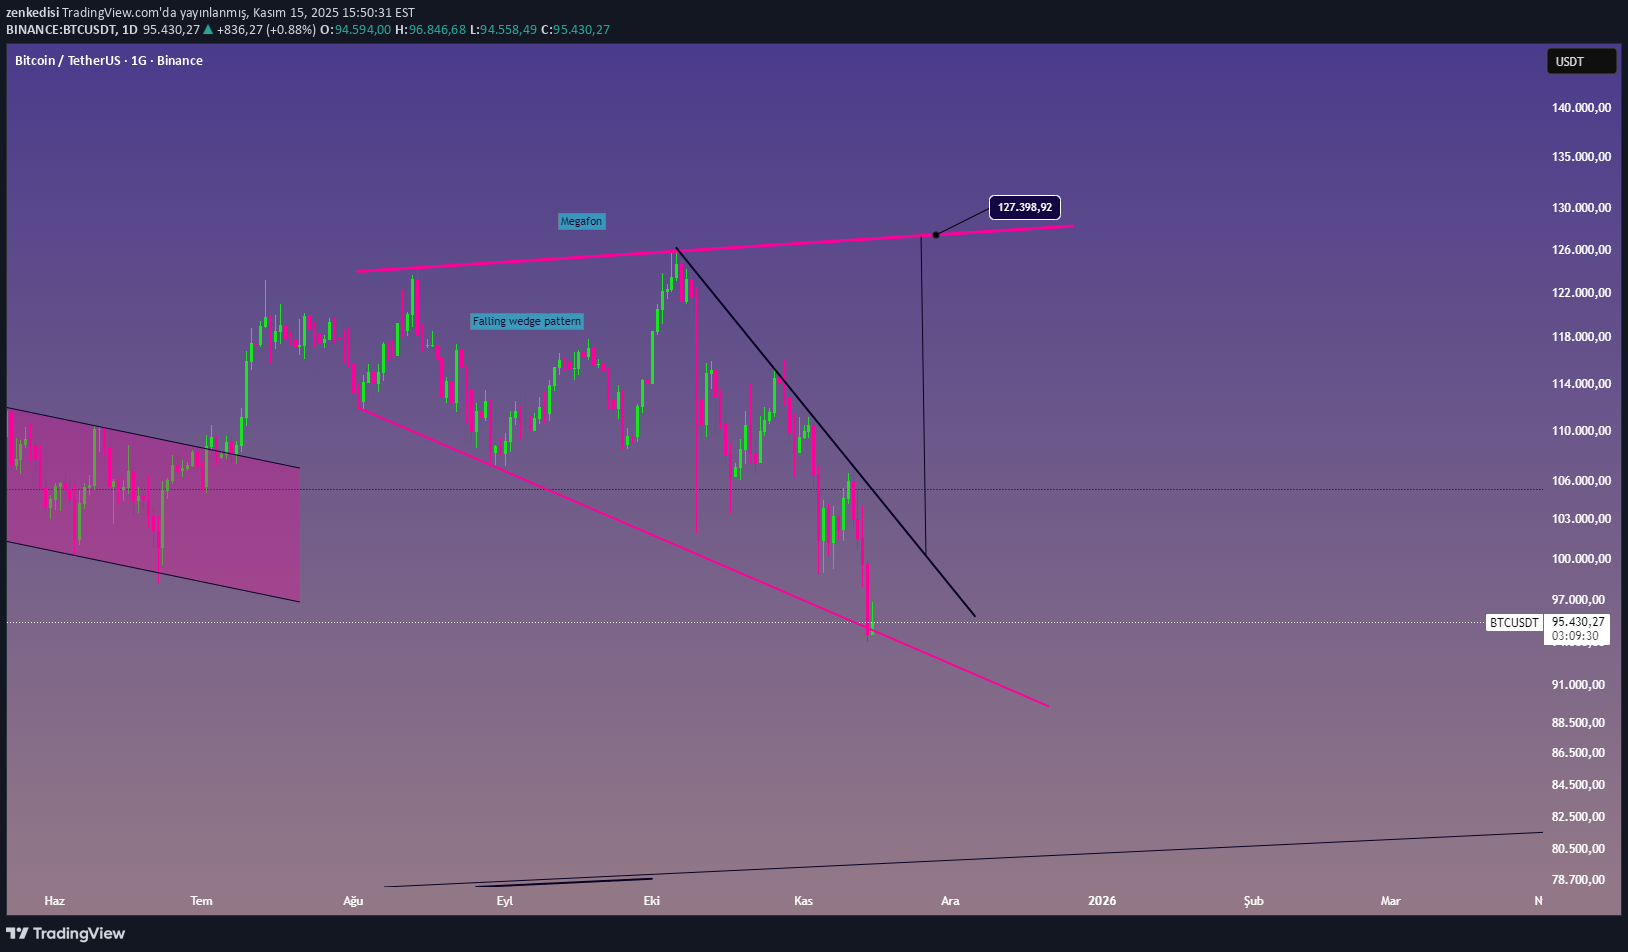
https://www.tradingview.com/x/Ttz7ojYf/ I updated the previous megaphone structure
zenkedisi
بیتکوین: آیا سقوط نهایی آغاز شده است؟ تحلیل الگوهای مرموز!
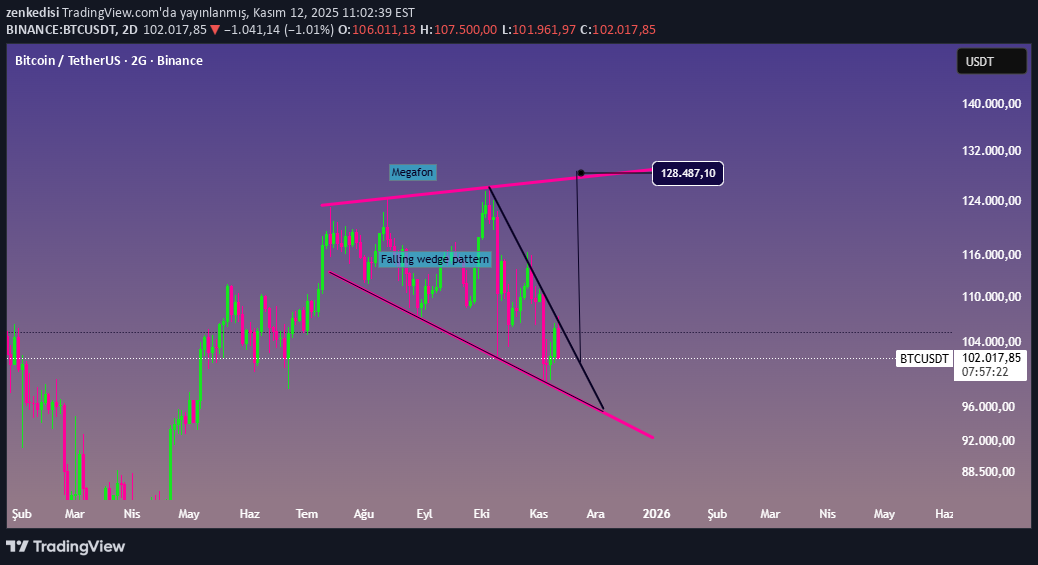
https://www.tradingview.com/x/kjREjmVl/ While following the megaphone structure, a descending wedge pattern has emerged, and the wedge target is the megaphone pattern break point. We are following
zenkedisi
آیا کاردانو (ADA) در خطر است؟ تحلیل هشداردهنده از ریزش بزرگ بعدی!
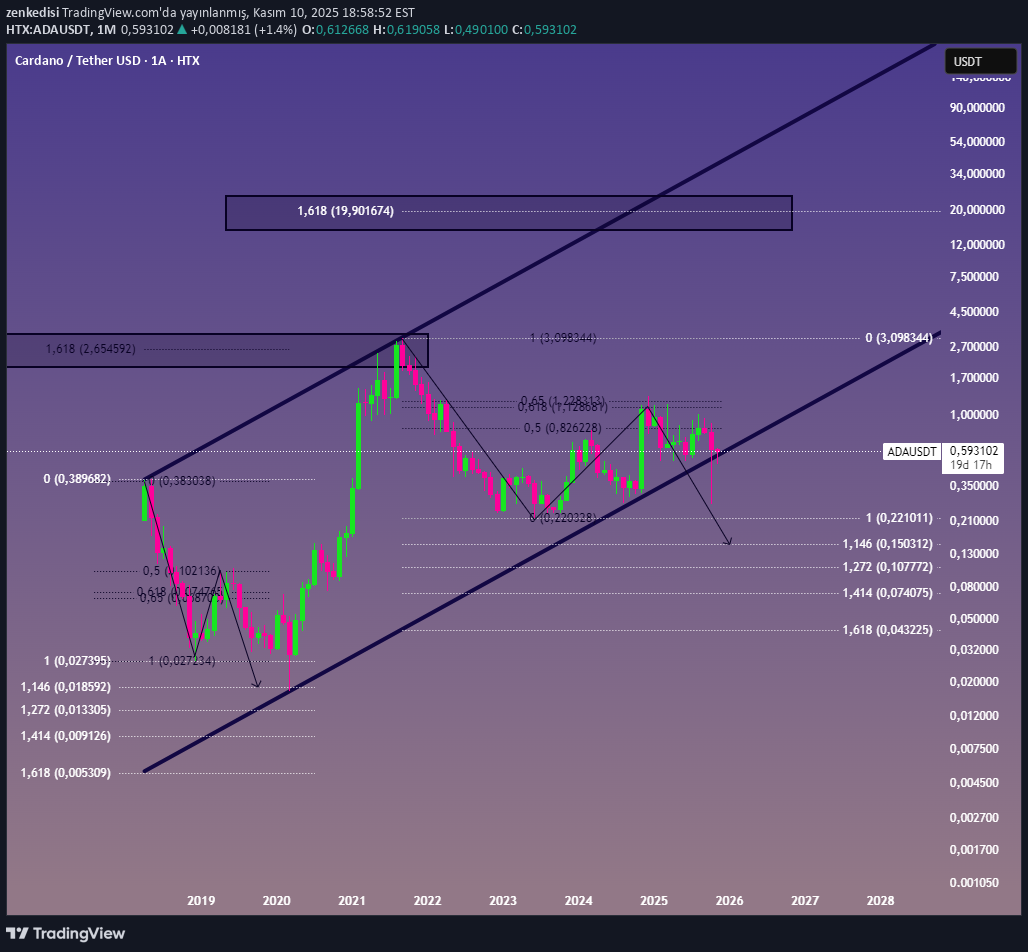
https://www.tradingview.com/x/XzJDj4PM/ Its first appearance on the market and the main downward movement was the main correction of the decline from 0.38 to 0.02, and the main target was a deep needle at Fib 1.146 by getting approval from Fibo 0.5. Now, the downward trend correction from 3 dollars to 0.22 has turned its main target downward by receiving approval from Fibo 0.618. In short, you should not buy unless it breaks 1 dollar, that is, the 0.618 confirmation zone, and you should not stay inside when it breaks 0.50 cents. It is very interesting that the Fib target set from 3 dollars to 0.15 cents is the upper band of the channel, that is, it will drop to 0.15 cents and hit the bottom there, but if it breaks 1 dollar, there is no problem, the rise will continue. The first drop is from 0.3 to 0.02, then the main target is 0.01. the current decrease is from 3 to 0.2, then the main target is 0.1 Is the similarity in the numbers a joke? I feel like the real deal is hidden here.
zenkedisi
تحلیل تکنیکال NEAR: 3 الگوی قدرتمند و هدف قیمتی 80 دلار!
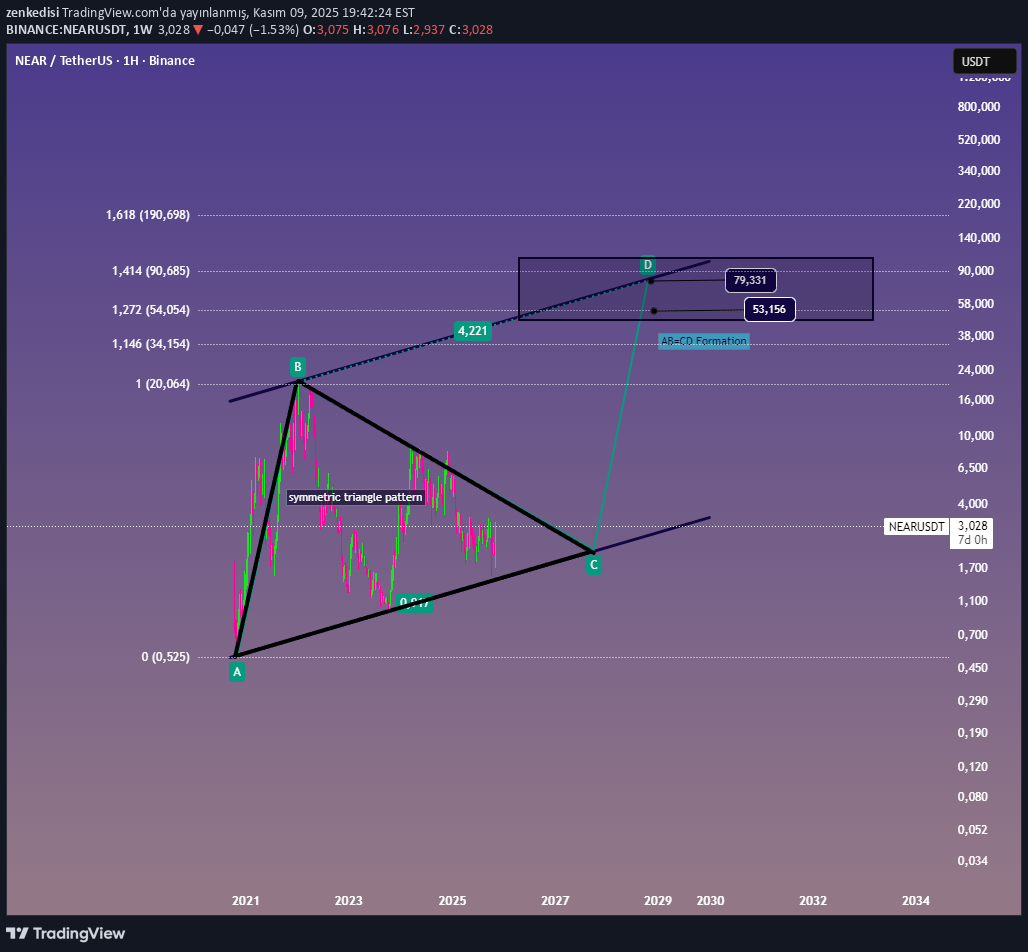
https://www.tradingview.com/x/dbPVsCcb/ Rising channel pattern symmetrical triangle pattern AB=CD formation We support the structure with three main formations fib targets are available on the chart. The target of 3 formations and fibin is 80 dollars, there must be a structure so that our rally targets can be achieved, the throne will not rise from where it stands without any reason. Do not forget to comment and follow
zenkedisi
تحلیل فنی فایل کوین (FIL): راز الگوی گُوِه نزولی و سطوح کلیدی قیمت!
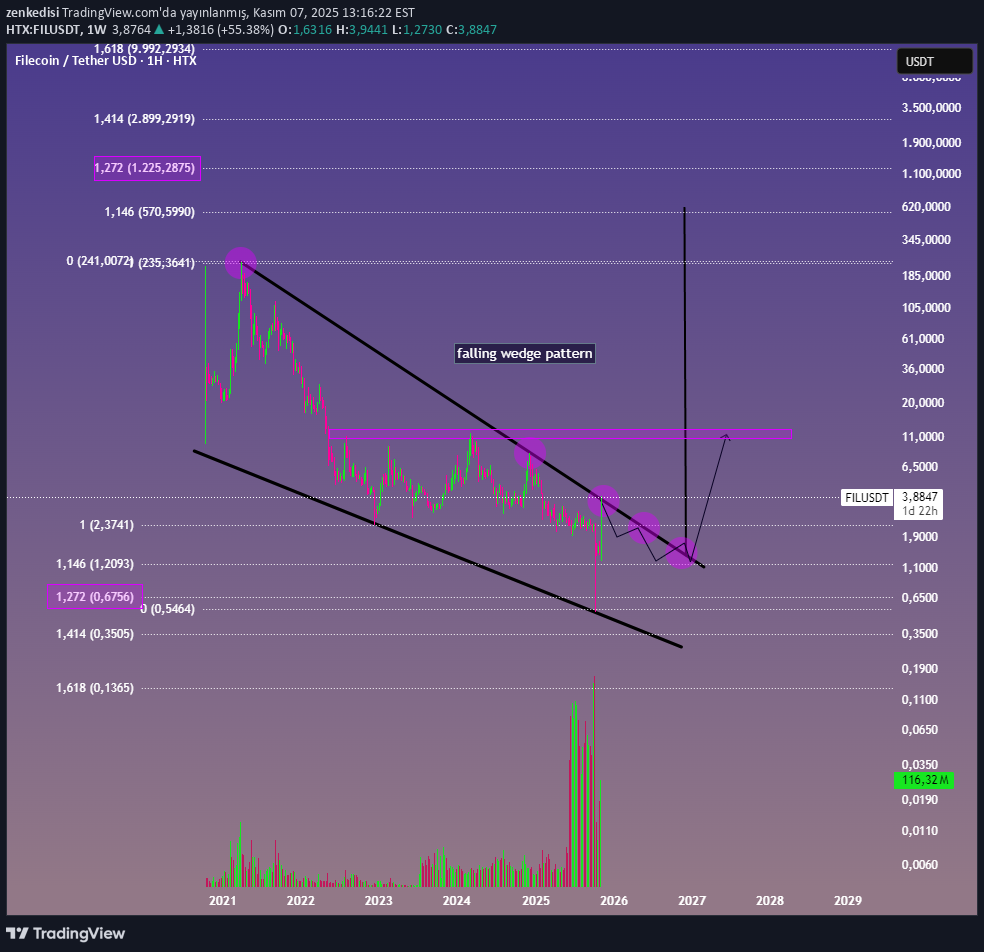
https://www.tradingview.com/x/NjPPp0E4/ The falling wedge pattern formed in the main structure remains fakeout at the first break in 99% of cases, so the structures generally break at the 4th and 5th contact, so you have to be careful. If it found a buyer at 1.272 on the downside, it needs to target the 1.272 level on the upside, so the first contact must remain fakeout so that it can release downwards and move the structure target to 1.272, or even if we say the worst target is the old peak, its target must remain on the structure. However, even if it goes, you don't have to ask why it went at the first break, you had to buy it at the bottom, it's over now :) What is written are my own comments and opinions, buying and selling is not recommended. risky...
zenkedisi
تاییدیه برگشت بیت کوین از کف الگوی مگافون: فرصت خرید در این ناحیه حیاتی!
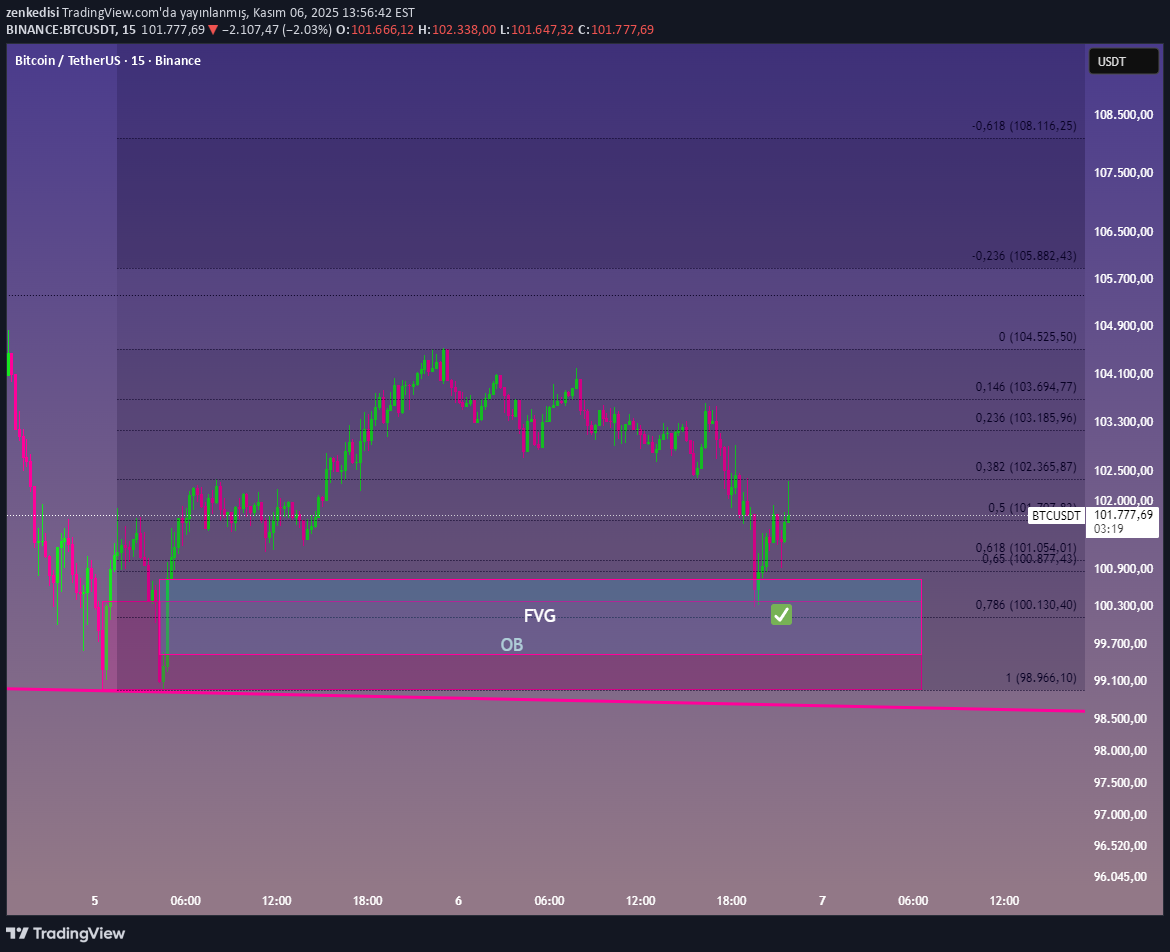
https://www.tradingview.com/x/DZXINc96/ The building is in the process of receiving approval from Order Block and Fair Value Gap under the daily megaphone
zenkedisi
تحلیل آواکس (AVAX): هدفهای صعودی بلندمدت و کوتاهمدت تا ۱۰۰ دلار!
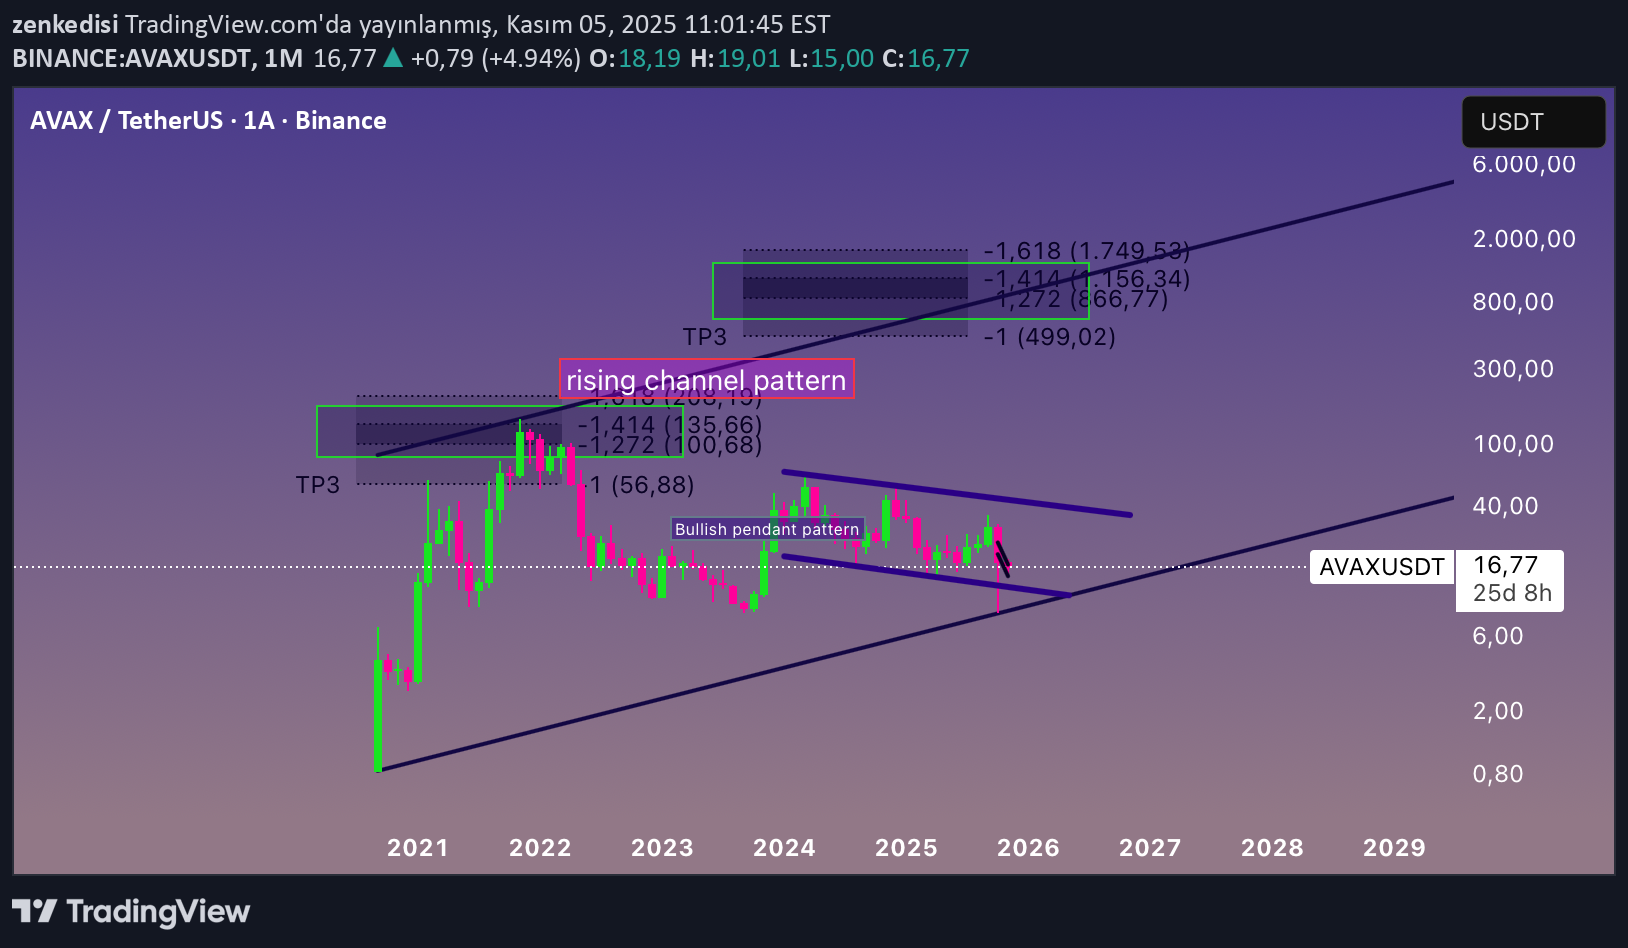
https://tr.tradingview.com/x/6iiOJIn3 Rising channel pattern If we expect an increase, it must be due to the structure and this must be with long-term contacts under the channel so that there is a reason for it to move to the upper channel band. If there is no structure, there is no rise. Short term bullish pendant pattern Bull flag priority appears to be $100 Main target fib levels You can follow the levels We see which Fib level it reached in the previous rally and we can guess where it is targeting now.
zenkedisi
خرید کاوا (KAVA): سه مرحلهای که باید بدانید!

https://www.tradingview.com/x/JiDySspF/ I made a spot purchase and I'm uploading it here as a souvenir from 3 levels. Good luck :)
zenkedisi
پایان صعود پارابولیک طلا؟ نشانههای هشداردهنده برای سرمایهگذاران اونس
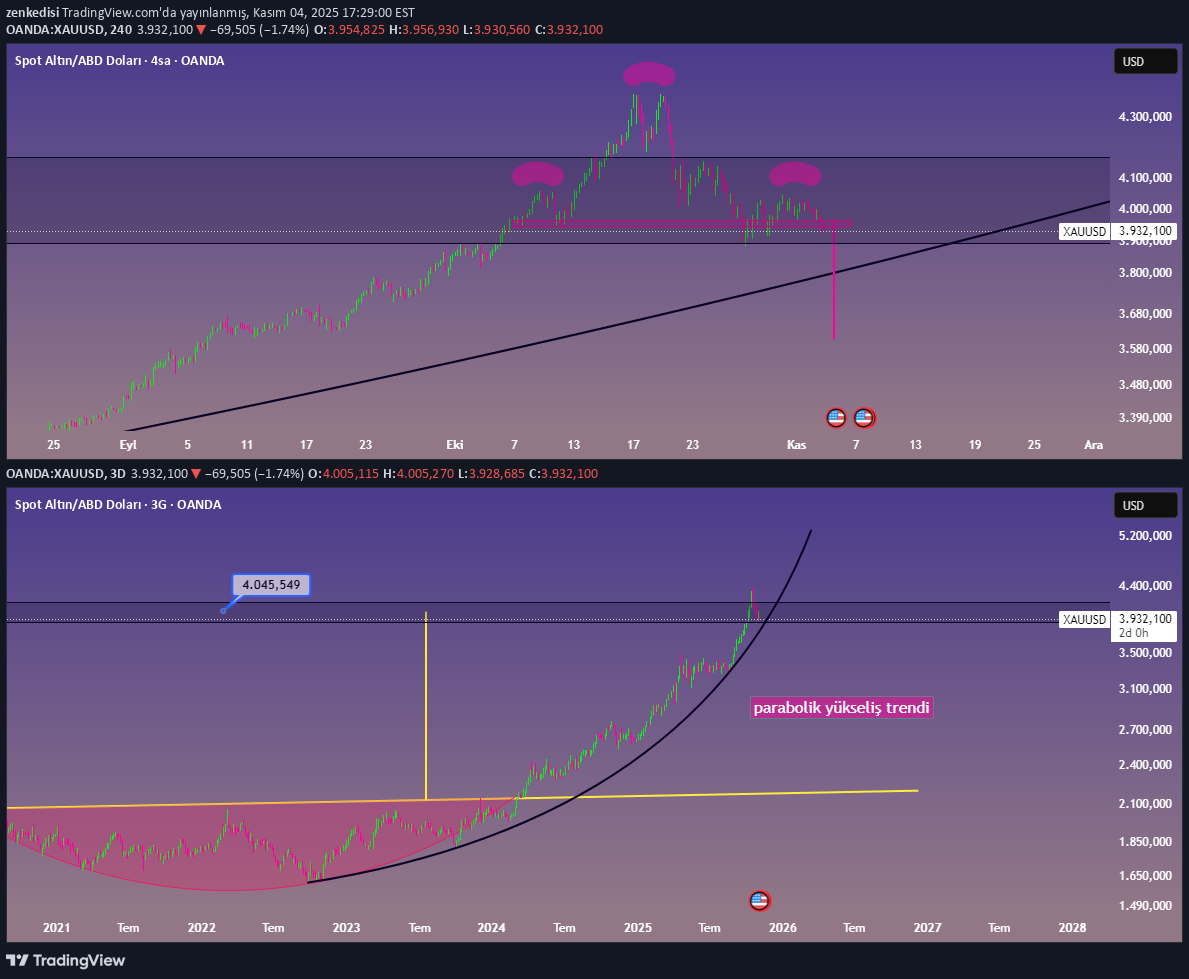
https://www.tradingview.com/x/r8v77iJQ/ Breakout formations are formed in the 4h time frame under the parabolic uptrend of ounce gold. Those who are making a purchase should not catch the falling knife.
Disclaimer
Any content and materials included in Sahmeto's website and official communication channels are a compilation of personal opinions and analyses and are not binding. They do not constitute any recommendation for buying, selling, entering or exiting the stock market and cryptocurrency market. Also, all news and analyses included in the website and channels are merely republished information from official and unofficial domestic and foreign sources, and it is obvious that users of the said content are responsible for following up and ensuring the authenticity and accuracy of the materials. Therefore, while disclaiming responsibility, it is declared that the responsibility for any decision-making, action, and potential profit and loss in the capital market and cryptocurrency market lies with the trader.