ICX
ICON
| تریدر | نوع سیگنال | حد سود/ضرر | زمان انتشار | مشاهده پیام |
|---|---|---|---|---|
No results found. | ||||
Price Chart of ICON
سود 3 Months :
سیگنالهای ICON
Filter
Sort messages by
Trader Type
Time Frame

CryptoNuclear
ICX/USDT — Descending Triangle, Breakout or Breakdown?
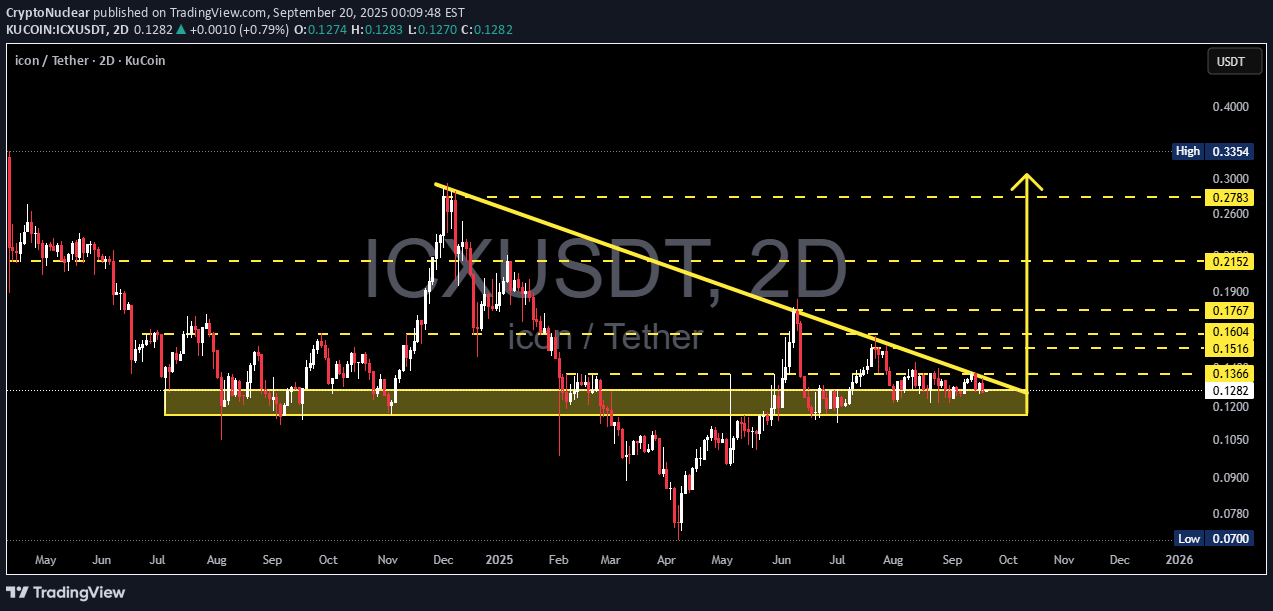
Overview ICX is currently at a critical stage. Price has been consolidating for months within the strong demand zone at 0.11–0.13, while being consistently pressured by a descending trendline from late 2024 highs. This structure has formed a Descending Triangle / Compression pattern, where volatility is contracting, signaling that a major move is imminent. The setup is classic: the longer the squeeze, the stronger the breakout when it comes. The question is — will ICX break to the upside or collapse below support? --- Key Levels Demand zone (major support): 0.11 – 0.13 Immediate resistance (trendline + horizontal): 0.1366 Upside resistance targets: 0.1516 → 0.1604 → 0.1767 → 0.2152 → 0.2783 → 0.3354 Breakdown targets: 0.09 → 0.07 --- Pattern Explanation Descending Triangle: consistent lower highs (selling pressure) while buyers defend a flat support zone. Statistically, this pattern leans bearish, but when it forms near a strong demand zone after a prolonged downtrend, it can also serve as a base for reversal. ICX is now at the apex of the triangle → volatility has compressed and a breakout/breakdown is highly likely soon. --- Bullish Scenario Trigger: a 2D close above the descending trendline with rising volume. Additional confirmation: successful retest of the breakout zone around 0.1366. Upside targets: TP1: 0.1516 TP2: 0.1604 – 0.1767 TP3: 0.2152 Extended: 0.2783 → 0.3354 Stop Loss: below demand zone (~0.105) --- Bearish Scenario Trigger: a 2D close below 0.11–0.105 with strong selling volume. Downside targets: Initial: 0.09 Extended: 0.07 (major chart low) Stop Loss for shorts: reclaim above 0.13–0.1366 --- Sentiment & Momentum Volume: currently declining, showing the market is waiting for a trigger before the next big move. Momentum: RSI & MACD remain neutral, supporting the potential for a strong move once breakout occurs. Market structure: If support breaks → fast drop toward 0.09–0.07 If support holds → strong base for mid-term reversal --- Conclusion ICX is at a make-or-break point: Bullish case: breakout above trendline could ignite a rally toward 0.15–0.21 and beyond. Bearish case: breakdown below support opens the path to 0.09 or even 0.07. Wait for 2D close with volume confirmation before entering. Manage risk properly — this is not the place to trade without discipline. Not financial advice — purely technical analysis. DYOR & use risk management. --- ICX/USDT is forming a Descending Triangle at the 0.11–0.13 demand zone. Volatility is tightening → expect a major breakout or breakdown soon. ✅ Bullish: 2D close > trendline → targets 0.1516 / 0.1767 / 0.2152 ❌ Bearish: 2D close < 0.105 → targets 0.09 / 0.07 Watch volume + 2D close for confirmation. Trading without risk management = suicide. --- #ICX #ICON #ICXUSDT #CryptoAnalysis #TechnicalAnalysis #DescendingTriangle #SupportResistance #Breakout

VitalyKaminsky
ICXUSDT.P
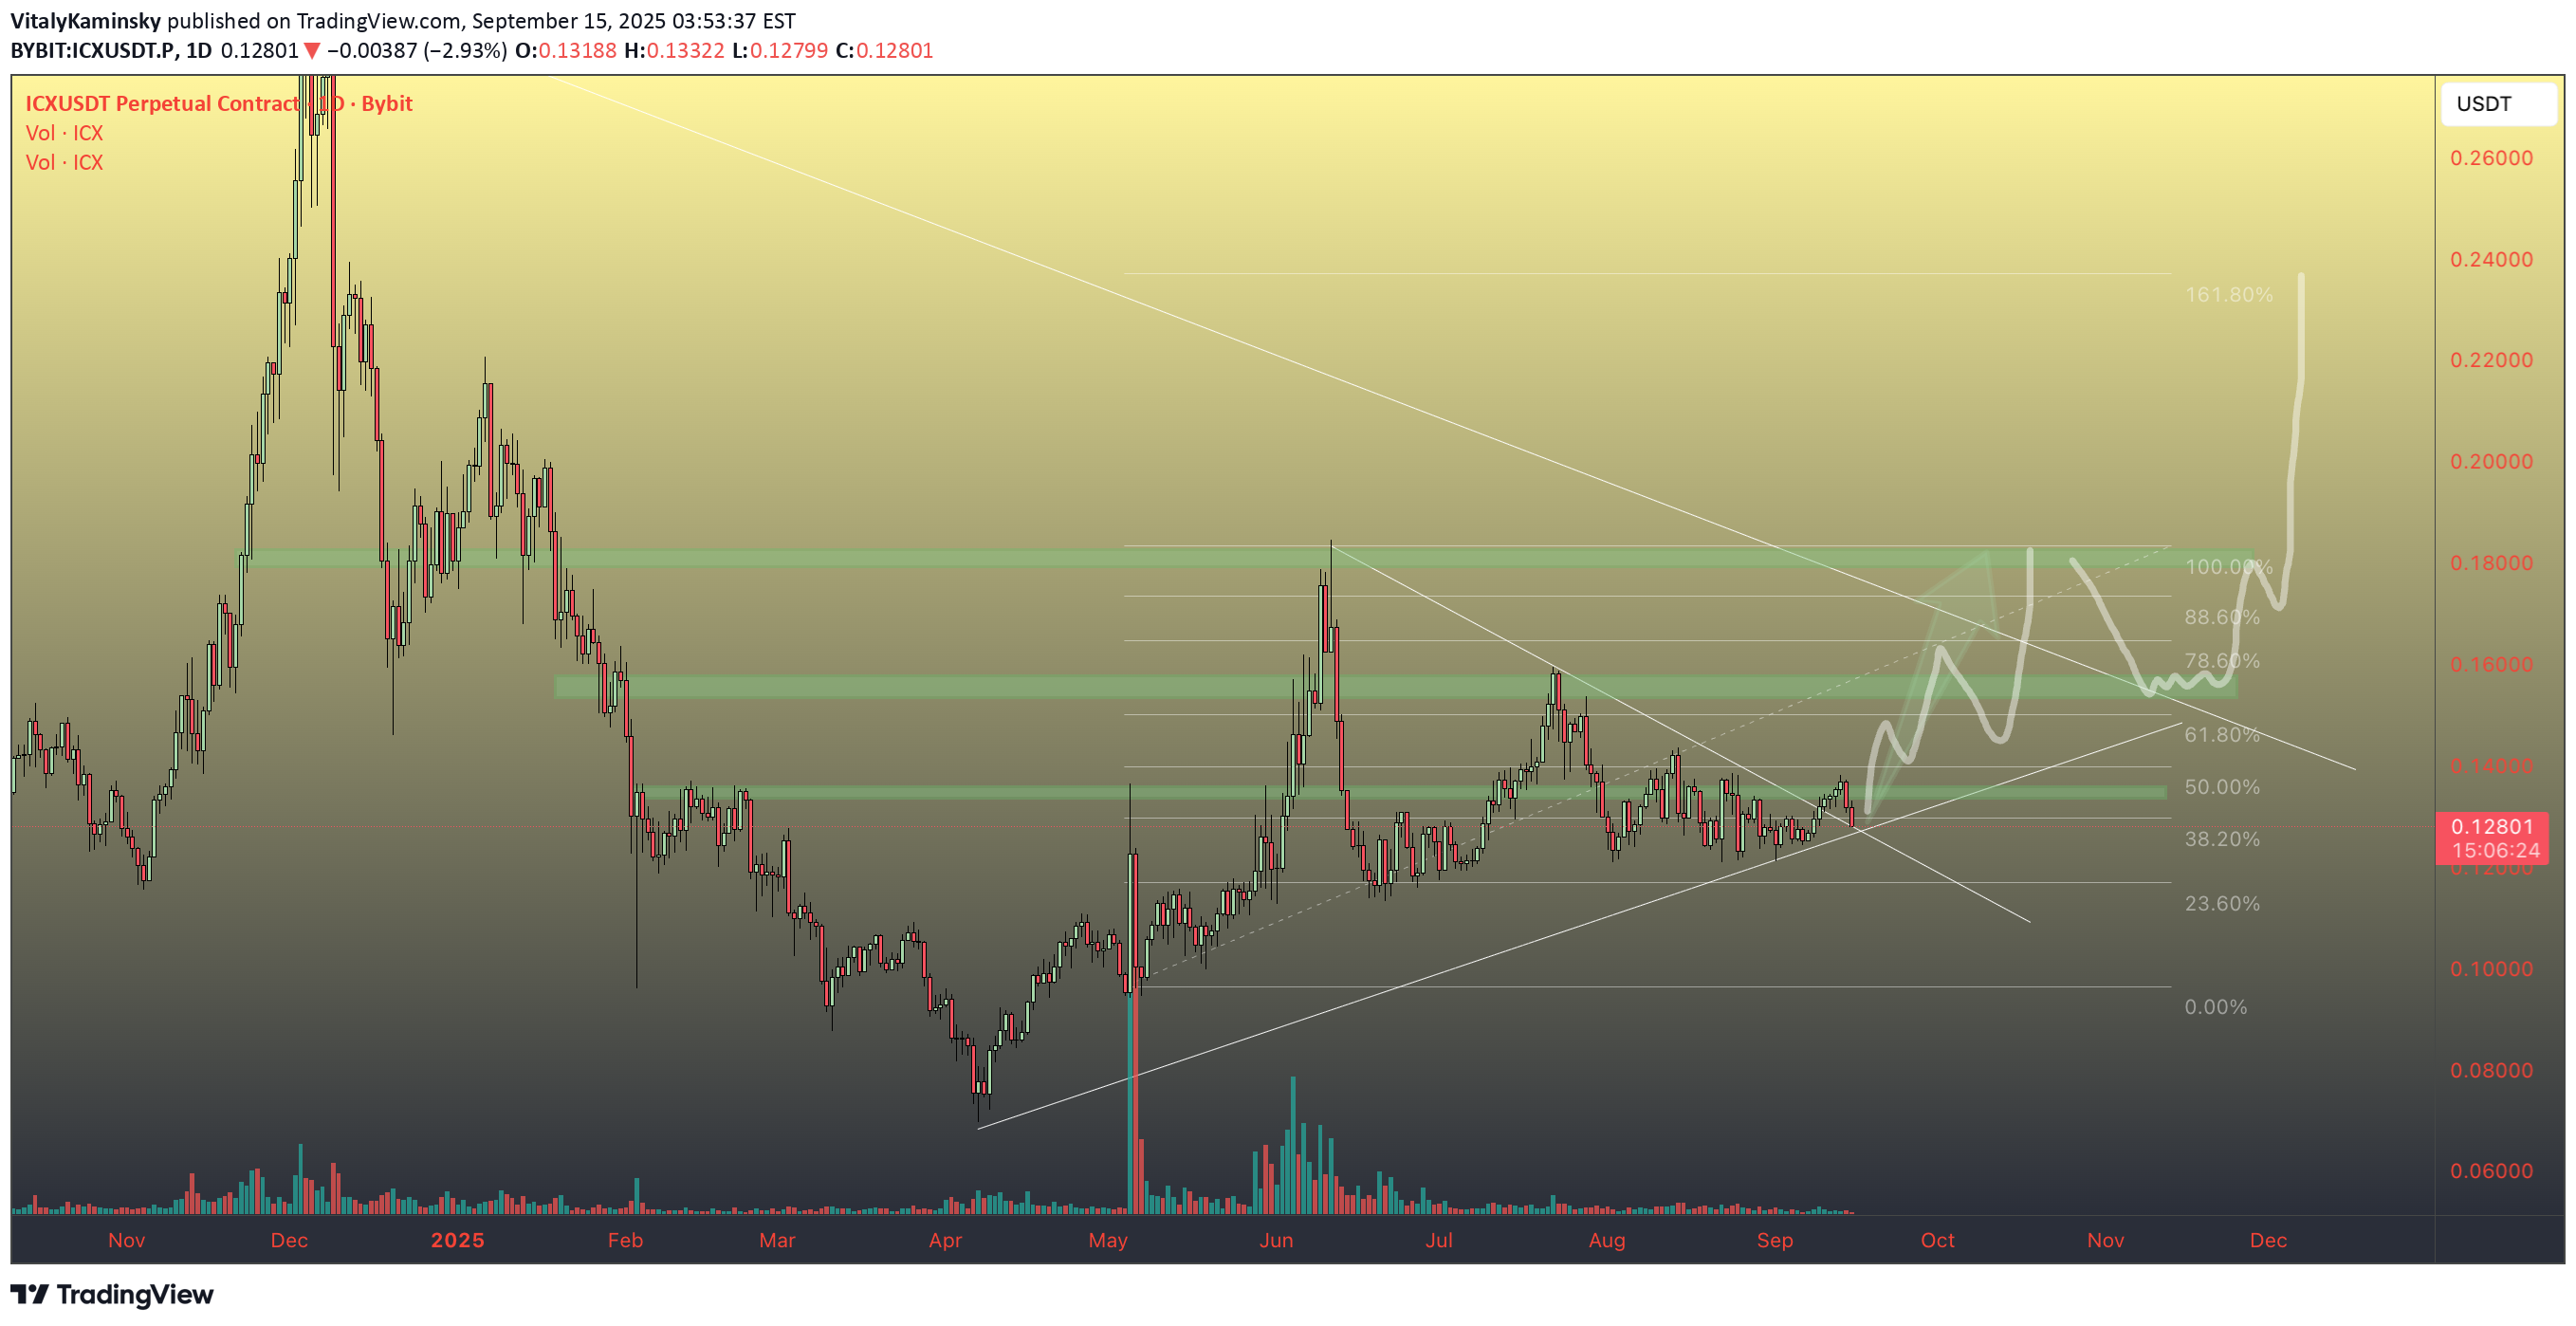
I expected this drawdown on Friday, so I closed all positions and on Sunday I gained positions every time we went lower! Because this week I expect activity on the market! Especially on September 17! There is some anxiety on the market, but it's all manipulation and games! There should be growth before the New Year! And this is my and your chance!
VitalyKaminsky
ICXUSDT
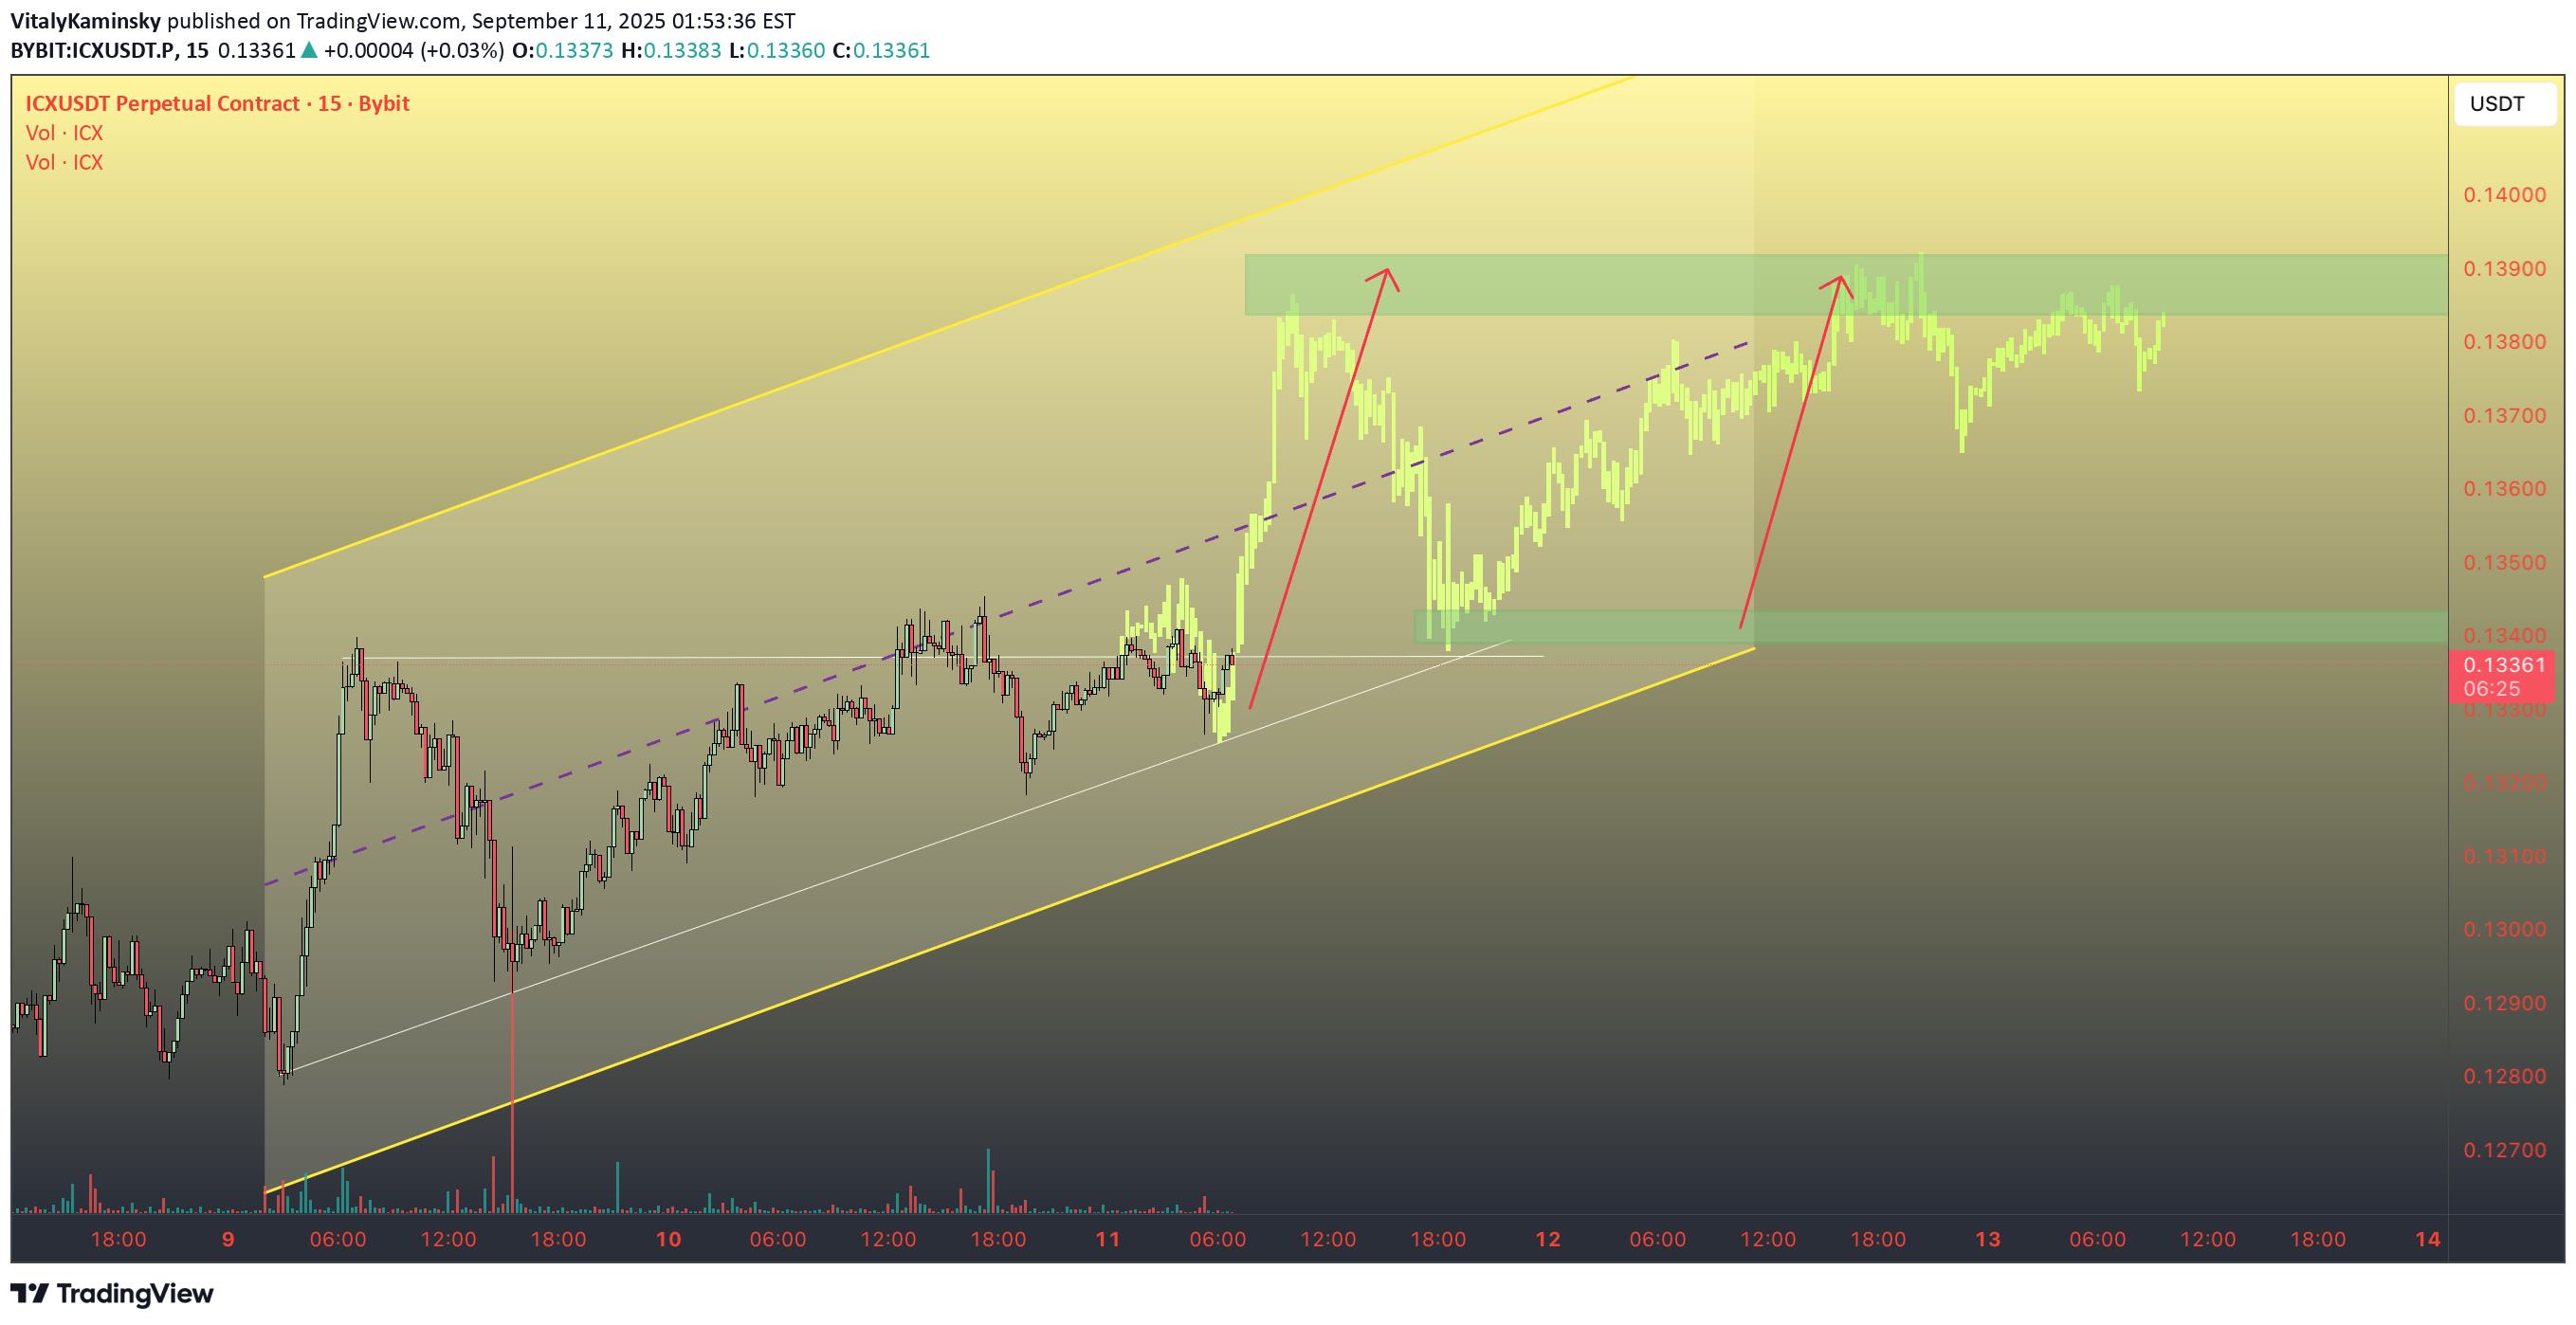
OLD COIN BE PUMP IT I am watching the market as old coins wake up after a very long hibernation! There will be more strong growths until the end of the year! There is an opportunity to make money!

vf_investment
ICXUSDT still neutral
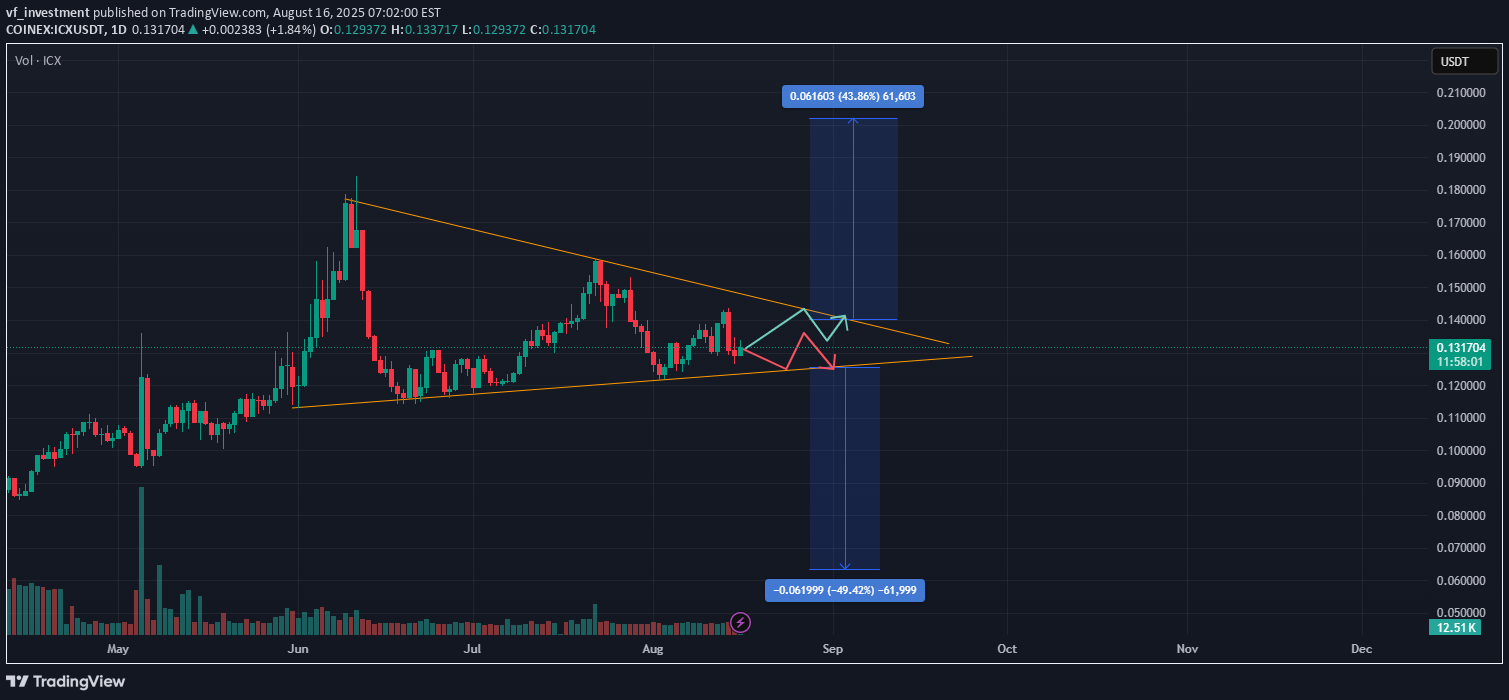
hi Traders The price is currently consolidating inside a symmetrical triangle pattern, which is generally considered a neutral formation. This suggests that the market is waiting for a clear breakout direction before committing to a trend. 🔹 Bullish Scenario: If the price breaks out to the upside, the target would be around 0.193 USDT (approx. +43.86% from the breakout). 🔹 Bearish Scenario: If the price breaks down from the triangle, the target would be around 0.067 USDT (approx. -49.42% from the breakdown). 📌 Trading Plan: Wait for a confirmed breakout (daily close above resistance or below support). Avoid entering while the price remains inside the triangle since false breakouts are possible. The volume is very low now. Look for the volume surge at the breakout to avoid trading at the false breakout. Risk management is essential given the potential for large swings in either direction.

PriceSurgeon


asilturk
ICX Fırtına Öncesi Sessizlik Diyebiliriz
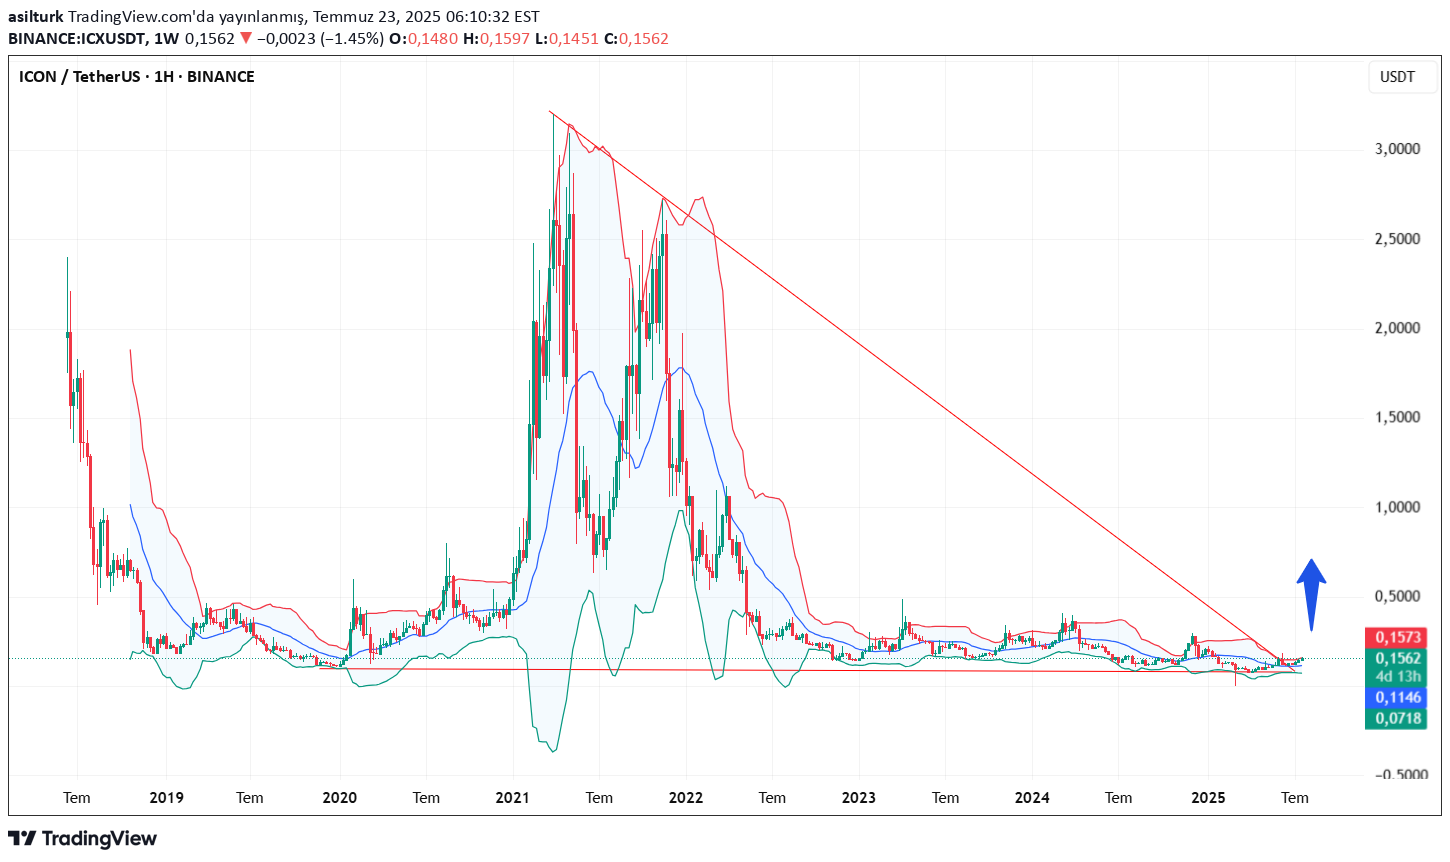
While we look at the market value of $ 169 million when we look at the maximum unlimited menstruation can be printed, although the maximum unlimited menstruation can be printed 1 billion pieces of 1 billion units at the moment of the price of 1 billion cents, but ICX We need to know the basis of the South Korean -based ICON Foundation and Iconloop developed by the cross -chain (blockchain ventilation) contract platform. 150,000 ETH collected from ICO in 2017; In January 2018, the ICON network, whose purpose is to connect the “Digital Nation” model and independent blockchains, has initiated and provides between different blockchains between chain token and intelligent contract calls in fact DPOS + LFT (Loop Fault tolerance) Extensive integration is achieved, for example, with the capacity of thousands of transactions/min capacity per hour, scalability is prominent with institutions such as South Korean Government and LINE, and partnerships with institutions such as LINE give strong confidence and tokenization and Dapp ecosystem developed ... When it comes to disadvantages, Ethereum, Polkadot, Cosmos, Avalanche have not yet reached a wide range of platforms such as platforms. Coordination management can be difficult due to multiple community and validator structure. When it comes to the technical dimension of the business, I think that it is one of the times to be opened, especially in futures, especially in futures, of course, of course for you to icon I do not specify the price in the analysis, the target point, the pivot point or something is nonsense, I think that a structure that changes with volume for all of the high volume for this reason for this reason high prices means that the target does not specify for those who say that the target is definitely boza (human) ..... Personal notes are not investment advice.
vf_investment
ICXUSDT (Bullish Divergence) - long
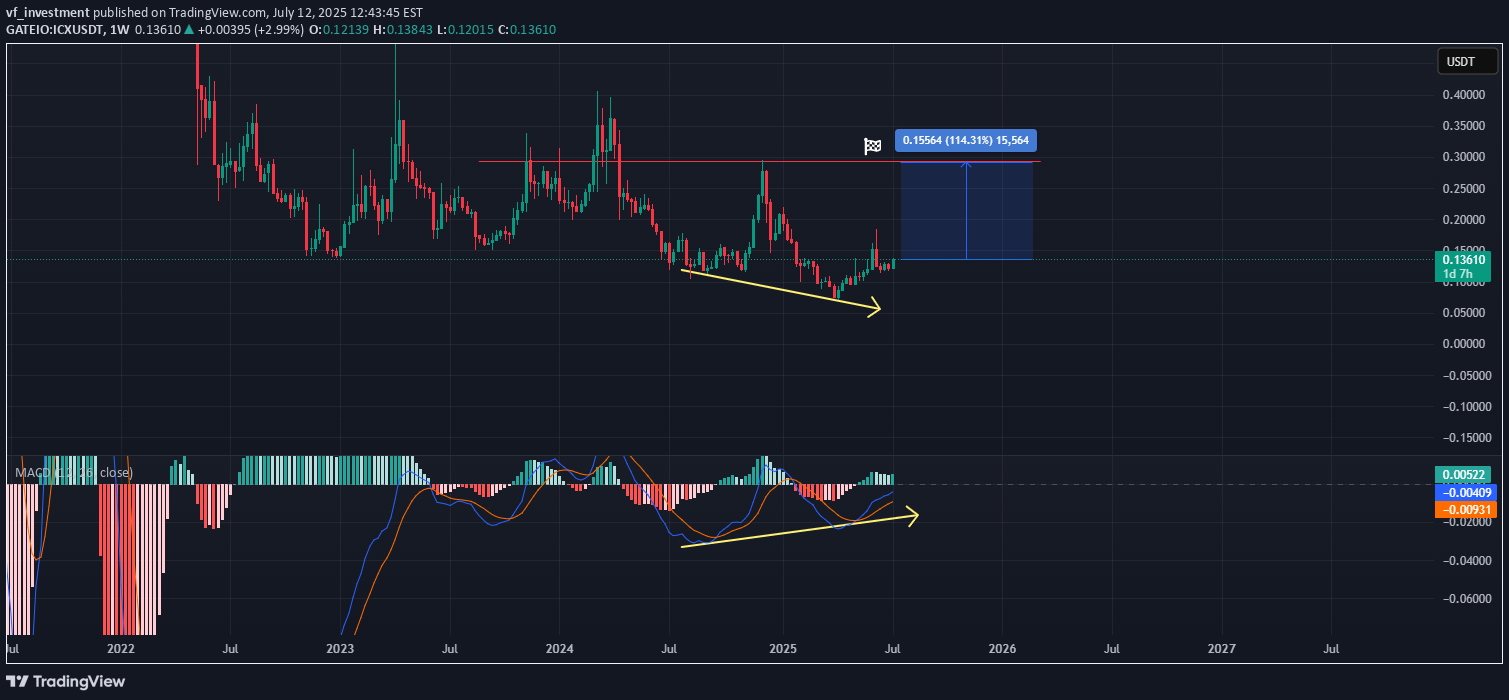
hi traders I'm very bullish on ICXUSDT. The chart displays a bullish divergence between the price and the MACD indicator. The price (top panel) has made lower lows (yellow downward arrow), while the MACD (bottom panel) has made higher lows (yellow upward arrow), indicating weakening bearish momentum and potential for a reversal. Entry: Current price around $0.1358. Consider entering long at current levels or on a confirmed breakout from consolidation. Target: The blue box indicates a target zone around $0.28-$0.30, which represents a potential 114.31% increase and aligns with previous resistance. Rationale: The bullish divergence suggests that the selling pressure is waning, and a move higher is probable, aiming for the key resistance level.ICX is ready. I expect a big move within the next 2 weeks

EdoardoTelve
ICX/USDT – Bullish Breakout Confirmed, Eyeing Higher Targets

Date: June 9, 2025 ICX/USDT has officially broken out of a key consolidation range and is now entering a new bullish phase. With momentum rising and volume supporting the move, the path of least resistance remains to the upside. 📊 Technical Overview: Current Price: $0.1672 Key Support Zone: $0.1393 Resistance Levels: Short-term: $0.3000 Mid-term: $0.4000 📈 Indicators: RSI: At 76.50 – entering overbought territory, but confirms strong bullish momentum. EMA Alignment: Price is well above all major EMAs (4, 50, 100, 200), confirming trend reversal and bullish structure. 📉 Volume: A spike in volume confirms genuine interest behind the breakout. This is not a low-liquidity move, but a meaningful shift in market structure. 🔍 Chart Structure: ICX broke through horizontal resistance with strong price action. RSI has broken above the 70 mark, confirming bullish momentum. Previous accumulation zone ($0.13–$0.14) now acts as strong support. 🎯 Upside Targets: First Major Target: $0.3000 – previous significant resistance Second Major Target: $0.4000 – historical supply zone from December highs 📉 Invalidation Zone: A breakdown below $0.1393 would invalidate the current bullish setup and suggest a re-entry into consolidation. Good Trading!!choppy and almost flat.

Alpha-GoldFX
ICXUSDT Forming Bullish impulse

ICXUSDT has recently shown a strong bullish impulse, followed by a healthy pullback forming a classic bull flag or V-shaped recovery pattern. This setup often signals continuation of the uptrend, especially when supported by solid trading volume, as seen in the recent sessions. The consolidation and subsequent breakout reflect growing investor confidence, making ICX an attractive short-term trading opportunity with an expected gain of 20% to 30%+.ICON (ICX) is one of the older blockchain projects that has managed to maintain its relevance through consistent updates and ecosystem expansion. As the altcoin market shows signs of revival, mid-cap coins like ICX are starting to attract attention from both retail and institutional traders. The recent price action confirms that ICX is gaining traction, with the breakout targeting a significant resistance zone in the $0.19-$0.21 range.Traders looking for momentum plays should watch ICXUSDT closely. If the price sustains above the $0.1550 breakout level with increasing volume, it could mark the beginning of a new leg upward. Additionally, the current structure on the 4H chart is providing clean technical entries with tight risk, making this trade setup highly favorable for swing and day traders.This move is backed by both technical pattern recognition and on-chain interest metrics, which hint at potential accumulation. With sentiment improving and key resistance levels within reach, ICX could deliver a rapid upside move in the coming days.✅ Show your support by hitting the like button and✅ Leaving a comment below! (What is You opinion about this Coin)Your feedback and engagement keep me inspired to share more insightful market analysis with you!

MasterAnanda
The Trading Rookie, How I Don't Make Money Fast & Waste Time
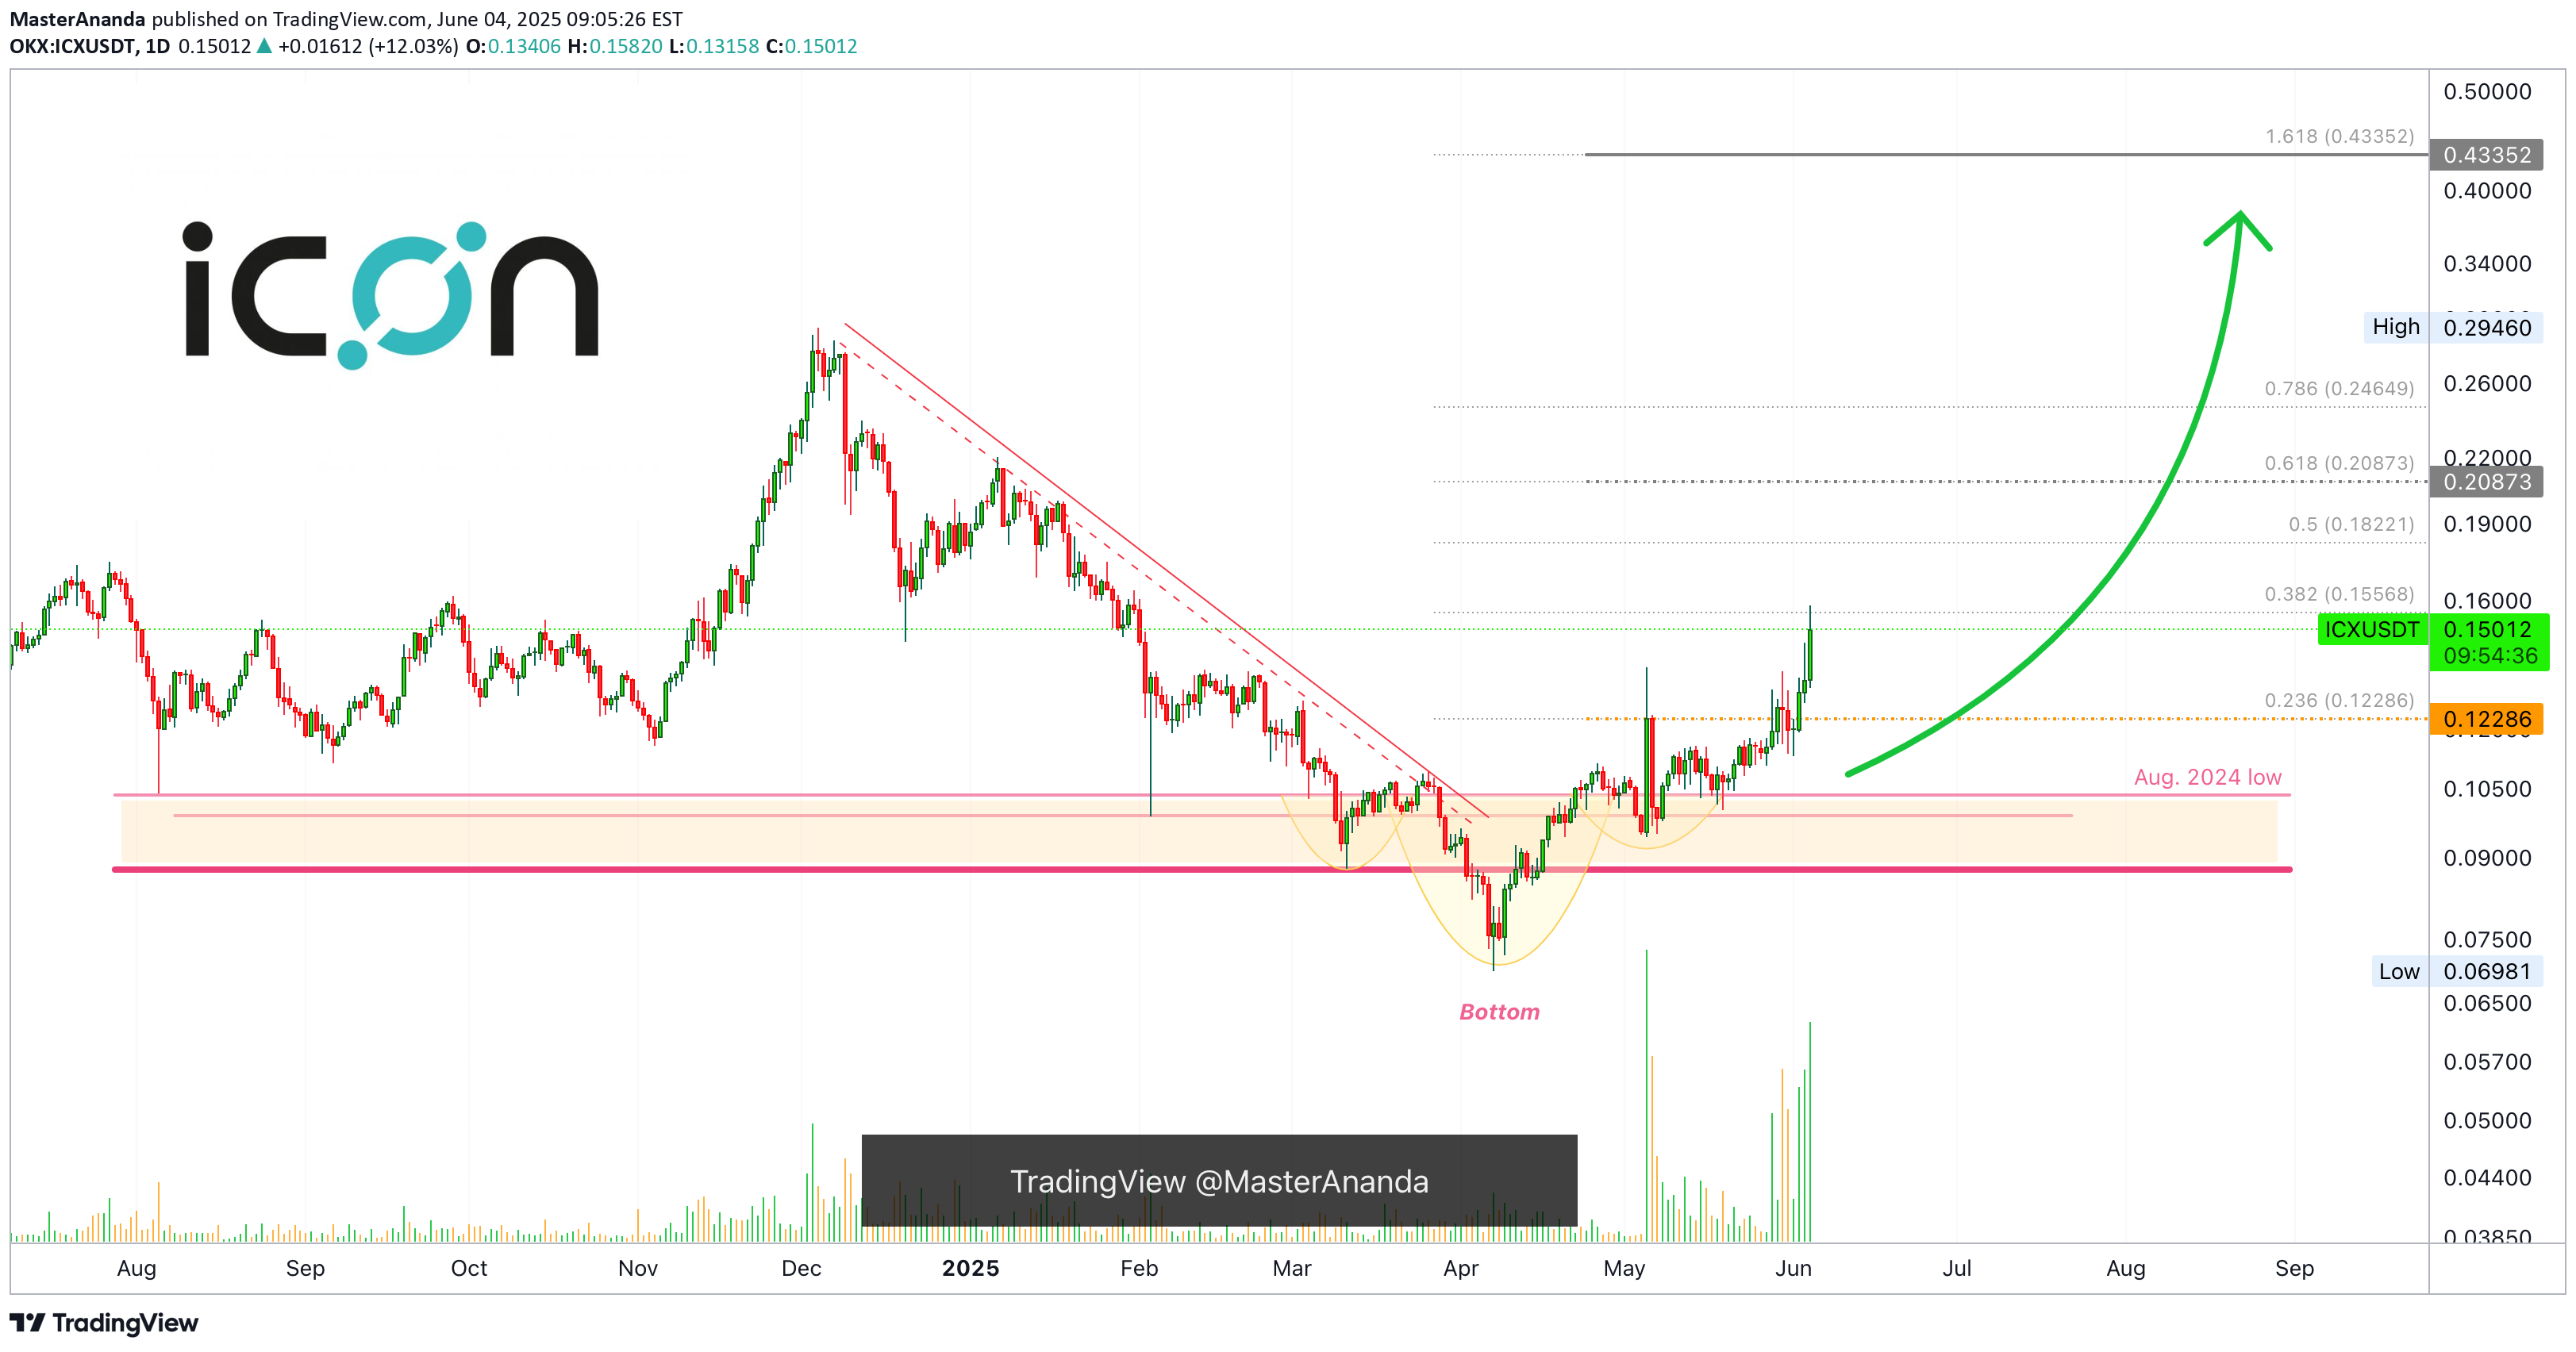
The bottom is set and once the bottom is in bullish momentum builds up and grows. Bullish momentum is now present on this chart coupled with really high volume. The high volume is what confirms the current move being real and strong. ICXUSDT daily.When they are not moving nothing can move them. But when they move they move.We have the bottom and this is good so we only need a continuation and the continuation will come. Notice that this is the same chart as other altcoins, most altcoins.This is very simple. I just wait.If you jump in without a plan and prices retrace tomorrow, you will desperate and fold, sell at a loss. Then just three days later ICXUSDT continues to grow. You see how that works? Three days is not a long time.It happens that the wait can take weeks but some people are ready to earn today, today alone and today only. Here is how that mentality works.Let's say the unexperienced trader (me) do manage to buy before prices start to grow. "Awesome, finally I got one." Chasing after the next breakout everyday. The pair goes up 10%, 20%, 30%. Then stops and retraces for a few days. The rookie manages to hold and then boom, a nice 50% jump. Total growth some 70% from entry point considering the small retrace.At this point, the rookie finds out everything about the pair he holds and prepares to "hold long-term." The pairs keep on growing and profits now reach 100%. Instead of securing a trade, a very nice double-up, 100% profits, the rookie becomes greedy and continues to hold.The action peaks at 120% profits. From the bottom total growth reached 320% but he didn't get the bottom of course he bought when the action was already underway. Next comes the correction and selling is still not even a possibility because remember, I will hold long-term.Long story short, when the correction hits bottom, the rookie is ready to give up. He sells everything beat down and depressed. "Crap, I missed another bullish wave." The next day, as soon as he sells the bottom prices start to grow... And the cycle repeats.This time, instead of buying crazy or being crazy, just trust my call.Buy those trading at the bottom. Those that everybody ignores. I share these in my profile. Wait patiently and then the market will grow. You cannot earn 500% on a pair if it is already moving, it is impossible. The only way to earn big is by buying when prices are low. Hold strong, hold long and as the bullish cycle develops, your money grows.Short-term trading is also do-able but requires more experience and planning. When the pair is up 20-30%, you can collect profits. This can also be done at 80-100%, it depends. It depends on your trading style, your capital, your goals... It all depends on you. How are you going to profit from this 2025 bull market bull-run?Namaste.Three days? Nope, just two and it is green again.Patience is key!
Disclaimer
Any content and materials included in Sahmeto's website and official communication channels are a compilation of personal opinions and analyses and are not binding. They do not constitute any recommendation for buying, selling, entering or exiting the stock market and cryptocurrency market. Also, all news and analyses included in the website and channels are merely republished information from official and unofficial domestic and foreign sources, and it is obvious that users of the said content are responsible for following up and ensuring the authenticity and accuracy of the materials. Therefore, while disclaiming responsibility, it is declared that the responsibility for any decision-making, action, and potential profit and loss in the capital market and cryptocurrency market lies with the trader.