
VitalyKaminsky
@t_VitalyKaminsky

What symbols does the trader recommend buying?
Purchase History
پیام های تریدر
Filter
VitalyKaminsky
VitalyKaminsky
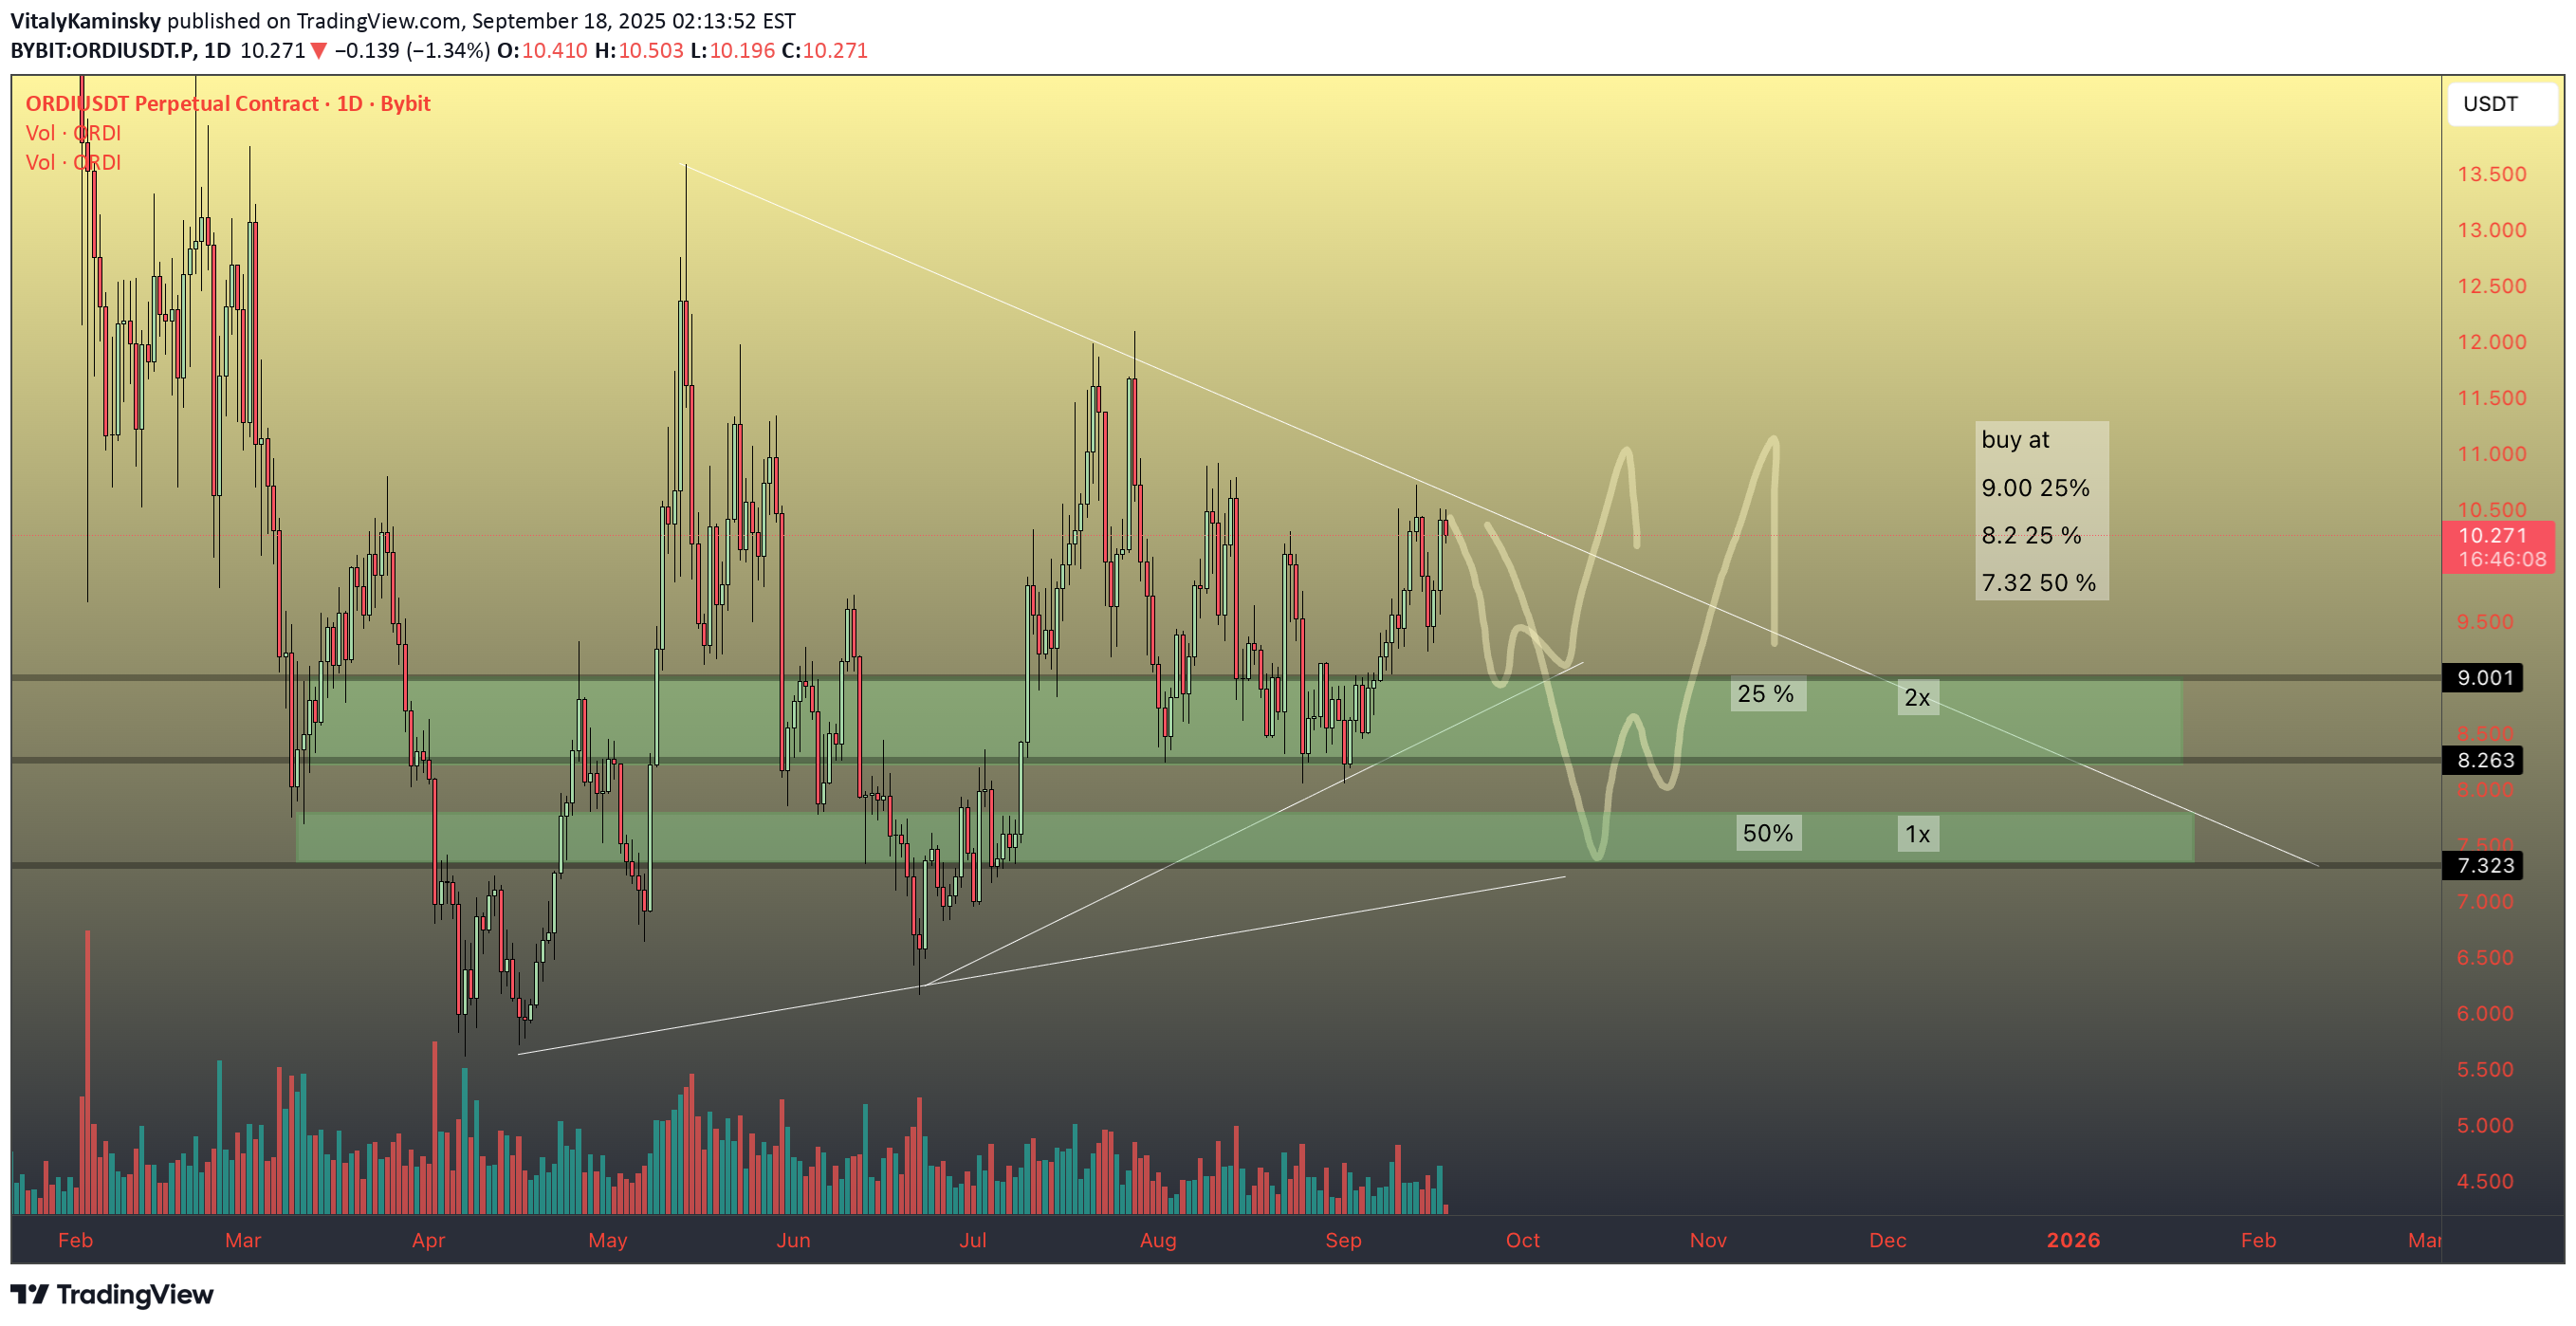
I expected this drawdown on Friday, so I closed all positions and on Sunday I gained positions every time we went lower! Because this week I expect activity on the market! Especially on September 17! There is some anxiety on the market, but it's all manipulation and games! There should be growth before the New Year! And this is my and your chance!
VitalyKaminsky
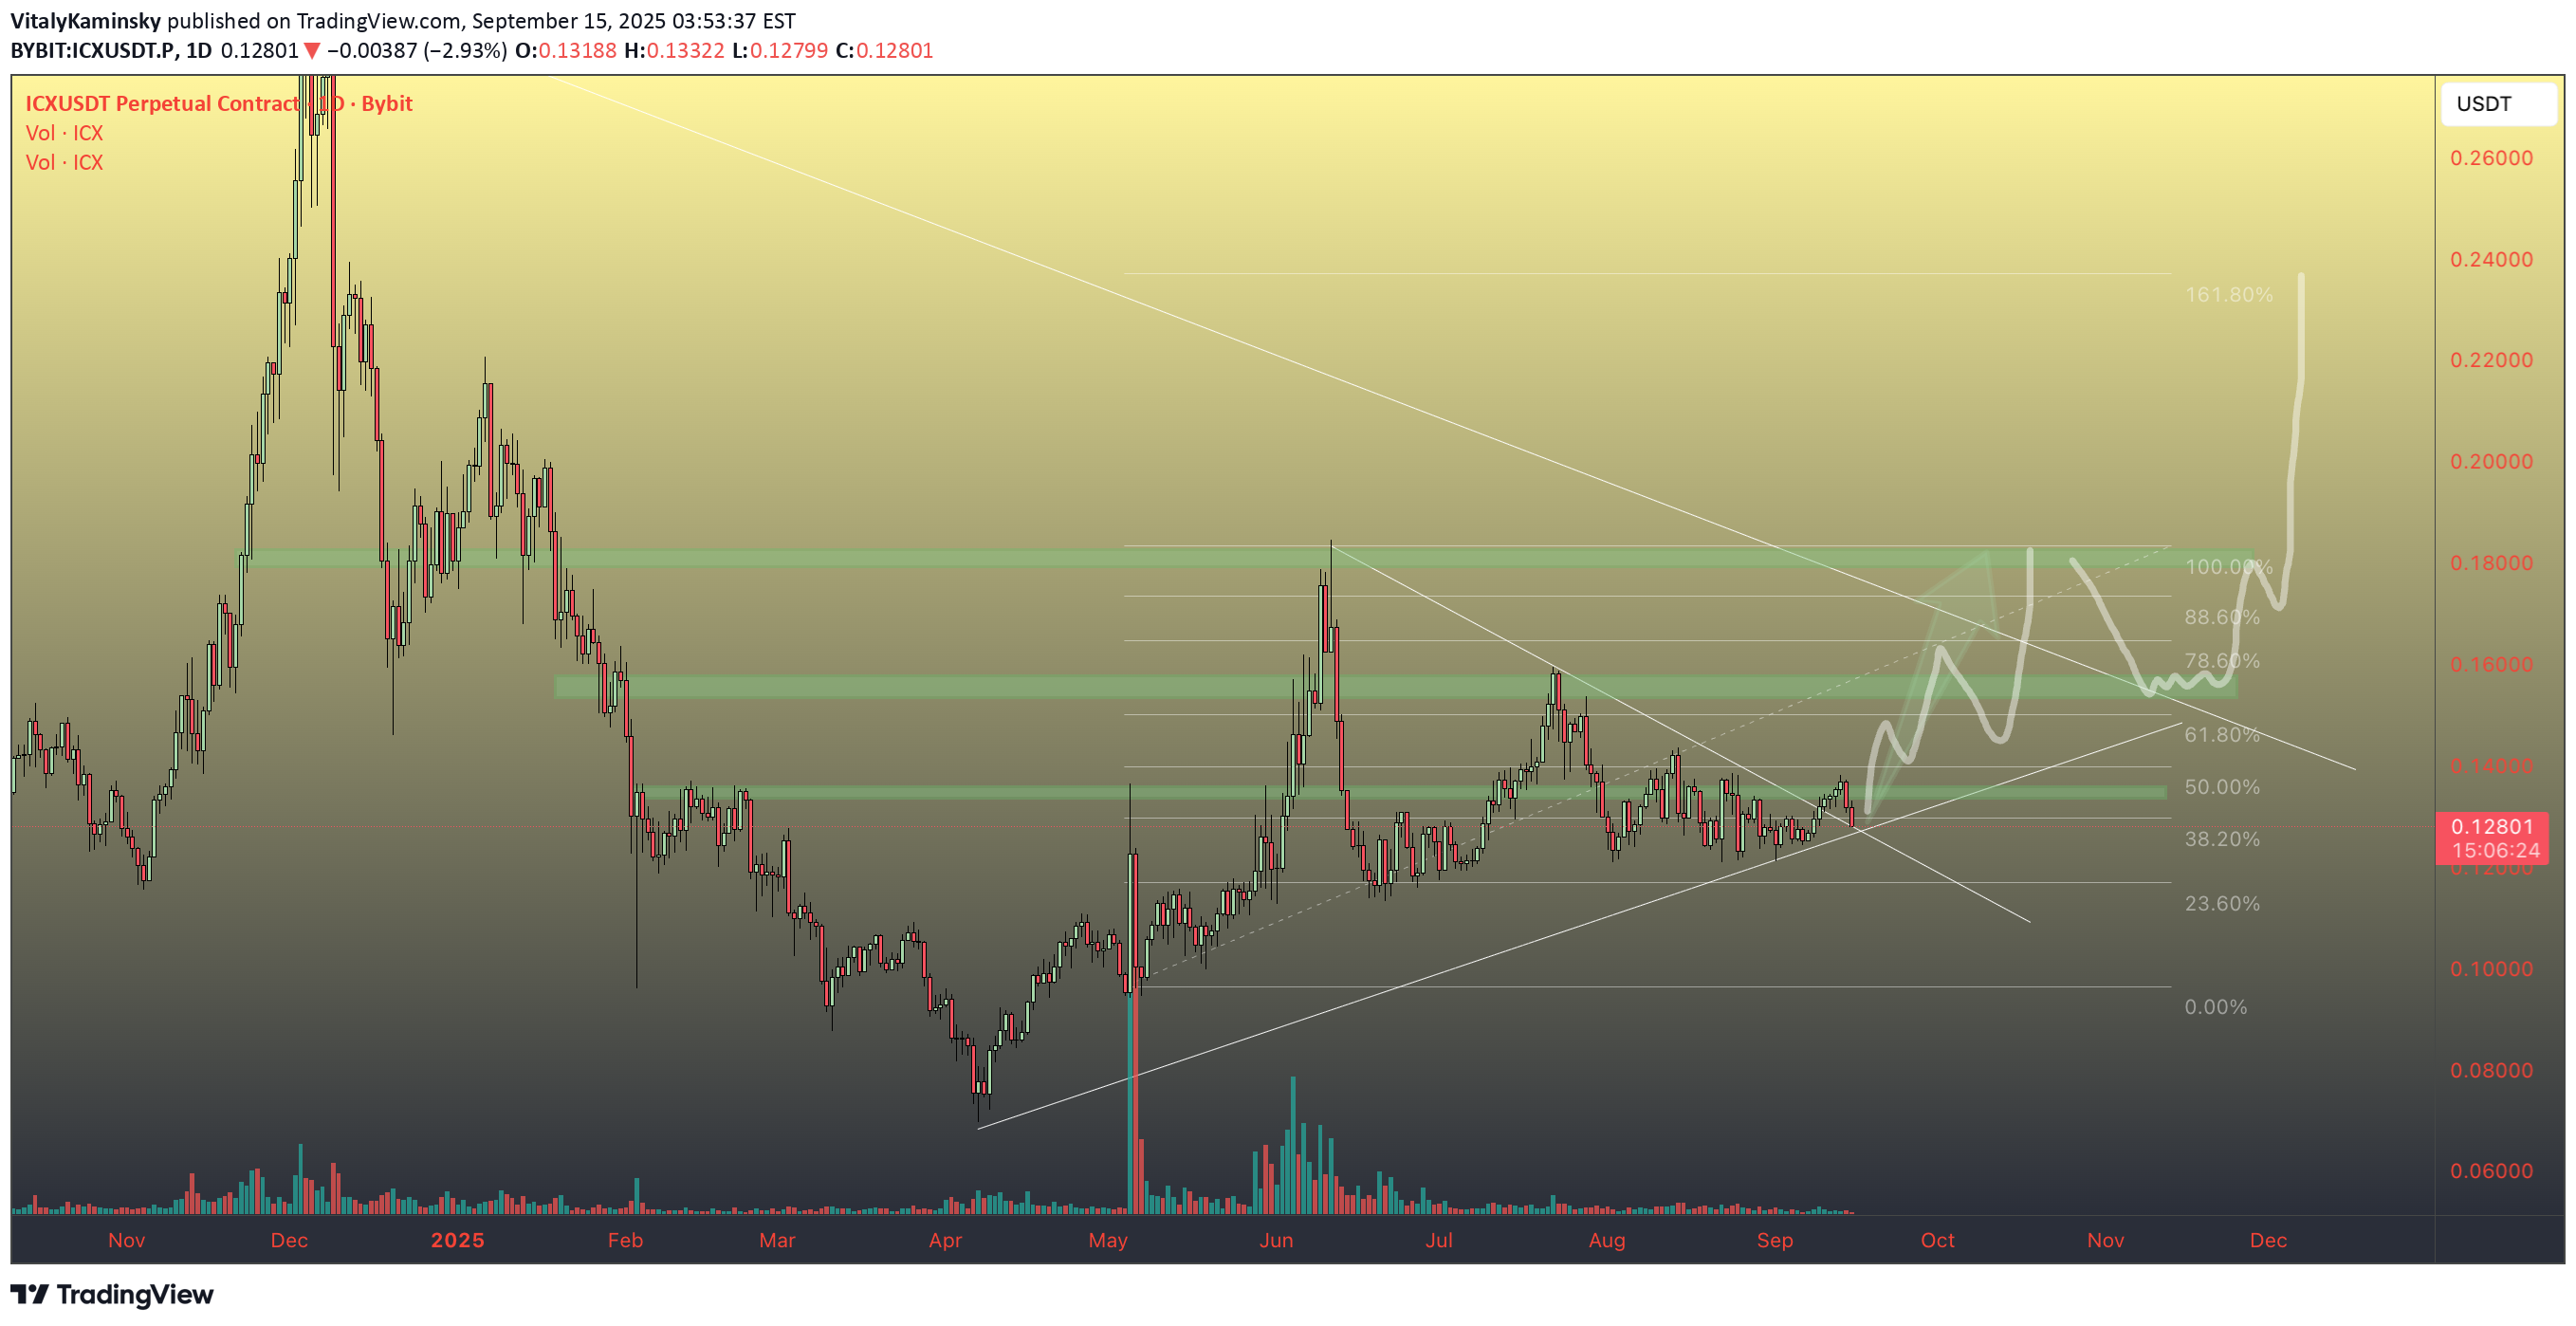
OLD COIN BE PUMP IT I am watching the market as old coins wake up after a very long hibernation! There will be more strong growths until the end of the year! There is an opportunity to make money!
VitalyKaminsky
VitalyKaminsky

“This project caught my eye at Devcon Bangkok!”The chart displays a strong potential for a 100% profit opportunity. Here’s what stands out about the project:•Background: It’s a rebranded former TomoChain with a proven track record.•Innovative Product: Their high-cost Depin (Decentralized Physical Infrastructure Network) wall highlights their focus on unique, value-driven solutions.•Market Presence: Already traded on major platforms, adding credibility and accessibility.•Accumulation Zone: The chart indicates a strong accumulation phase, suggesting an ideal entry point for growth-focused investors.Stay tuned as this project unfolds its full potential – a promising find from Devcon!
VitalyKaminsky

Grid Bot Strategy for RUNE/USDT Based on Key Market ZonesAnalyzing the RUNE/USDT market, I've identified key levels where different grid bot strategies can optimize gains. With RUNE currently trading at $5.038 and showing signs of potential growth within a defined range, here’s how I plan to set up grid bots depending on how the price action develops.Scenario 1: Range-Bound Market with Potential to Break Higher 🟢Given the price is within the $4.80 - $6.61 range, I recommend setting up a neutral + long grid bot with a balanced distribution. This allows us to capture small fluctuations within this range while positioning for an eventual upward breakout.Target grid range: $4.80 - $6.61.Setup condition: N+L = 60% Neutral + 40% Long.Advantages: This setup capitalizes on both minor ups and downs within this range, while maintaining a slight bullish bias in case of a breakout.Scenario 2: Bullish Breakout Above $6.61 (Aggressive Long Bias) 🚀If the price breaks above $6.61, this could trigger a bullish run toward higher resistance levels. In this case, shifting to a more aggressive long-biased grid bot is ideal to capitalize on the uptrend, with an 80% focus on long positions to maximize gains as the price potentially targets the $8.50 zone.Target grid range: $6.61 - $8.50.Setup condition: N+L = 20% Neutral + 80% Long.Advantages: This setup allows the bot to accumulate on pullbacks while taking profits as the price moves higher, maximizing gains in a bullish scenario.Scenario 3: Breakout Toward Higher Zones ($8.50 and Above) 📈If RUNE continues to rise and reaches the $8.50 - $10.70 zone, this range offers another opportunity for a neutral-dominant grid bot setup, targeting higher volatility while maintaining a small long bias. This allows for capturing larger moves while keeping a controlled exposure to further upside.Target grid range: $8.50 - $10.70.Setup condition: N+L = 80% Neutral + 20% Long.Advantages: The bot can capture profits from fluctuations within this higher range and is still positioned for further upward movement if the trend continues.Conclusion:This multi-layered grid bot strategy allows flexibility across different market scenarios, from range-bound trading to capturing profits on bullish breakouts. By adjusting the neutral and long distribution, each grid setup is tailored to the specific range, allowing for optimized performance as RUNE’s price moves through key levels.Grid bots provide a strategic advantage in volatile markets like RUNE, allowing traders to profit from both short-term swings and long-term trends.
VitalyKaminsky

Signal: BUY Confidence Level: 70%The recent price dip has shown signs of finding support at the $0.3273 level.Price is hovering near a key support zone, suggesting a potential bounce.Formation of a bullish reversal after a sharp drop could signal a recovery.Volume is starting to pick up, indicating renewed interest in this price level.The wick of the most recent candle shows rejection of lower prices.The last bounce from a similar support level led to a significant price surge.Price action is within the range of a potential reversal pattern.There’s a slight divergence on the volume SMA, suggesting a reversal.The market seems to have stabilized after the previous high volatility.MACD and RSI indicators (though not visible) could likely be indicating an oversold condition, based on the chart pattern.Take Profit Target: $0.3350 Stop Loss: $0.3235 This is not trading advice.
VitalyKaminsky

BounceBit pioneers CeDeFi infrastructure, offering institutional-grade yield products, restaking use cases, and CeDeFi as a service, making high-yield opportunities accessible.The BounceBit chain, a dual-token PoS Layer 1 secured by BTC and BB, leverages Bitcoin's security with full EVM compatibility. By designing liquidity custody tokens (LCTs) and partnering with CEFFU, users earn tangible interest from CeFi and utilize LCTs for restaking and on-chain farming.
VitalyKaminsky

TON/USDT: Toncoin Prepares for a Significant Move**Current Situation:Toncoin (TON) is currently trading around $6.46. After a period of consolidation near $6.50, the market is showing signs of preparing to break out of this range. The asset remains relatively stable, but indicators on the charts suggest the potential for an imminent trend change.Technical Analysis:- Support: $6.30- Resistance: $6.70- RSI Indicator: On the daily chart, the RSI is in the neutral zone around 50, indicating potential accumulation before a stronger move.- MACD: The MACD is approaching the signal line, pointing to a possible upward reversal.- Moving Averages (50 MA and 200 MA): The price is above both moving averages, which is a bullish signal in the long-term perspective.Possible Scenarios:1. Bullish Scenario: If TON's price breaks the $6.70 resistance level and holds above it, this could pave the way for a rise towards $7.00 and beyond. The bullish signal will be confirmed if the MACD crosses the signal line from below.2. Bearish Scenario: If the price drops below the $6.30 support level, a decline to $6.00 is possible. If the RSI starts to fall below 40, this could intensify the bearish trend.Trading Idea:Traders are advised to watch the key levels of $6.30 and $6.70. A breakout of either level could signal a trade opportunity. If the price holds above $6.70, consider a buying opportunity with a target of $7.00. In case of a drop below $6.30, consider short positions with a target of $6.00.Conclusion:Toncoin is at a critical juncture, and the coming days could be decisive in determining its next move. It’s important to closely monitor the market’s reaction to the key levels and indicator signals to make well-informed trading decisions.
VitalyKaminsky

BTC/USDT: Bitcoin Approaching a Critical Juncture — What to Watch NextCurrent Situation:Bitcoin (BTC) is currently trading around $59,536. After a period of consolidation near the $60,000 mark, the market is showing signs of potential volatility. Traders are closely watching for any breakouts or breakdowns from the current range, which could signal the next significant move.Technical Analysis:- Support: $58,500- Resistance: $60,500- RSI Indicator: The RSI on the 4-hour chart is hovering around 55, indicating a neutral stance but with room for further upward movement.- MACD: The MACD indicator is maintaining a bullish crossover, suggesting the possibility of continued upward momentum.- Bollinger Bands: The Bollinger Bands are starting to narrow, often a precursor to a breakout in either direction.Possible Scenarios:1. Bullish Scenario: If BTC breaks above the $60,500 resistance level and sustains this position, it could trigger a rally toward the $62,000 level and beyond. The confirmation of a bullish move will come if the MACD continues to rise and the RSI enters the overbought territory.2. Bearish Scenario: On the downside, if Bitcoin falls below the $58,500 support level, it could lead to a decline toward $56,000. A drop in RSI below 40 would reinforce the bearish outlook.Trading Idea:Traders should watch the key levels of $58,500 and $60,500 closely. A break above $60,500 could be an opportunity to go long, targeting $62,000. Conversely, a break below $58,500 could signal a shorting opportunity with a target of $56,000.Conclusion:Bitcoin is at a pivotal point, and the next few days could determine its direction for the near future. Traders should remain vigilant and ready to act based on how the price reacts to the key support and resistance levels.
Disclaimer
Any content and materials included in Sahmeto's website and official communication channels are a compilation of personal opinions and analyses and are not binding. They do not constitute any recommendation for buying, selling, entering or exiting the stock market and cryptocurrency market. Also, all news and analyses included in the website and channels are merely republished information from official and unofficial domestic and foreign sources, and it is obvious that users of the said content are responsible for following up and ensuring the authenticity and accuracy of the materials. Therefore, while disclaiming responsibility, it is declared that the responsibility for any decision-making, action, and potential profit and loss in the capital market and cryptocurrency market lies with the trader.