
EdoardoTelve
@t_EdoardoTelve

What symbols does the trader recommend buying?
Purchase History
پیام های تریدر
Filter
EdoardoTelve
خیزش بزرگ STRK: آیا ماهها انباشت به انفجار قیمتی ختم میشود؟
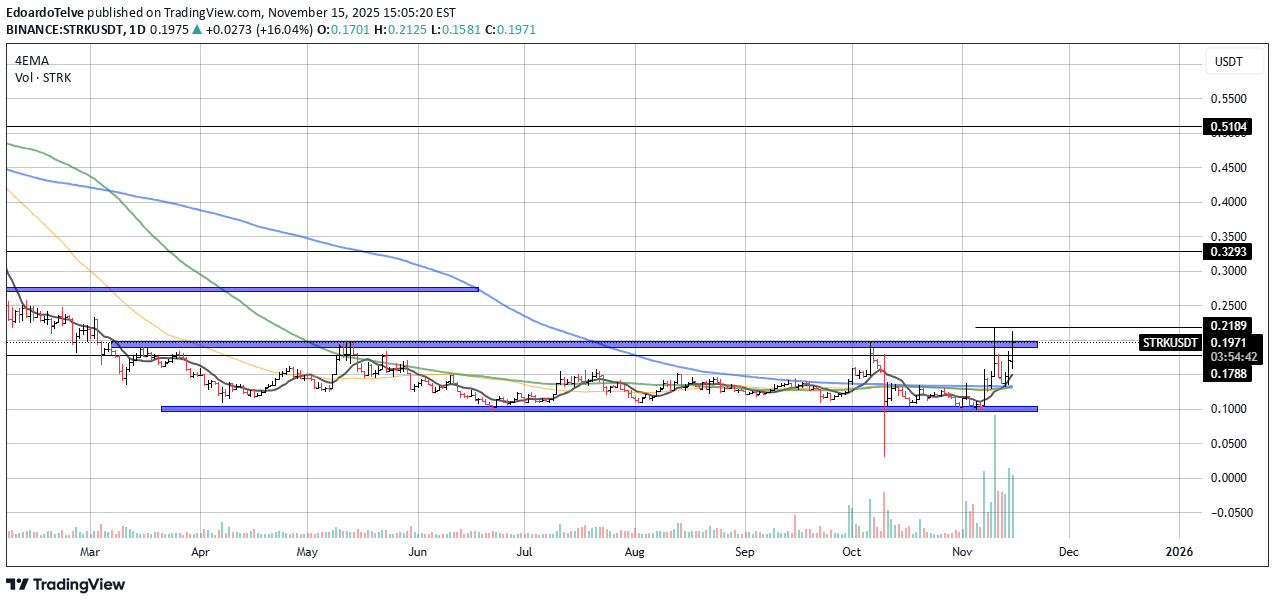
November 15, 2025 Hey there!! STRK has been stuck inside a very long, flat accumulation range for months, and it is now finally breaking above the key resistance zone. This is the strongest bullish structure STRK has shown in a long time. 🔍 Technical Overview Current price: $0.1979 4EMA cluster: $0.14 – $0.13 – $0.13 → Price is clearly above all EMAs → momentum is shifting into bullish territory. Volume has increased significantly during the breakout attempt → confirmation of real interest. 📊 Market Structure Breakdown 1. Multi-month accumulation (June → early November) STRK has been building a huge base between: Support: $0.105–0.11 Resistance: $0.17–0.18 This is a textbook compression zone where volatility dies before a proper expansion. 2. First breakout attempt (early November) Price pushed directly into the upper box with a large spike in volume, signaling the beginning of accumulation-to-expansion transition. 3. Clean rejection wick but structure still bullish Price wicked above the top, pulled back slightly, but: it did not re-enter the lower accumulation, and is holding above EMAs. This means the breakout is still valid as long as STRK stays above $0.178–0.18. 🧱 Key Levels Major Support Zones $0.178 – $0.18 → extremely important (flip zone; losing it would delay the breakout) $0.105 – $0.11 → base of long-term accumulation EMAs cluster ($0.13–0.14) → dynamic support if price retraces Targets / Resistance Ahead $0.2189 → current breakout level $0.3293 → next major structural resistance $0.5104 → large historical supply zone (final target of the move) These are the same levels price respected earlier in the year. 🎯 Outlook The chart is now in a transition from accumulation to expansion. Bullish if: price holds above $0.18, and confirms above $0.2189. If this happens, the next likely destination is $0.3293. Bearish only if price falls back below $0.18, which would invalidate the breakout. good trading!
EdoardoTelve
MNT/USDT – Breaking Out into New Territory

Hey Guys! Date: September 29, 2025 MNT has finally broken above its long-term resistance zone and is showing strong upward momentum. The chart structure suggests that the trend has shifted decisively bullish, with room for significant continuation. 🔍 Technical Snapshot: Current Price: $1.84 EMA (4): $1.71 👉 Price is comfortably trading above its EMA, showing strong trend support. 📊 Chart Structure & Price Action: Multi-year accumulation and resistance around $1.10–$1.70 (blue zone) has now been broken. Price has flipped this range into support, a classic sign of strength. Strong volume confirms the breakout is backed by real demand. 📉 Supports to Watch: $1.71 (immediate support, trendline area) $1.11 (major retest level from the breakout base) $0.87 – $0.72 (deeper historical demand zones) 📈 Upside Targets: First target: $2.24 Next levels: $2.35 → $2.50 → $2.62 Extension target: $3.50+ if momentum accelerates 📊 Momentum & Indicators: RSI: currently above 60, showing strong but not yet overextended momentum. Volume profile supports further continuation, with little overhead resistance until the $2.20+ zone. 🎯 Creative Bullish Outlook: MNT looks like it’s entering a new growth phase after years of compression and failed breakout attempts. This clean breakout from the $1.10–$1.70 barrier could open the road toward the $2.20–$2.60 range in the short to medium term. If buyers keep control, the bigger target sits near $3.50–$4.00. 📉 Invalidation: A daily close back under $1.71 would weaken short-term momentum. Losing $1.11 would flip the structure bearish again, returning price into the old range. ⚡ Summary: MNT is in a confirmed breakout from a multi-year resistance structure. As long as price holds above $1.71, the bullish trend remains intact with targets at $2.24 → $2.50 → $2.62 → $3.50+. good trading!
EdoardoTelve
POL/USDT – Knocking on the Door of Breakout Territory

Hey there! I'm back on track again :-) Date: September 2, 2025 POL has been quietly coiling for months, and now it’s pressing right against a key resistance wall. The setup is starting to look like the calm before the storm. 🔍 Technical Snapshot: Current Price: $0.286 EMA Levels: 4EMA: $0.256 50EMA: $0.238 100EMA: $0.220 200EMA: $0.225 👉 Price is finally trading above all major EMAs for the first time in a while — a textbook early signal of a trend reversal. 📊 Chart Structure & Price Action: For months, POL has been trapped under the $0.28–0.29 resistance zone. Each dip has been shallower, forming a staircase of higher lows — a sign of buyers building pressure. Today’s candle is poking above resistance, showing the market is testing supply. 📉 Supports to Watch: $0.256 (4EMA, immediate support) $0.238 (50EMA support) $0.22 (100/200EMA cluster – strong demand zone) 📈 Targets if Breakout Confirms: First stop: $0.3915 Next supply zone: $0.4752 Major extension target: $0.5610 📊 Volume & Momentum: Volume spike today suggests smart money participation. RSI is trending bullish, but not yet overbought — leaving room for expansion. 🎯 Creative Bullish Outlook: Think of POL like a spring being compressed for months under that $0.29 lid. Each push lower was weaker than the last, while buyers kept showing up. Now, with volume flowing in, that lid might finally pop. If price clears $0.29 convincingly, it could ignite a chain reaction of stops and fresh entries, fueling a run toward $0.39 and beyond. 📉 Invalidation: A rejection and drop back under $0.238 would put the breakout thesis on hold. Losing $0.22 would flip the chart bearish again. ⚡ Summary: POL is at a make-or-break level. A confirmed breakout above $0.29 could kickstart a multi-stage rally, targeting $0.39 → $0.47 → $0.56.this promising break has re entered to his initial stage one, we decided to close and re evaluate it when it breaks out again!
EdoardoTelve
MORPH/USDT – Testing Key Resistance, Potential Breakout Setup
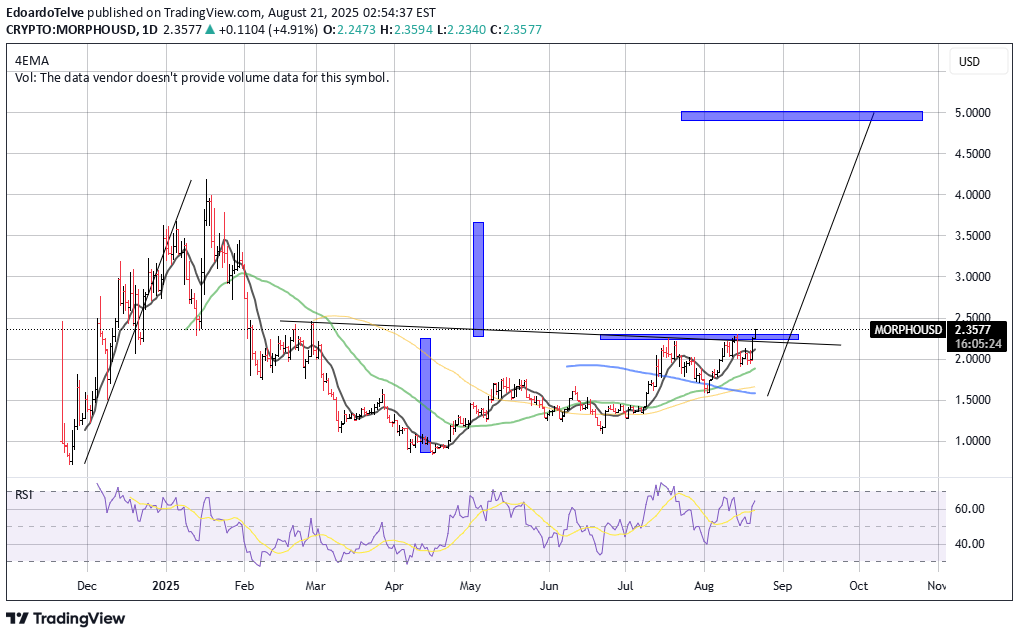
Hey there! Date: August 21, 2025 MORPH/USDT is consolidating right below a critical resistance zone and appears to be preparing for a breakout. If confirmed, the upside potential is significant. 🔍 Technical Overview: Current Price: $2.35 EMA Levels: 4EMA: $2.11 50EMA: $1.87 100EMA: $1.65 200EMA: $1.57 The price is currently trading above all major EMAs, showing strong bullish alignment. 📊 Structure & Price Action: Price has been consolidating under the $2.35–2.40 resistance zone, repeatedly testing it. A clean horizontal resistance line is visible; a breakout above this level would unlock higher targets. The recent higher lows indicate buyers are in control and pushing price upward. 📉 Key Support Levels: $2.11 (4EMA dynamic support) $1.87 (50EMA) $1.65–$1.57 (deep retracement supports near 100/200EMA) 📈 Key Resistance & Target Zones: Immediate resistance: $2.35–2.40 Breakout target: $5.00 zone (major measured move target marked on chart) 📊 Indicators: RSI: 64.53 – In bullish territory but not overbought, leaving room for continuation. No volume data available on this chart, but the structure itself suggests accumulation near resistance. 🎯 Bullish Outlook: Trend: Bullish structure with higher lows and EMA alignment Breakout above $2.40 could trigger a sharp move toward $5.00 Pullbacks to $2.10–$2.00 may offer good re-entry opportunities for continuation traders 📉 Invalidation: A rejection and breakdown below $1.87 would weaken the structure Loss of the $1.65–1.57 zone would invalidate the bullish breakout setup Good Trading :-)big break out, but it returned back , stop hitted , we are re evaluate, even the markets turbulence ;-)
EdoardoTelve
INJ/USDT – Breakout in Progress, Targets in Sight

Date: July 28, 2025 INJ/USDT is displaying a strong bullish structure after breaking through a major resistance zone, supported by increasing volume and positive momentum. The market appears to be entering a new expansion phase. 🔍 Technical Overview: Current Price: $15.95 EMA Overview: 4EMA: $14.71 50EMA: $12.25 100EMA: $11.94 200EMA: $12.69 Price is currently above all major EMAs, confirming strong bullish momentum and trend alignment. 📊 Structure & Price Action: Price successfully broke out of the $14.35–15.02 resistance zone, which previously acted as a rejection area. A clear bullish continuation pattern can be seen, with rising trendlines and higher lows. Price retested the breakout area and is now pushing higher – confirming demand at higher levels. 📉 Key Support Zones: $15.02 (recent breakout level, now flipped to support) $14.35 $12.92 (former consolidation resistance) 📈 Key Resistance & Target Zones: $18.40: First significant upside target based on the measured move $25–26 area: Major long-term resistance, highlighted as a high confluence target zone 📊 Indicators: RSI: 68.57 – Bullish momentum, nearing overbought levels. Could lead to short-term consolidation or pullback, but the trend remains intact. Volume: Gradually increasing volume with the breakout – a healthy sign of accumulation and breakout confirmation. 🎯 Bullish Outlook: Trend: Strong uptrend with clean breakout structure Short-term target: $18.40 Mid/Long-term target: $25–26 Dips toward $15.00–$14.30 may be attractive for bulls looking for continuation entries 📉 Invalidation: A breakdown below $14.35 with high volume could suggest a failed breakout and bring price back toward the $12.90 zone A move below the trendline would signal weakness, but until then, bulls remain in control Good Trading!!re entered into the trading range as many in this period.. closed ;-)
EdoardoTelve
ARKM/USDT – Bullish Continuation Pattern with Upside Potential
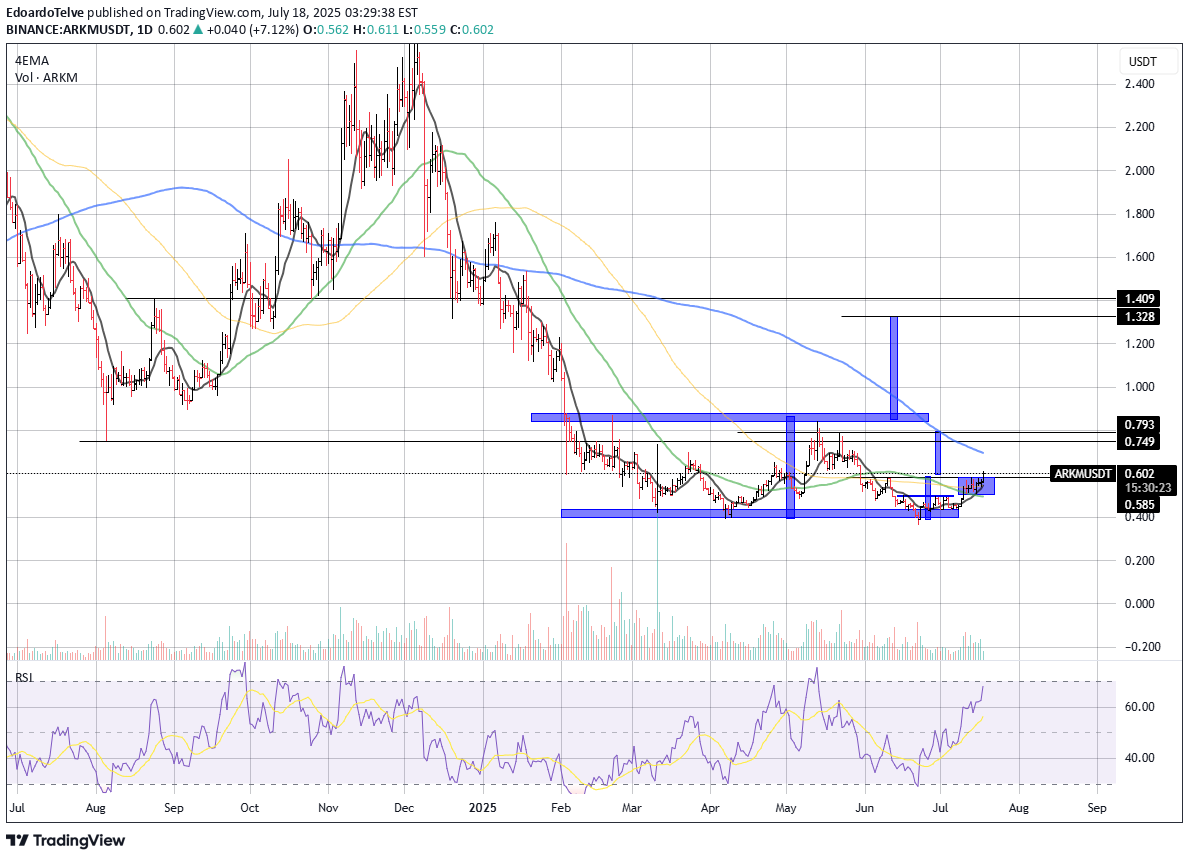
Date: July 18, 2025 ARKM/USDT is showing renewed bullish momentum after a prolonged accumulation phase. The price has broken out of a tight range and is now pushing above key moving averages with volume support, indicating a potential trend reversal and upside continuation. 📊 Technical Overview: Current Price: $0.601 EMA Alignment: Price is currently above the 4EMA, 50EMA, and 100EMA, suggesting growing short-term strength. Still trading below the 200EMA (~$0.695), which could act as resistance. Structure: Strong breakout from a horizontal consolidation range. The pattern resembles an accumulation zone followed by an impulsive move. 📉 Support Zones: $0.585 (minor support – recent breakout level) $0.400 (major accumulation base and demand zone) 📈 Resistance/Target Zones: Immediate Target: $0.749–$0.793 (horizontal resistance from past price action) Mid-Term Target: $1.328–$1.409 (projected target based on height of the accumulation box) 📊 Indicators: RSI: 67.84 – bullish momentum increasing, nearing overbought territory but not yet exhausted Volume: Volume increasing on green candles – confirms buyer interest and breakout legitimacy 🔍 Chart Structure: Price spent several months inside a wide consolidation box between ~$0.40 and ~$0.75. The recent breakout from a smaller mini-range inside the larger zone suggests a renewed push toward upper resistance. The pattern projection points to a possible move back to the $1.30+ zone in the medium term. 🎯 Upside Projections: Short-Term Target: $0.749–$0.793 Mid-Term Target: $1.328–$1.409 These levels correspond to past structural resistances and measured breakout moves. 📉 Invalidation: Breakdown below $0.585 would invalidate the short-term bullish setup. Falling back into the $0.40–$0.50 zone would indicate weakness and likely further consolidation.
EdoardoTelve
SKY/USDT – Symmetrical Triangle Breakout Suggests Strong Upside

Date: June 11, 2025 SKY/USDT has successfully broken out of a long-term symmetrical triangle pattern, signaling a potential bullish continuation. The breakout is backed by increasing volume and rising RSI, pointing to growing momentum. 📊 Technical Overview: Current Price: $0.08954 Breakout Zone: ~$0.08500 Key Support Levels: $0.06250 (previous consolidation base) $0.04152 (major demand zone) Resistance/Target Zones: $0.14880 (intermediate target) $0.15840 (historical resistance) $0.17102 (macro resistance) 📈 Indicators: RSI: 71.16 – entering overbought territory, confirming bullish momentum. Moving Averages: All key EMAs (4, 50, 100, 200) are aligned to the upside, showing a clear trend reversal and strong price structure. 📉 Volume: Volume has begun to increase significantly at the breakout point, adding validity to the move. 🔍 Chart Structure: Price has broken above a converging resistance trendline after months of consolidation. The ascending triangle base suggests a sustained accumulation phase. A classic bullish breakout setup with well-defined measured move targets. 🎯 Upside Projections: Short-Term Target: $0.14880 Mid-Term Target: $0.15840 Extended Target: $0.17102 📉 Invalidation: A drop back below $0.085 and particularly below $0.06250 would invalidate this bullish breakout and indicate a false breakout. Good trading!!still there and active in his sector (RWA)
EdoardoTelve
ICX/USDT – Bullish Breakout Confirmed, Eyeing Higher Targets

Date: June 9, 2025 ICX/USDT has officially broken out of a key consolidation range and is now entering a new bullish phase. With momentum rising and volume supporting the move, the path of least resistance remains to the upside. 📊 Technical Overview: Current Price: $0.1672 Key Support Zone: $0.1393 Resistance Levels: Short-term: $0.3000 Mid-term: $0.4000 📈 Indicators: RSI: At 76.50 – entering overbought territory, but confirms strong bullish momentum. EMA Alignment: Price is well above all major EMAs (4, 50, 100, 200), confirming trend reversal and bullish structure. 📉 Volume: A spike in volume confirms genuine interest behind the breakout. This is not a low-liquidity move, but a meaningful shift in market structure. 🔍 Chart Structure: ICX broke through horizontal resistance with strong price action. RSI has broken above the 70 mark, confirming bullish momentum. Previous accumulation zone ($0.13–$0.14) now acts as strong support. 🎯 Upside Targets: First Major Target: $0.3000 – previous significant resistance Second Major Target: $0.4000 – historical supply zone from December highs 📉 Invalidation Zone: A breakdown below $0.1393 would invalidate the current bullish setup and suggest a re-entry into consolidation. Good Trading!!choppy and almost flat.
EdoardoTelve
MYX/USDT – Breakout Setup Forming in Tight Consolidation!

Date: June 9, 2025 MYX/USDT is showing a classic bullish setup, forming a tight consolidation just below a key resistance zone. This structure often precedes a breakout, especially when combined with increasing momentum indicators. 📊 Technical Overview: Current Price: $0.08894 Immediate Resistance: $0.10285 EMA Signal: Price is holding above the 4EMA, suggesting short-term bullish momentum is intact. 📈 Indicators: RSI: Currently at 54.81 — neutral to bullish, with room for upside before entering overbought territory. Volume: Not provided on this chart, but the structure and price action suggest accumulation. 🔍 Chart Structure: The price is forming higher lows and pressing against horizontal resistance, indicating bullish pressure. A clean break and close above the $0.102–$0.103 zone would likely trigger a strong move toward higher targets. 🎯 Targets: First Target: $0.10285 (resistance breakout level) Second Target: $0.13000 (next major horizontal resistance, matching past supply zone) 📉 Invalidation Level: A break below $0.080 and loss of higher low structure would invalidate the bullish thesis and suggest further range-bound action or a correction.going very good after a bit of drawdown :-)we have made really great profits in here. great winner of the year ;-)
EdoardoTelve
FORM/USDT – A Classic Breakout in Play

Date: May 13, 2025FORM is finally breaking free from its long consolidation. After a textbook accumulation phase, we’re seeing a clean breakout above the $2.75 horizontal resistance, supported by rising volume and a strong RSI push into overbought territory.📊 Technical Snapshot:Breakout Level: $2.75 – now flipped from resistance to support.EMA Alignment: Price is riding the 4EMA (black) with the green MA catching up, signaling strong short-term momentum.Volume Surge: Increased buy volume confirms breakout interest.📈 Entry Ideas:Breakout entry: Current price zone around $2.83.Retest entry: On a pullback to the breakout level ($2.70–$2.75) for confirmation and safer risk management.🧷 Validation:Setup remains valid as long as price holds above the $2.60 area.A close below that would re-enter previous range and weaken bullish structure.🎯 Target Zones:TP1: $3.89 – previous structural resistance and measured move from consolidation.TP2: $4.07 – psychological round number + upper liquidity level.TP3: $5.00 zone – ambitious but realistic if momentum continues and volume expands.📈 RSI Check: Sitting at 73 – bullish strength confirmed, but watch for short-term cooling or retest before next leg.🧠 Final Thoughts: FORM is showing strong structural alignment with volume and momentum support. A healthy pullback could offer the next best opportunity before aiming for higher levels. Momentum traders will want to watch this closely.Good trading!!going very good on re accumulation.
Disclaimer
Any content and materials included in Sahmeto's website and official communication channels are a compilation of personal opinions and analyses and are not binding. They do not constitute any recommendation for buying, selling, entering or exiting the stock market and cryptocurrency market. Also, all news and analyses included in the website and channels are merely republished information from official and unofficial domestic and foreign sources, and it is obvious that users of the said content are responsible for following up and ensuring the authenticity and accuracy of the materials. Therefore, while disclaiming responsibility, it is declared that the responsibility for any decision-making, action, and potential profit and loss in the capital market and cryptocurrency market lies with the trader.