Technical analysis by EdoardoTelve about Symbol ARKM: Buy recommendation (7/18/2025)

EdoardoTelve
ARKM/USDT – Bullish Continuation Pattern with Upside Potential
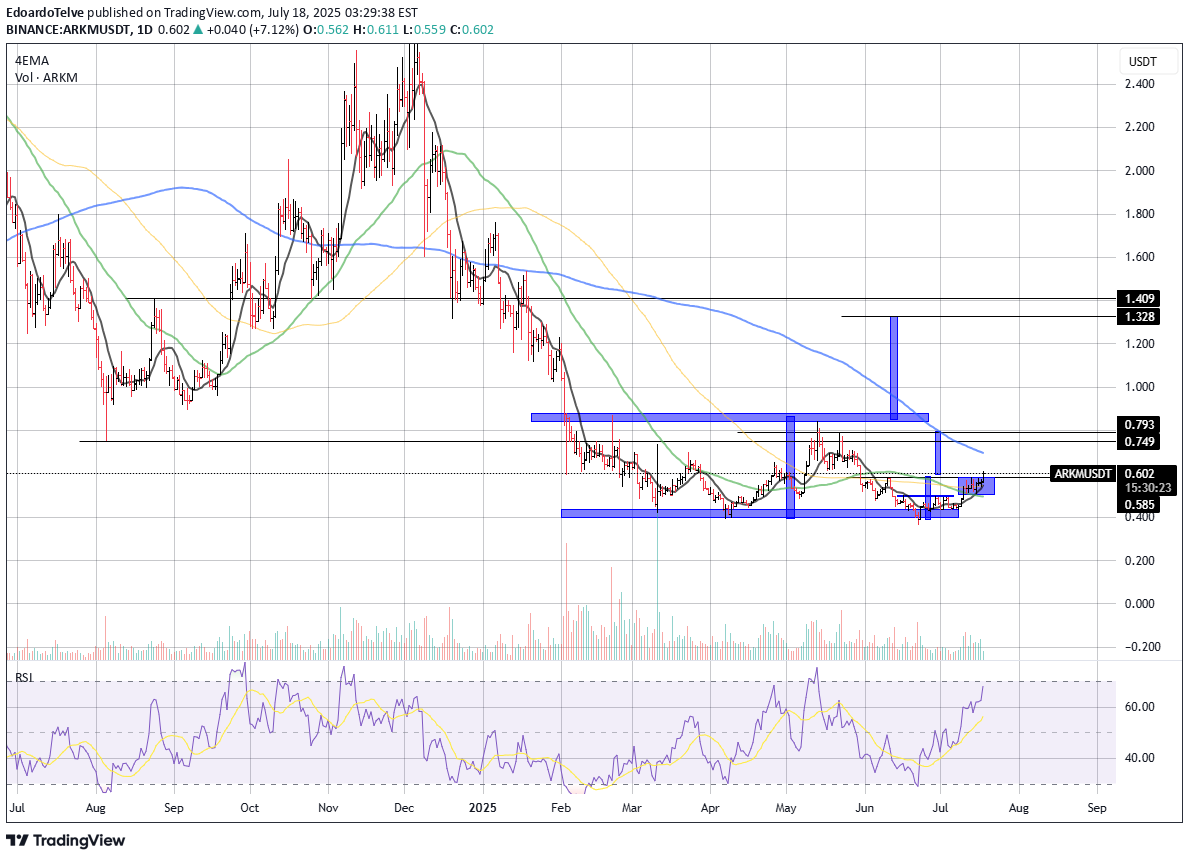
Date: July 18, 2025 ARKM/USDT is showing renewed bullish momentum after a prolonged accumulation phase. The price has broken out of a tight range and is now pushing above key moving averages with volume support, indicating a potential trend reversal and upside continuation. 📊 Technical Overview: Current Price: $0.601 EMA Alignment: Price is currently above the 4EMA, 50EMA, and 100EMA, suggesting growing short-term strength. Still trading below the 200EMA (~$0.695), which could act as resistance. Structure: Strong breakout from a horizontal consolidation range. The pattern resembles an accumulation zone followed by an impulsive move. 📉 Support Zones: $0.585 (minor support – recent breakout level) $0.400 (major accumulation base and demand zone) 📈 Resistance/Target Zones: Immediate Target: $0.749–$0.793 (horizontal resistance from past price action) Mid-Term Target: $1.328–$1.409 (projected target based on height of the accumulation box) 📊 Indicators: RSI: 67.84 – bullish momentum increasing, nearing overbought territory but not yet exhausted Volume: Volume increasing on green candles – confirms buyer interest and breakout legitimacy 🔍 Chart Structure: Price spent several months inside a wide consolidation box between ~$0.40 and ~$0.75. The recent breakout from a smaller mini-range inside the larger zone suggests a renewed push toward upper resistance. The pattern projection points to a possible move back to the $1.30+ zone in the medium term. 🎯 Upside Projections: Short-Term Target: $0.749–$0.793 Mid-Term Target: $1.328–$1.409 These levels correspond to past structural resistances and measured breakout moves. 📉 Invalidation: Breakdown below $0.585 would invalidate the short-term bullish setup. Falling back into the $0.40–$0.50 zone would indicate weakness and likely further consolidation.