
BONK
Bonk
| تریدر | نوع سیگنال | حد سود/ضرر | زمان انتشار | مشاهده پیام |
|---|---|---|---|---|
No results found. | ||||
Price Chart of Bonk
سود 3 Months :
خلاصه سیگنالهای Bonk
سیگنالهای Bonk
Filter
Sort messages by
Trader Type
Time Frame

میم کوین سولانا در مسیر صعود: آیا "بونک" به صندوقهای قابل معامله راه مییابد؟

DEXWireNews
قیمت بونک (BONK) در نقطه حساس؛ آیا سقوط در راه است یا جهش بزرگ؟
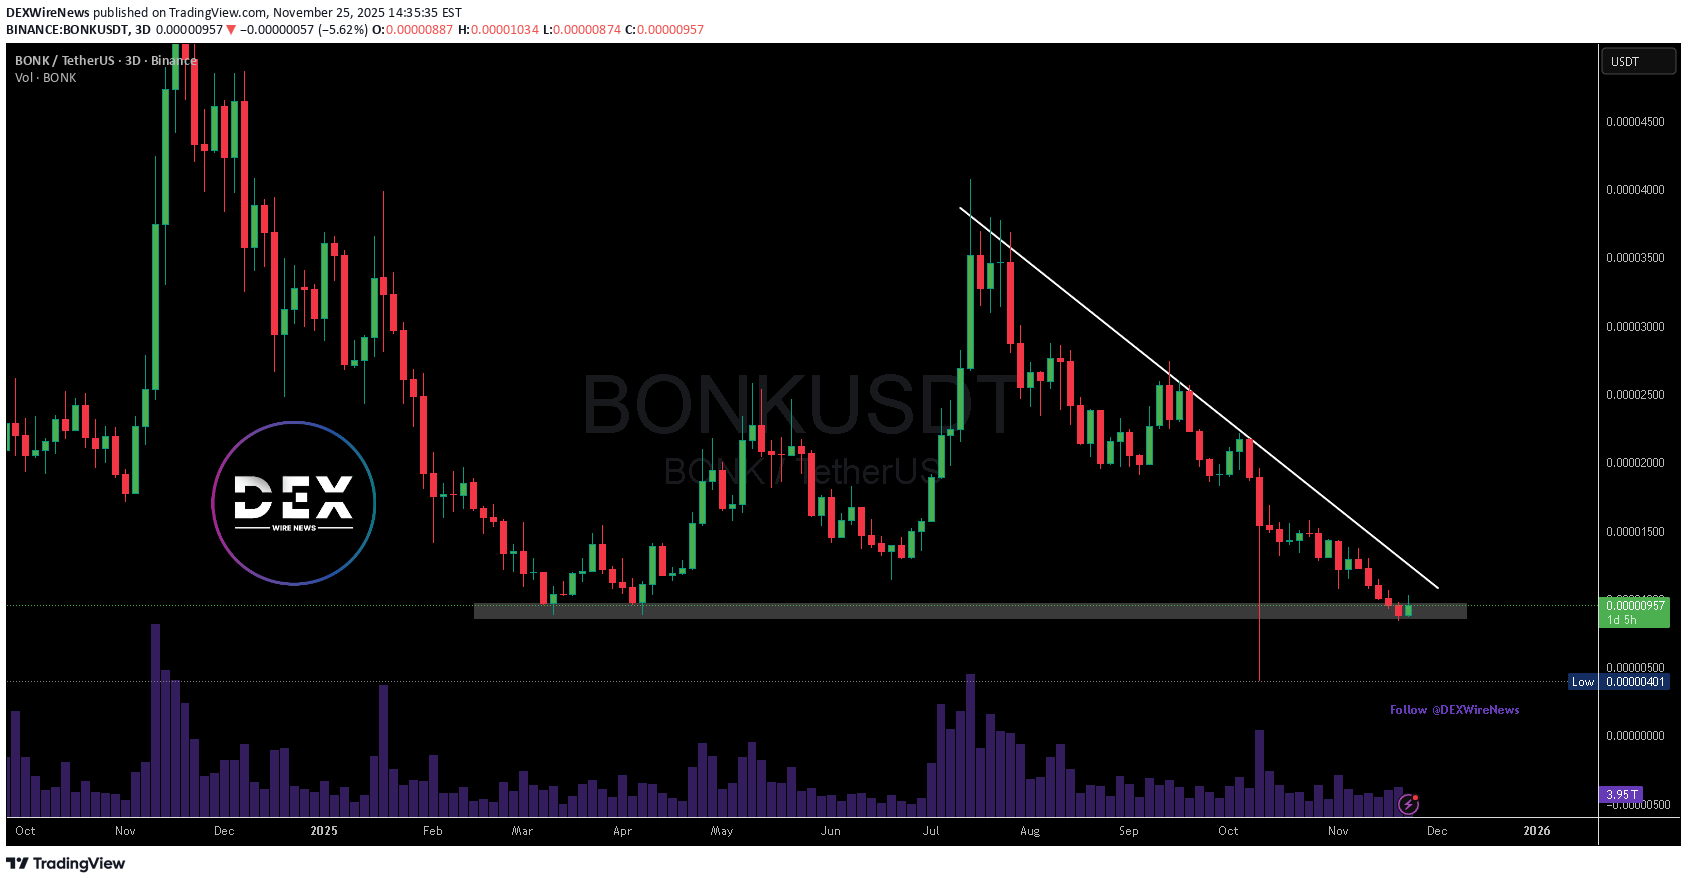
BONK ( BONK ) trades near $0.000009051, sitting directly on one of its most important historical support zones. This area triggered multiple rallies in the past, making it a major pivot that now determines whether BONK rebounds or extends its decline. Market sentiment is split, and traders watch this level with increased urgency as volatility rises across Solana-based assets. BONK ETP Listing Brings Regulated Market Access Bitcoin Capital’s launch of the BONK ETP on the SIX Swiss Exchange marks a major milestone. The product is physically backed, holding 100% BONK without synthetic exposure or leverage. This provides institutional investors a regulated way to access BONK without managing wallets or private keys. Daily reporting of token holdings, NAV, and cash positions adds transparency that many memecoins have lacked. With predictable liquidity, market makers, and Swiss oversight, the ETP places BONK alongside traditional assets. This move could attract investors who previously avoided memecoins due to custody, volatility, or regulatory concerns. ETP Details Issuer: Bitcoin Capital AG Ticker: BONK Backing: 100% BONK Fee: 1.5% Issue Date: Nov 27, 2025 Institutional & Corporate Interest Strengthens BONK’s Narrative The ecosystem shows rising momentum: Sharps Technology converted part of its 2M SOL into BonkSOL. Tuttle Capital filed a Bonk Income Blast ETF with the SEC. Bonk Holdings Inc. purchased $32M BONK, now owning ~3% of total supply. This combination of corporate buying, ETF filings, and regulated ETPs signals stronger institutional curiosity than many expected for a memecoin. Technical Outlook: BONK at a Make-or-Break Zone BONK now tests the $0.00000800–$0.00000950 range. Above $0.00000950: Momentum could return, targeting previous highs. Below $0.00000800: Bears may push price into deeper correction levels. History shows strong rallies from this zone. The next move decides whether bulls regain control—or if BONK breaks lower.

dollarmanspade


pullbacksignal
سیگنال خرید فوری بونک (BONK) با اهداف سود خیرهکننده!
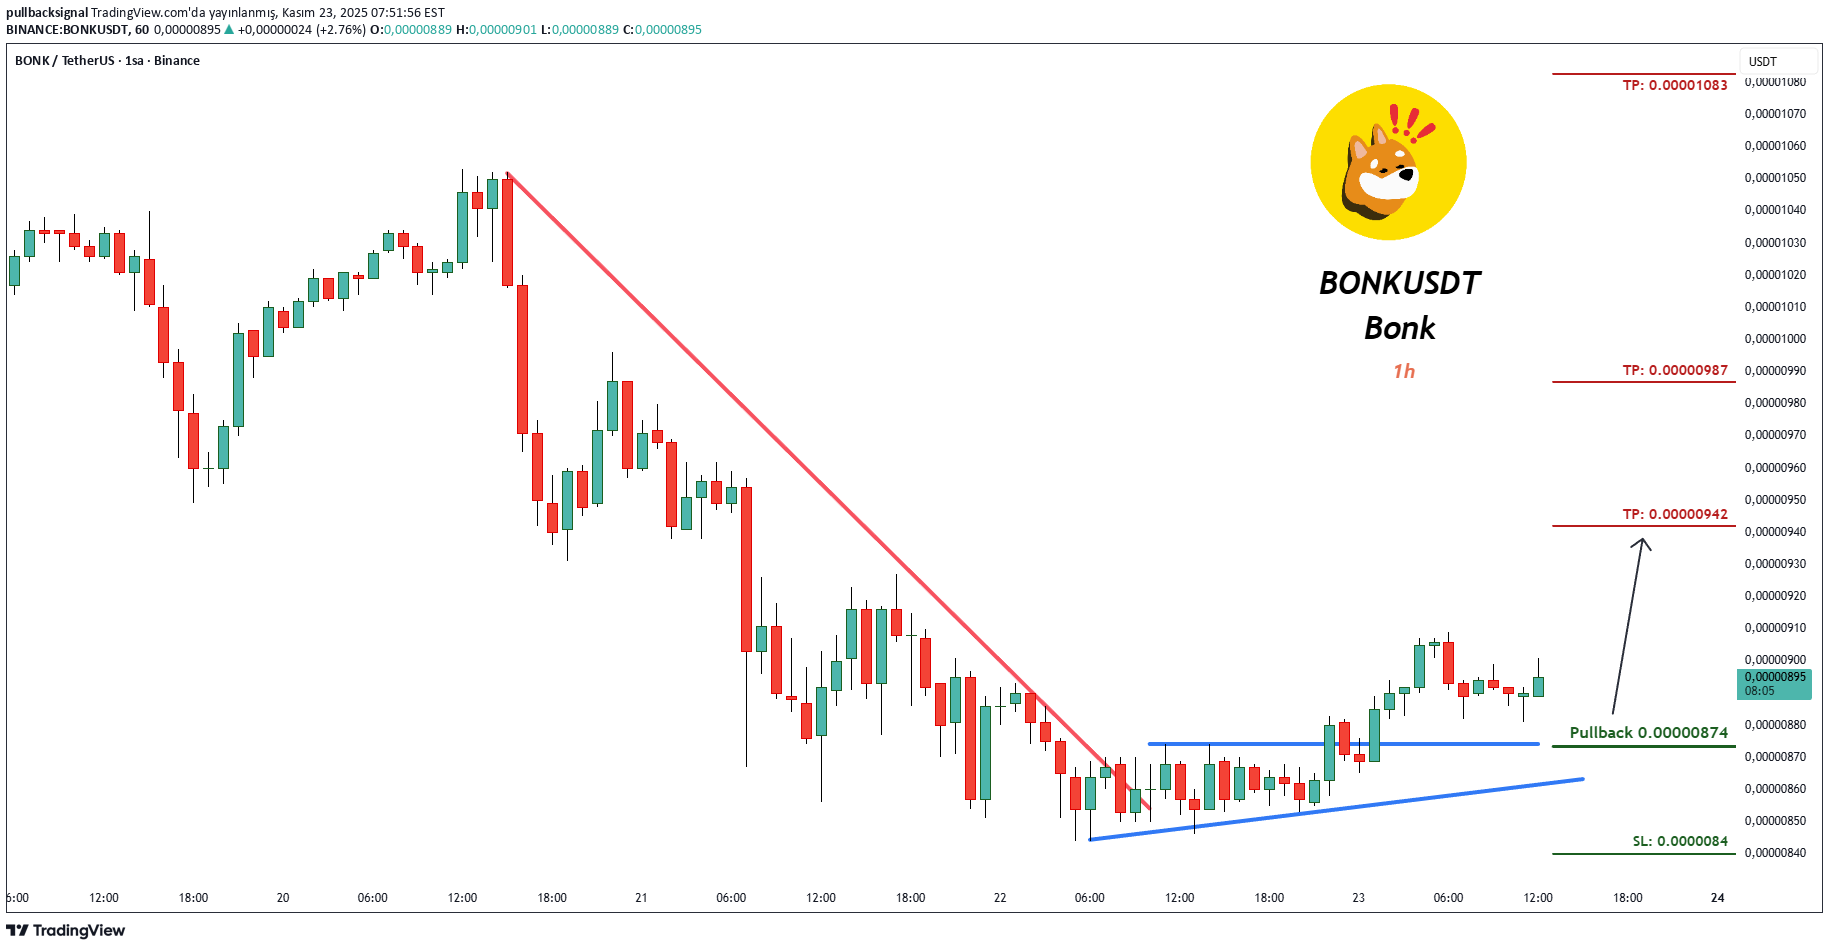
İşlem Kurulumu: BONKUSDT Bonk'ta bir İşlem Sinyali görülüyor (1s) İşlemciler ŞİMDİ Alım İşlemlerini açabilirler. ⬆️Şimdi Al veya 0,00000874'te Al ⭕️SL @ 0,0000084 🔵TP1 @ 0,00000942 🔵TP2 @ 0,00000987 🔵TP3 @ 0,00001083 Bu sinyaller neye dayanıyor? Klasik Teknik Analiz Fiyat Hareketi Mum Grafikleri Fibonacci RSI, Hareketli Ortalama, Ichimoku, Bollinger Bantları Risk Uyarısı Forex, CFD, Kripto, Vadeli İşlemler ve Hisse Senetleri ticareti şunları içerir: Kayıp riski. Lütfen bu tür bir yatırımın sizin için uygun olup olmadığını dikkatlice değerlendirin. Geçmiş performans, gelecekteki sonuçların göstergesi değildir. Fikirlerimizi beğendiyseniz, lütfen beğenileriniz 👍 ve yorumlarınızla bizi destekleyin.
pullbacksignal
سیگنال خرید فوری بونک (BONKUSDT): فرصت سود با تحلیل تکنیکال قوی!
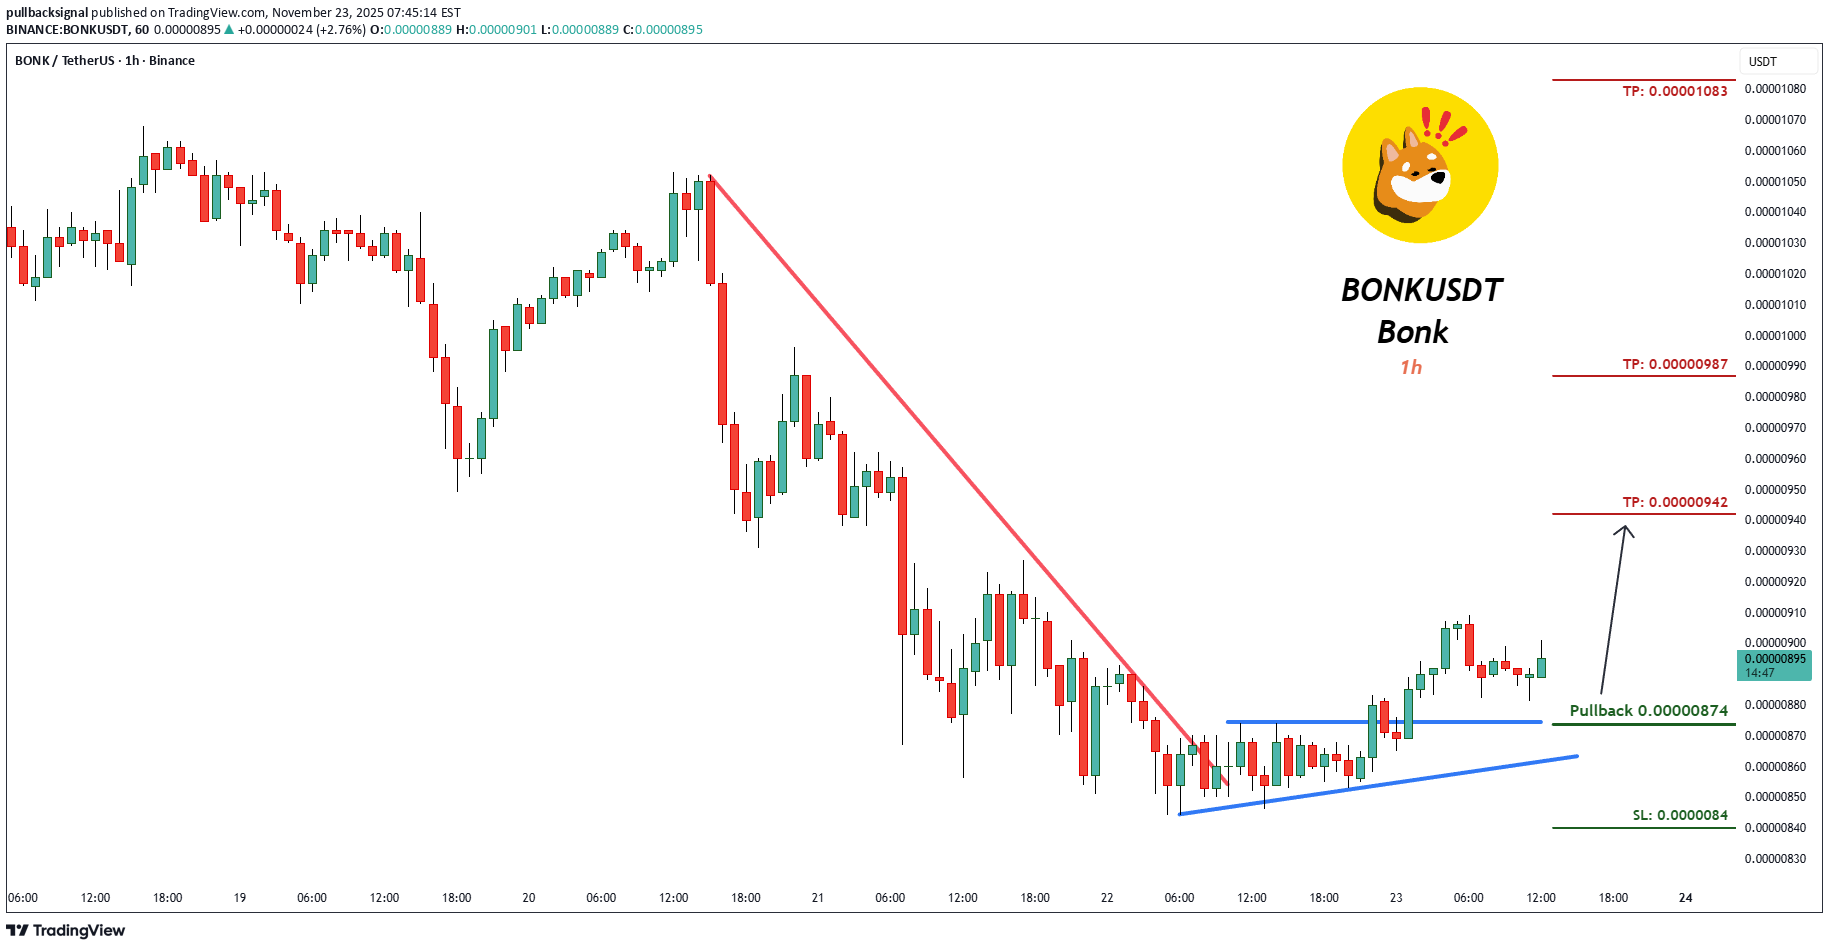
Trading Setup: A Trading Signal is seen in the BONKUSDT Bonk (1h) Traders can open their Buy Trades NOW ⬆️Buy now or Buy on 0.00000874 ⭕️SL @ 0.0000084 🔵TP1 @ 0.00000942 🔵TP2 @ 0.00000987 🔵TP3 @ 0.00001083 What are these signals based on? Classical Technical Analysis Price Action Candlesticks Fibonacci RSI, Moving Average , Ichimoku , Bollinger Bands Risk Warning Trading Forex, CFDs, Crypto, Futures, and Stocks involve a risk of loss. Please consider carefully if such trading is appropriate for you. Past performance is not indicative of future results. If you liked our ideas, please support us with your likes 👍 and comments .✅ BONKUSDT Bonk (1h) TP1 hit Technical Analysis Update — The price has reached the target, traders can close part of the trade in profit.✅✅ BONKUSDT Bonk (1h) TP1 & TP2 hit TA & setup Update — The price has reached the target, traders can close part of the trade in profit. — SL Move to BE Point (Risk-Free)

FineTrader786
سیگنال فروش داغ بونک (BONK): آماده برای ریزش در تایمفریم روزانه!

BONK USDT is bearish according to daily Bias, H1 is already showing us bearish confirmation, just take m5 confirmation and you can sell . #NOTaFinancialAdvice
الگوی W بیت کوین: آیا اکنون زمان جهش از میانگین متحرک 50 هفتهای است؟
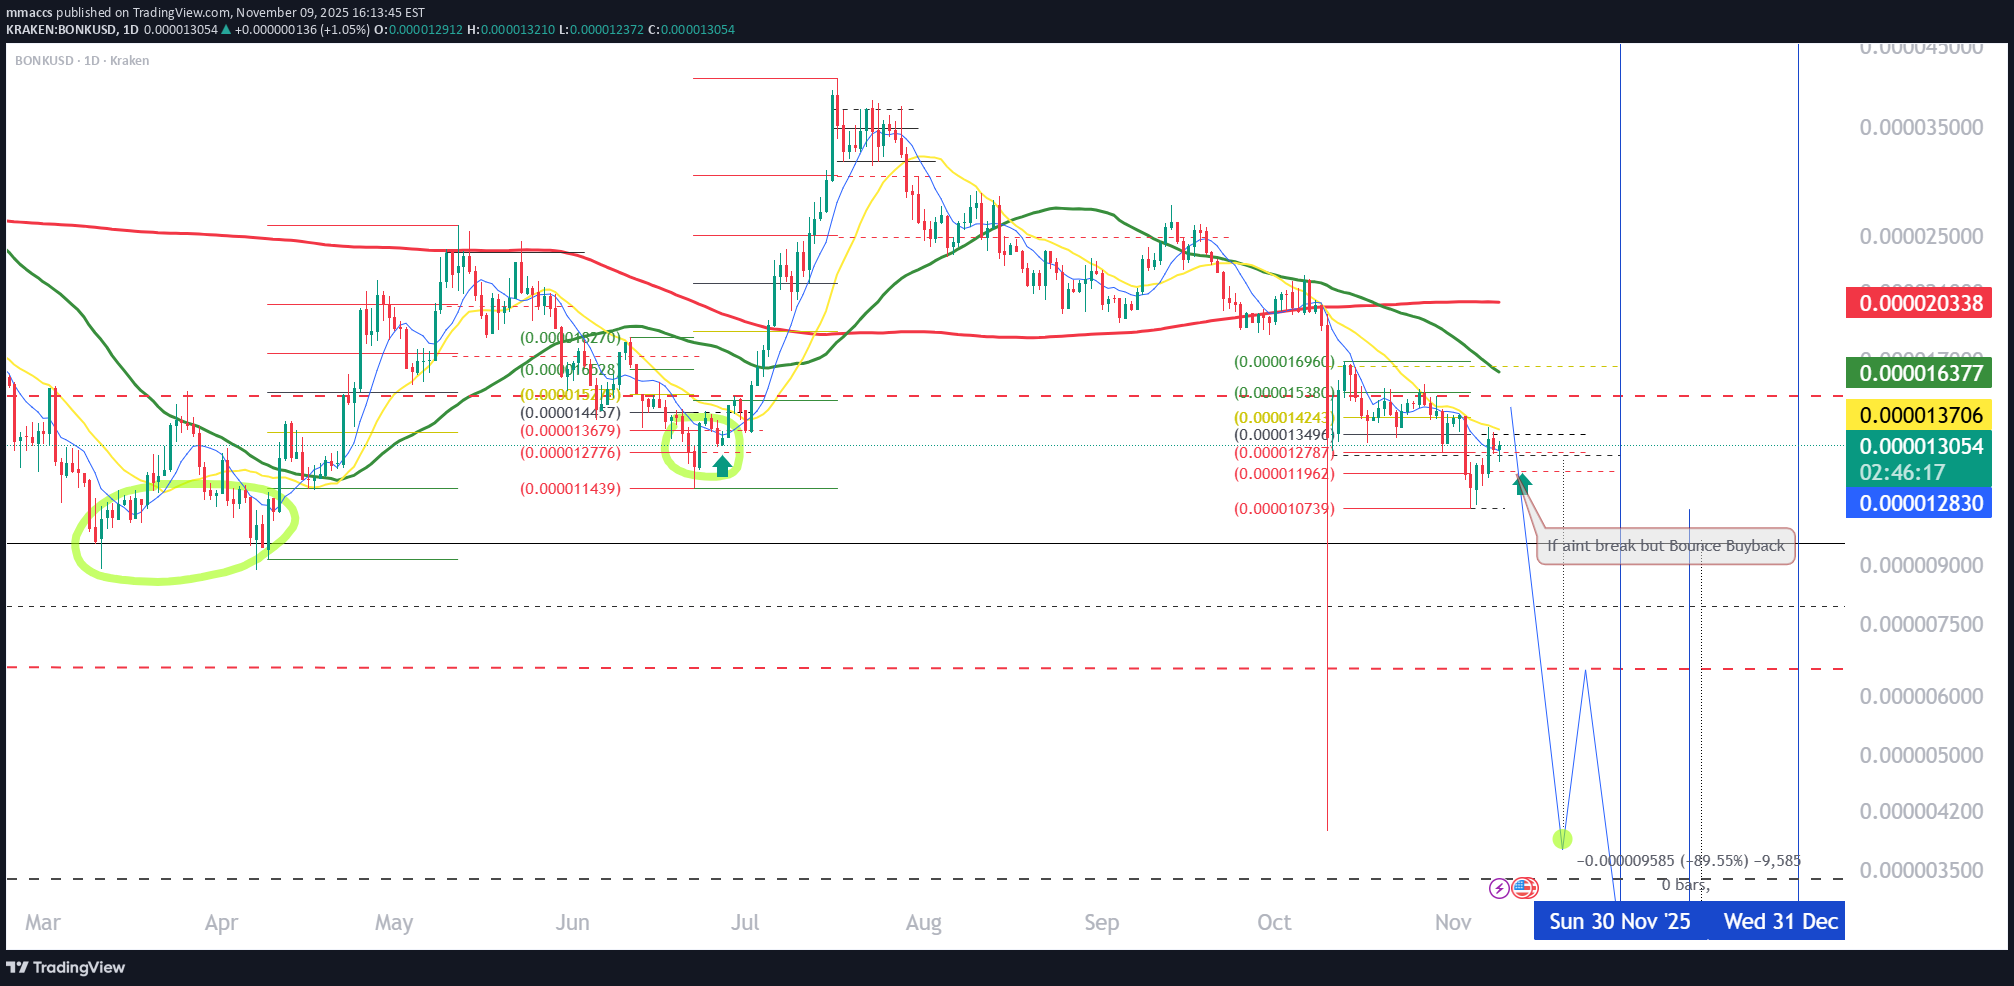
W Pattern 21 Jun could be aplly Now and bounce Up. BTC 50WSMA !! 1st step of Bonk Bounce Up is tight to BTC 50Weekly SMA holding as 1st step. BTC could drop even to 92K and The Bonk W turn into a Box with $0,000001 Support similar as what happened sibce march to april 2025 but ltaking less days. Is surprised how Bonk hold price since BTC even Break the shadow of 100K till 98K.BTC 50 W SMA hold along with 38.2 Fib from apr 2025 till ATH. Bonks Hold very good whhen BTC close the shadow and close the week bouncig back from 50 W SMA ( also up 38.2 Fib) Expecting Bulish day and odds to Bullish Continuation as the Rally that started in apil 2025 with a similar pattern

The_Alchemist_Trader_
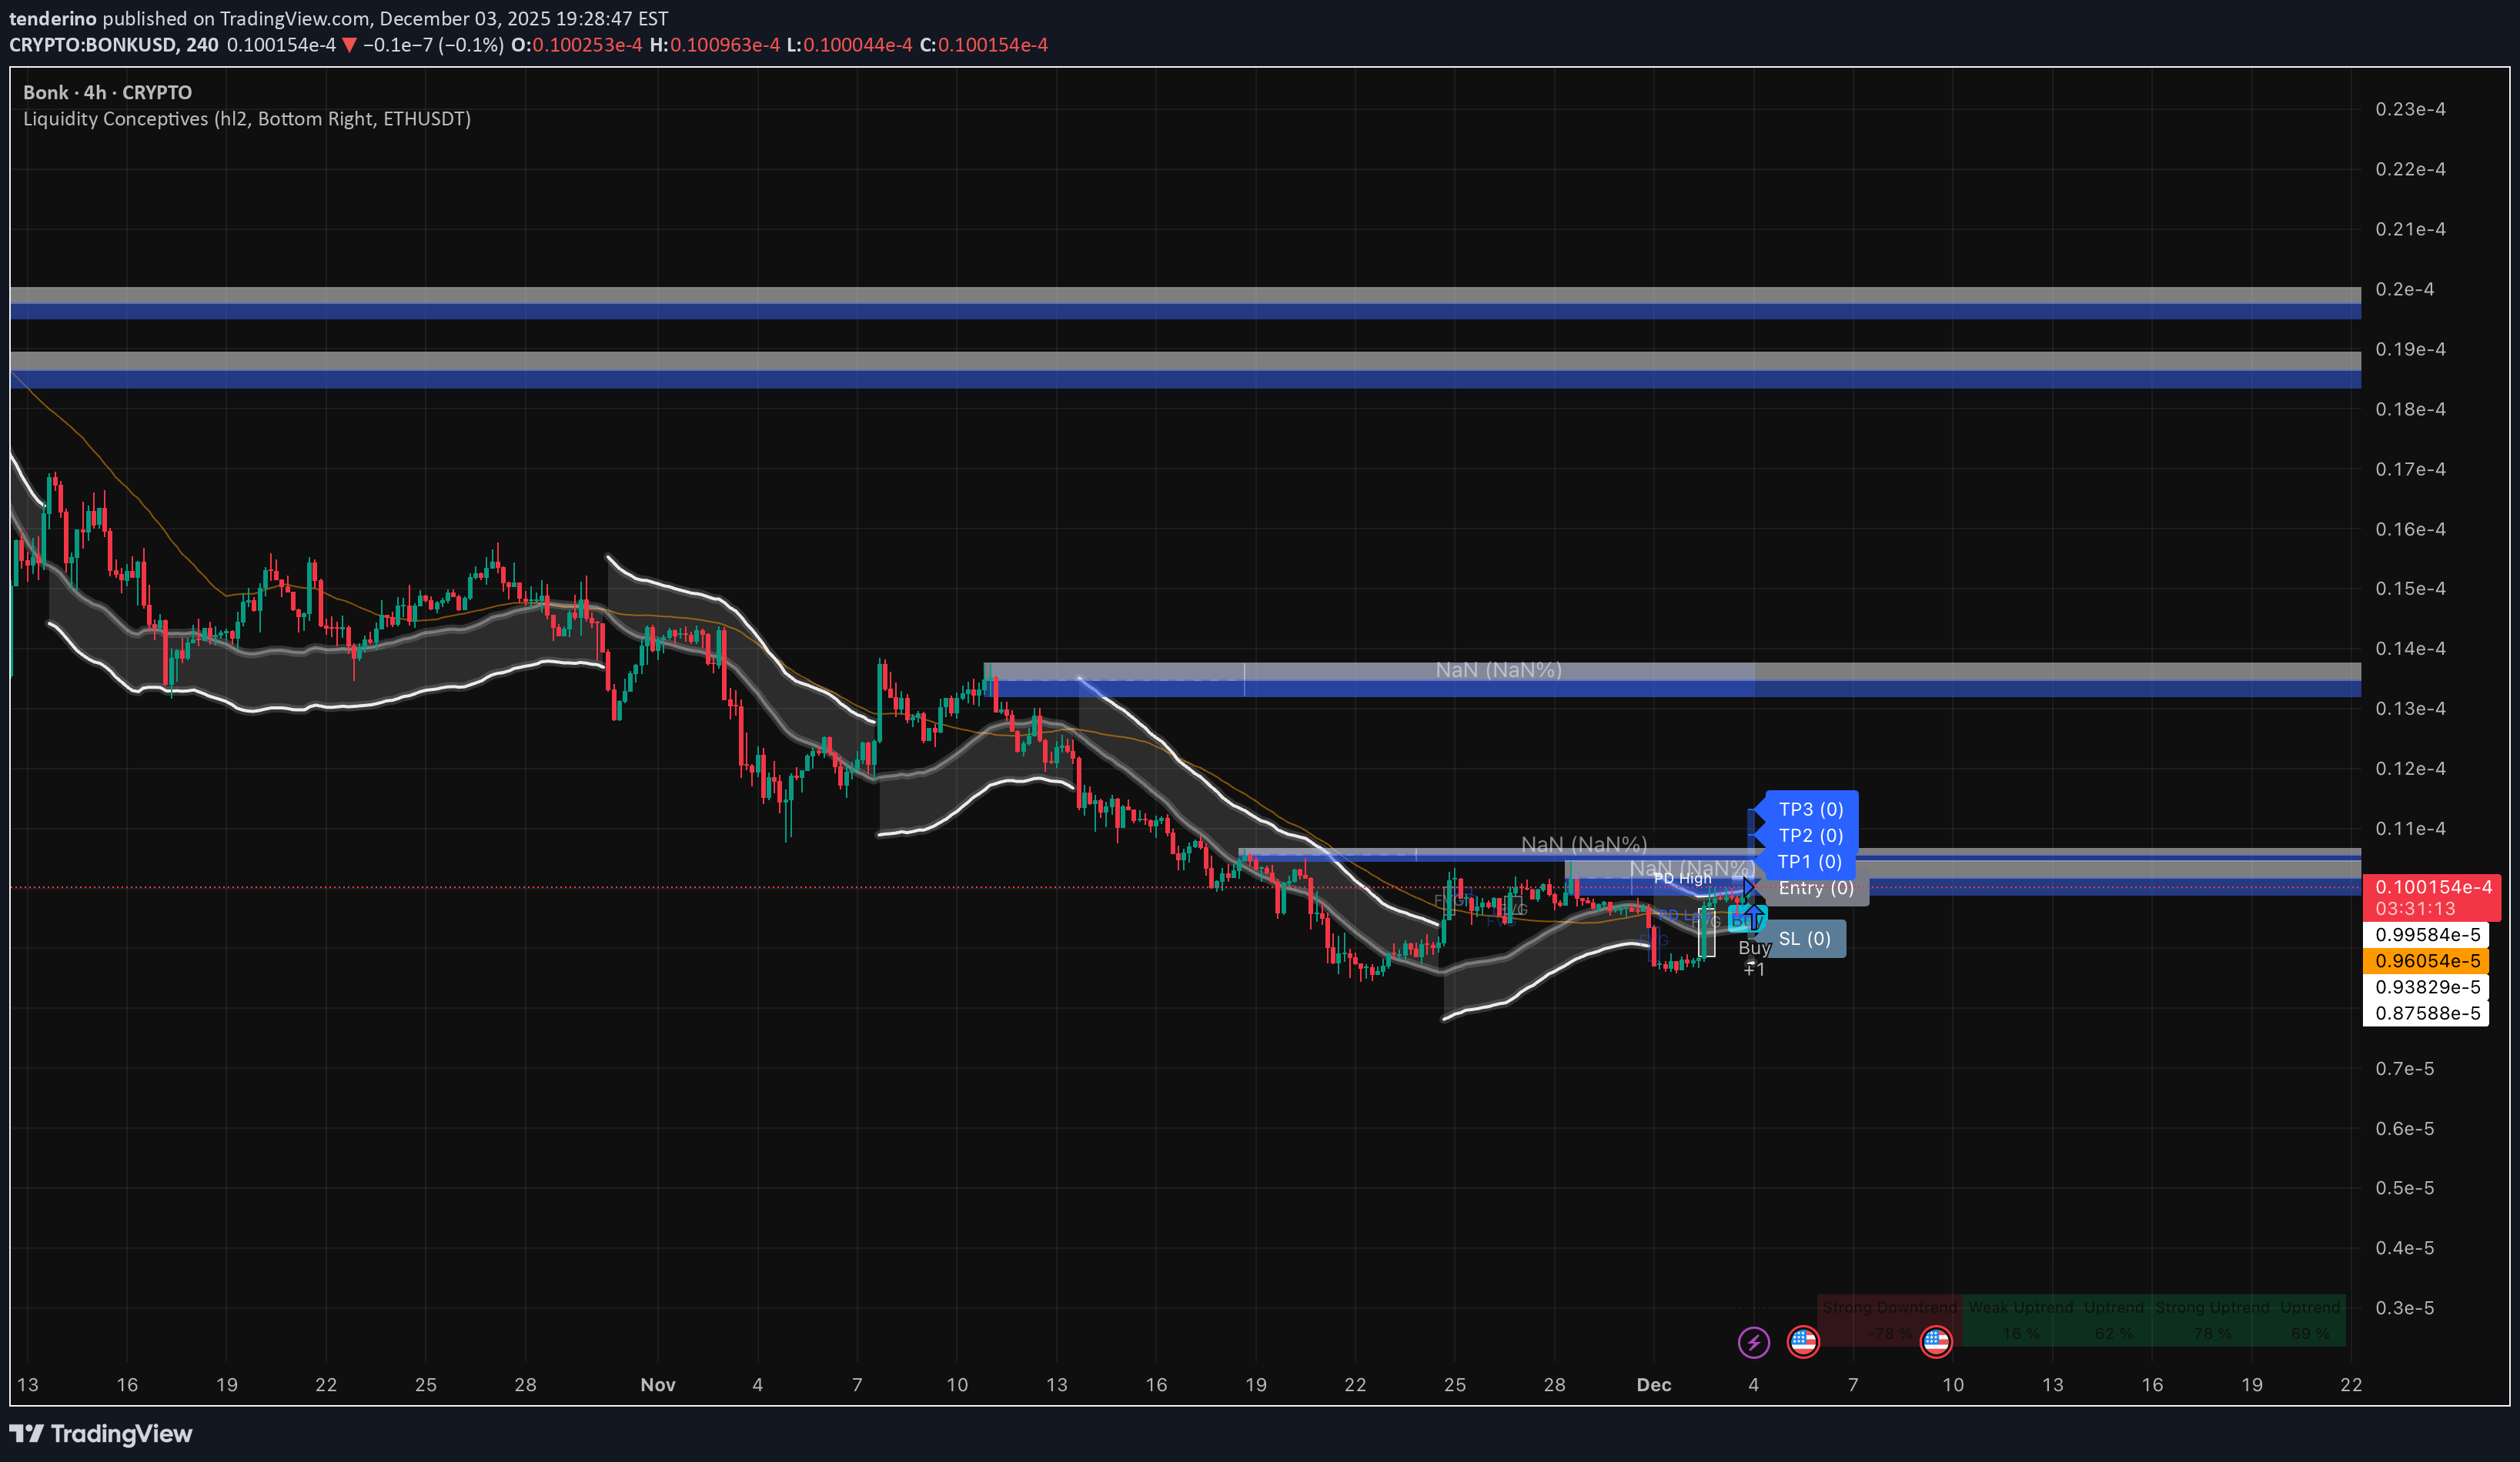
حمایت هفتگی بونک پابرجا: آیا زمان انفجار قیمتی فرا رسیده است؟
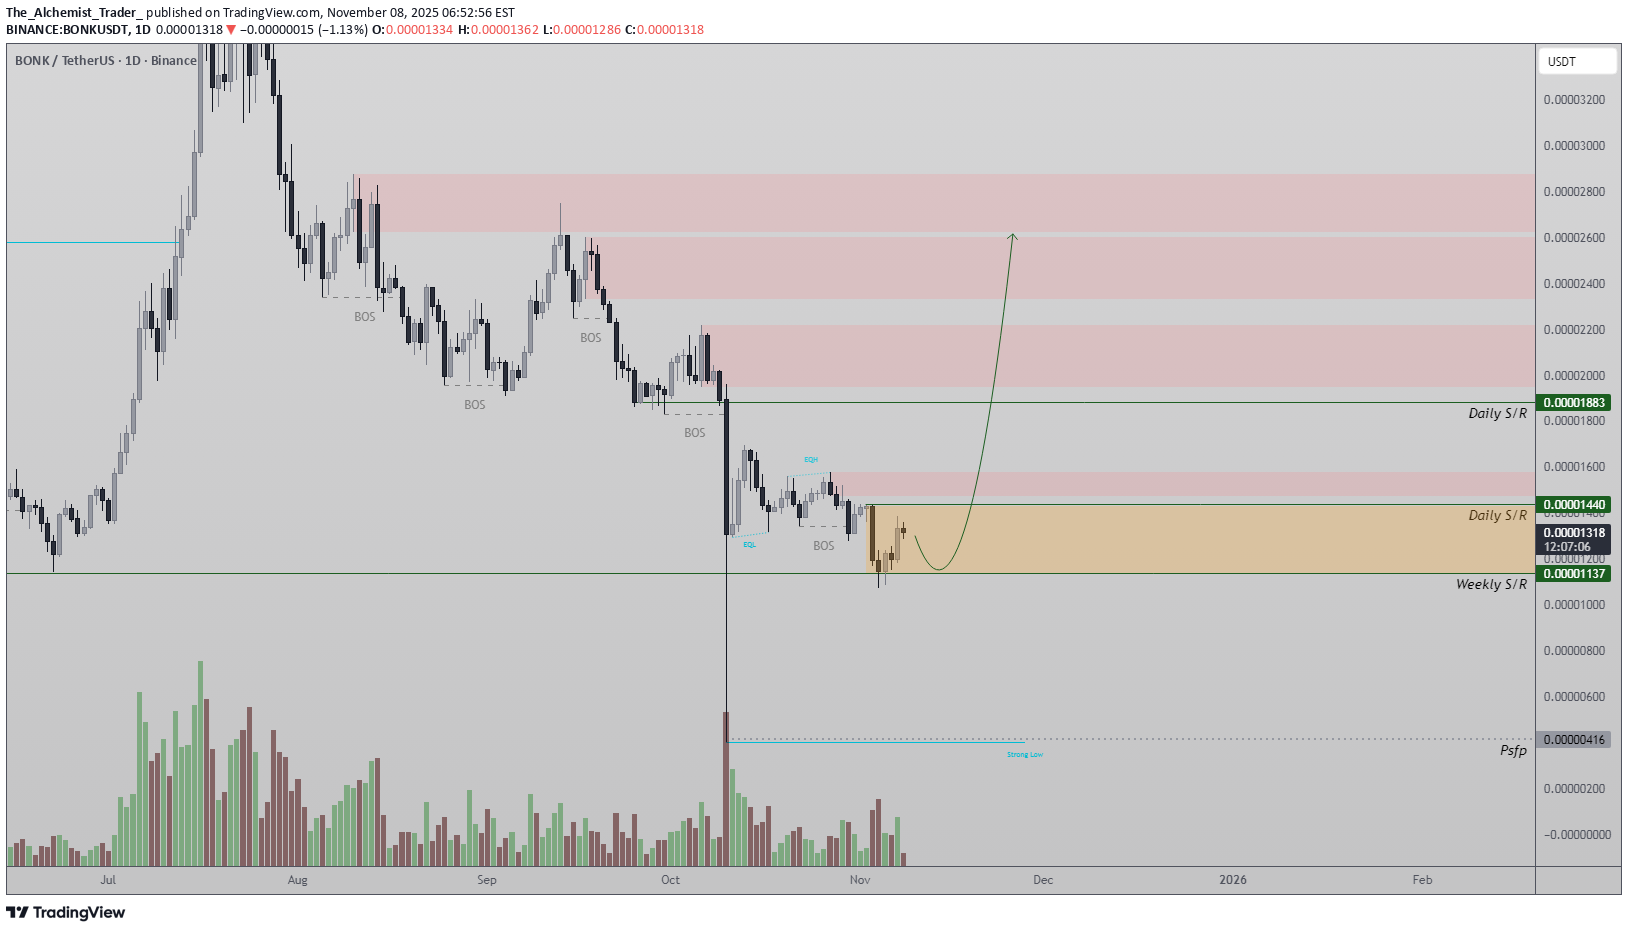
BONK price action is currently holding firm at a key weekly support region, an area that has seen multiple candle closes above in recent sessions. The latest engulfing candle suggests renewed buyer interest, though confirmation is still required for a clear directional move. As long as price remains between the weekly support and daily support, the market remains range-bound until proven otherwise. A breakout from this range must occur with strong volume and impulsive momentum to confirm a shift toward higher resistances. Without such validation, the current structure may continue oscillating within its established boundaries. Key Points: - Weekly Support Holding: Price continues to defend this critical structural zone. - Range-Bound Behavior: Trading confined between weekly and daily supports until breakout. - Volume Confirmation Needed: A bullish influx of volume is essential for sustainable breakout strength. From a technical perspective, the current region remains pivotal — a loss of weekly support would increase the probability of a deeper corrective move, while sustained defense could lay the foundation for upside continuation. What to Expect: As long as BONK holds above its weekly SR, expect gradual bullish continuation toward higher resistances. A breakdown below this level, however, would confirm renewed bearish momentum and open the path to lower liquidity zones.

ydnldn
پیشبینی شوکهکننده بونک (BONK): نقطه ورود، حد ضرر و سود تضمینی!
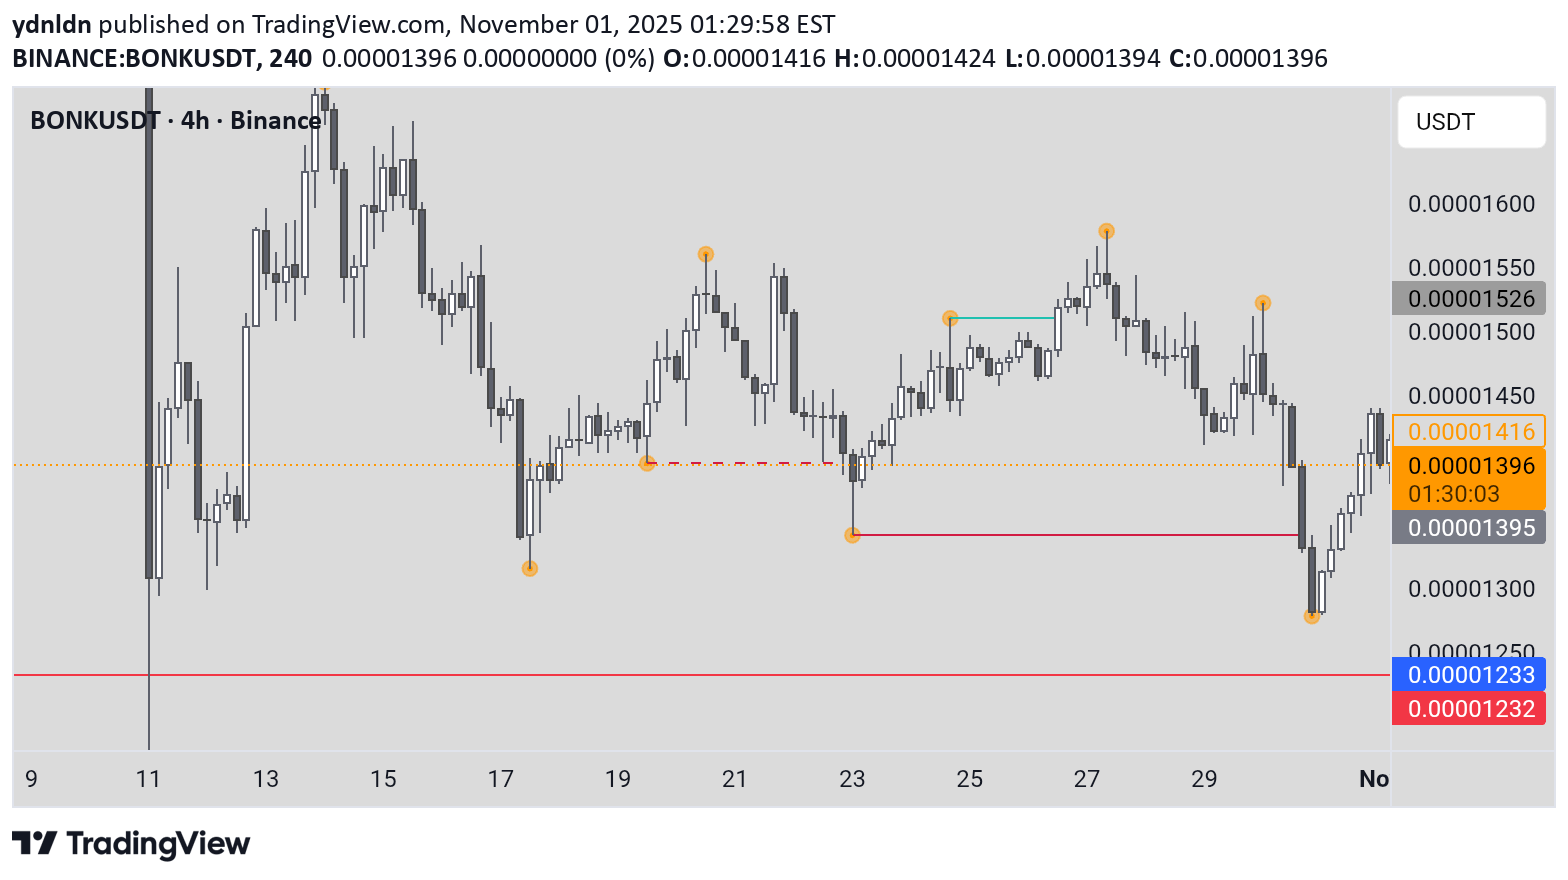
Entry Point: Short at a pullback to the broken support (now resistance) around 0.00001394, or immediately at current levels (~0.00001327) if momentum continues downward. Stop Loss (SL): Place above the recent high or the cyan trendline, around 0.00001500, to limit risk in case of a fakeout or rebound (risk ~10-15% from entry). Take Profit (TP): Target the next support levels visible on the chart, such as 0.00001232 (red line) for a conservative TP, or lower at 0.00001100 based on predictions. This could yield a 10-20% gain on the short, depending on entry.
pullbacksignal
سیگنال فروش قطعی بونک (BONKUSDT): تحلیل تکنیکال و اهداف قیمتی هیجانانگیز!
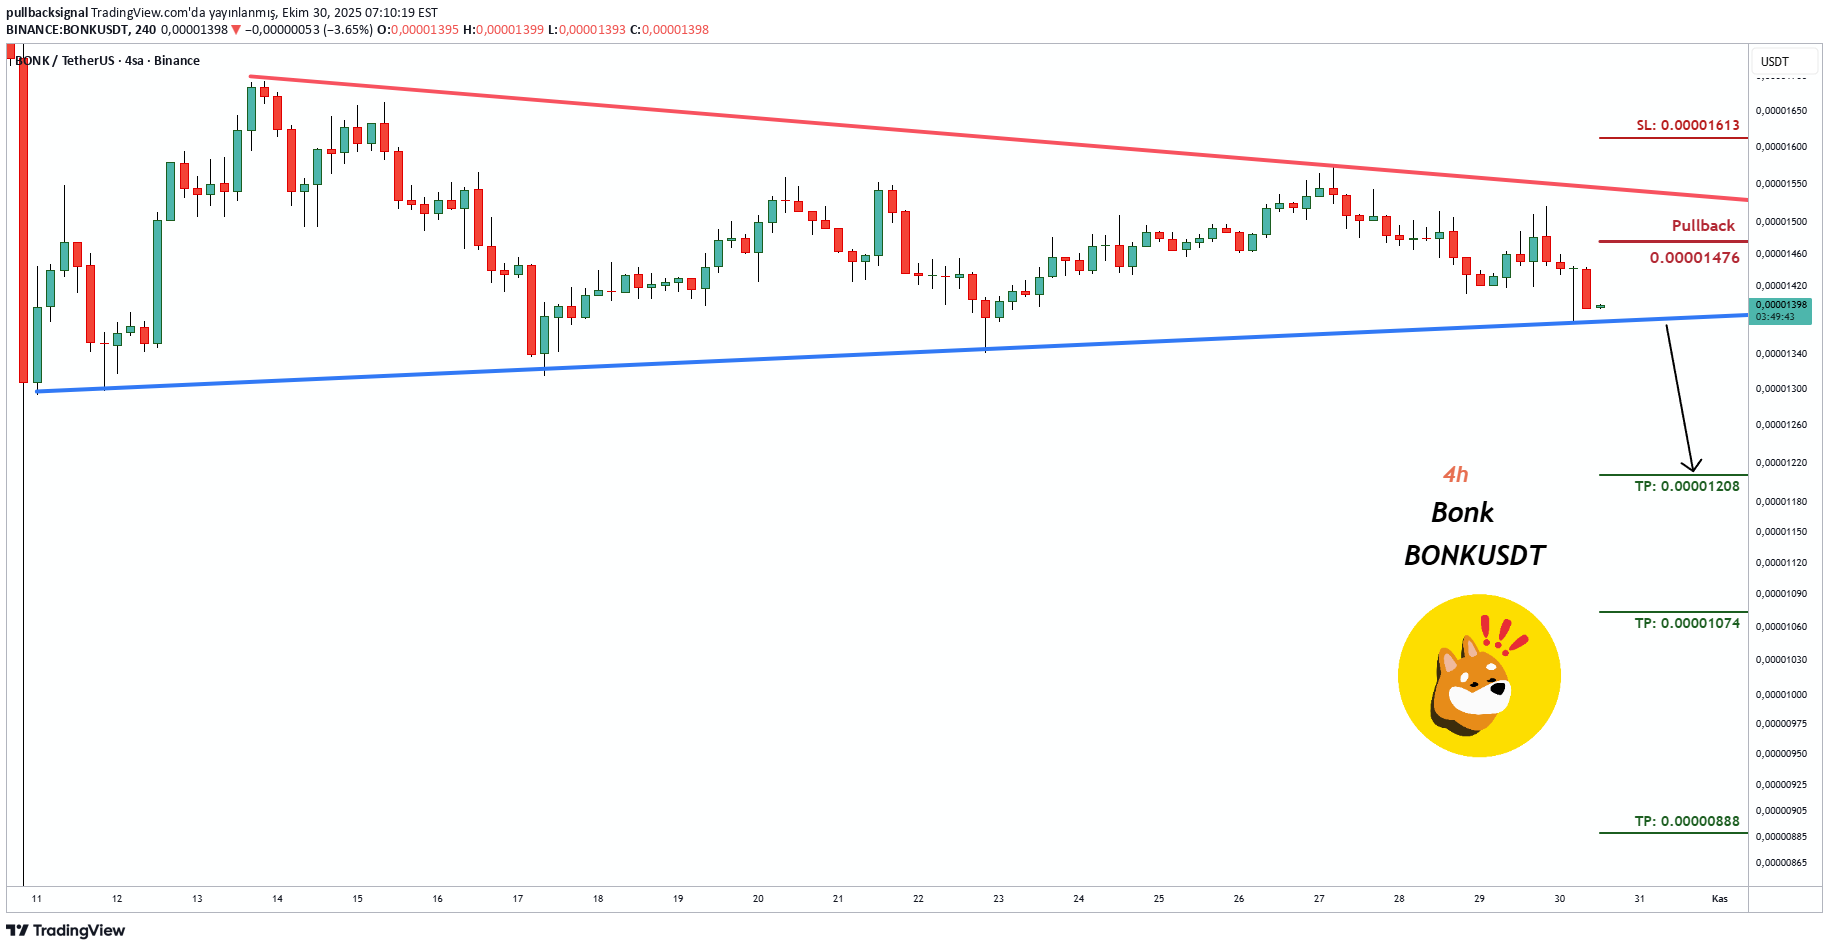
İşlem Kurulumu: BONKUSDT Bonk'ta (Vadeli İşlemler) (4s) bir İşlem Sinyali görülüyor İşlemciler ŞİMDİ Satış İşlemlerini açabilirler ⬇️ Şimdi veya 0,00001476'da sat ⭕️SL @ 0,00001613 🔵TP1 @ 0,00001208 🔵TP2 @ 0,00001074 🔵TP3 @ 0,00000888 Bu sinyaller neye dayanıyor? Klasik Teknik Analiz Fiyat Hareketi Mum Grafikleri Fibonacci RSI, Hareketli Ortalama, Ichimoku, Bollinger Bantları Risk Uyarısı Forex, CFD İşlemleri, Kripto, Vadeli İşlemler ve Hisse Senetleri kayıp riski taşır. Bu tür işlemlerin sizin için uygun olup olmadığını lütfen dikkatlice değerlendirin. Geçmiş performans, gelecekteki sonuçların göstergesi değildir. Fikirlerimizi beğendiyseniz, lütfen beğenileriniz 👍 ve yorumlarınızla bizi destekleyin.
Disclaimer
Any content and materials included in Sahmeto's website and official communication channels are a compilation of personal opinions and analyses and are not binding. They do not constitute any recommendation for buying, selling, entering or exiting the stock market and cryptocurrency market. Also, all news and analyses included in the website and channels are merely republished information from official and unofficial domestic and foreign sources, and it is obvious that users of the said content are responsible for following up and ensuring the authenticity and accuracy of the materials. Therefore, while disclaiming responsibility, it is declared that the responsibility for any decision-making, action, and potential profit and loss in the capital market and cryptocurrency market lies with the trader.