
DEXWireNews
@t_DEXWireNews

What symbols does the trader recommend buying?
Purchase History
پیام های تریدر
Filter
DEXWireNews
Strategy Inc (NASDAQ: $MSTR) Might Be Gearing For A Breakout

Strategy Inc (NASDAQ: MSTR ) shares might be set for a bullish move albeit market drawback. With the RSI at 49 MSTR needs to break the 61.8% Fib level to accentuate the next levels for $MSTR. Since the month of June 2025, the asset has lost 66% of its value moving in tandem with BTC 's momentum. In recent news, Index provider MSCI late Tuesday said it would not boot publicly traded companies with big holdings of digital assets such as bitcoin from its indexes—for now. Fans of Strategy (MSTR), the company made famous for stockpiling cryptocurrency, applauded the decision: Its stock was recently up about 4%, a bit off earlier highs. The news removed, or at least delayed, an overhang from Strategy's shares. MSCI last fall proposed removing digital asset treasury companies, or DATCOs, from its indexes following a proliferation of firms of that ilk, saying they resemble investment funds, which aren't eligible for inclusion. That spooked investors, as analysts estimated the move could spur other index providers to follow suit and cost the company billions in outflows. Analyst Summary According to 15 analysts, the average rating for MSTR stock is "Strong Buy." The 12-month stock price target is $485.86, which is an increase of 200.23% from the latest price. About MSTR Strategy Inc, together with its subsidiaries, operates as a bitcoin treasury company in the United States, Europe, the Middle East, Africa, and internationally. The company offers investors varying degrees of economic exposure to Bitcoin by offering a range of securities, including equity and fixed income instruments. It also provides AI-powered enterprise analytics software, including Strategy One.
DEXWireNews
Breaking: $PEPE Spike 37% Gearing for 300% Surge

The price of the notable memecoin on ethereum chain- PEPE saw its value rise by 37% for the past 24 hours breaking above a bullish symmetrical triangle setting the stage for 300% breakout albeit market drawback. The memecoin has loss over 72% of its market value for the past 9 months consolidating in a tight symmetrical triangle pattern. As of the time of writing, PEPE is up 16% with its RSI at 72, there is more room for PEPE to capitalise on the bullish symmetrical triangle pattern. About Pepe What Is PEPE? PEPE is a deflationary memecoin launched on Ethereum. The cryptocurrency was created as a tribute to the Pepe the Frog internet meme, created by Matt Furie, which gained popularity in the early 2000s. The project aims to capitalize on the popularity of meme coins, like Shiba Inu and Dogecoin, and strives to establish itself as one of the top meme-based cryptocurrencies. PEPE appeals to the cryptocurrency community by instituting a no-tax policy and being up-front about its lack of utility, keeping things pure and simple as a memecoin. Pepe Price Data The Pepe price today is $0.000006 USD with a 24-hour trading volume of $1,348,293,008 USD. Pepe is up 37.49% in the last 24 hours. The current CoinMarketCap ranking is #36, with a market cap of $2,406,442,835 USD. It has a circulating supply of 420,689,899,653,543 PEPE coins and a max. supply of 420,689,899,653,543 PEPE coins.
DEXWireNews
بیت کوین دوباره مرز 90 هزار دلار را فتح کرد: آیا این صعود ادامه دارد؟

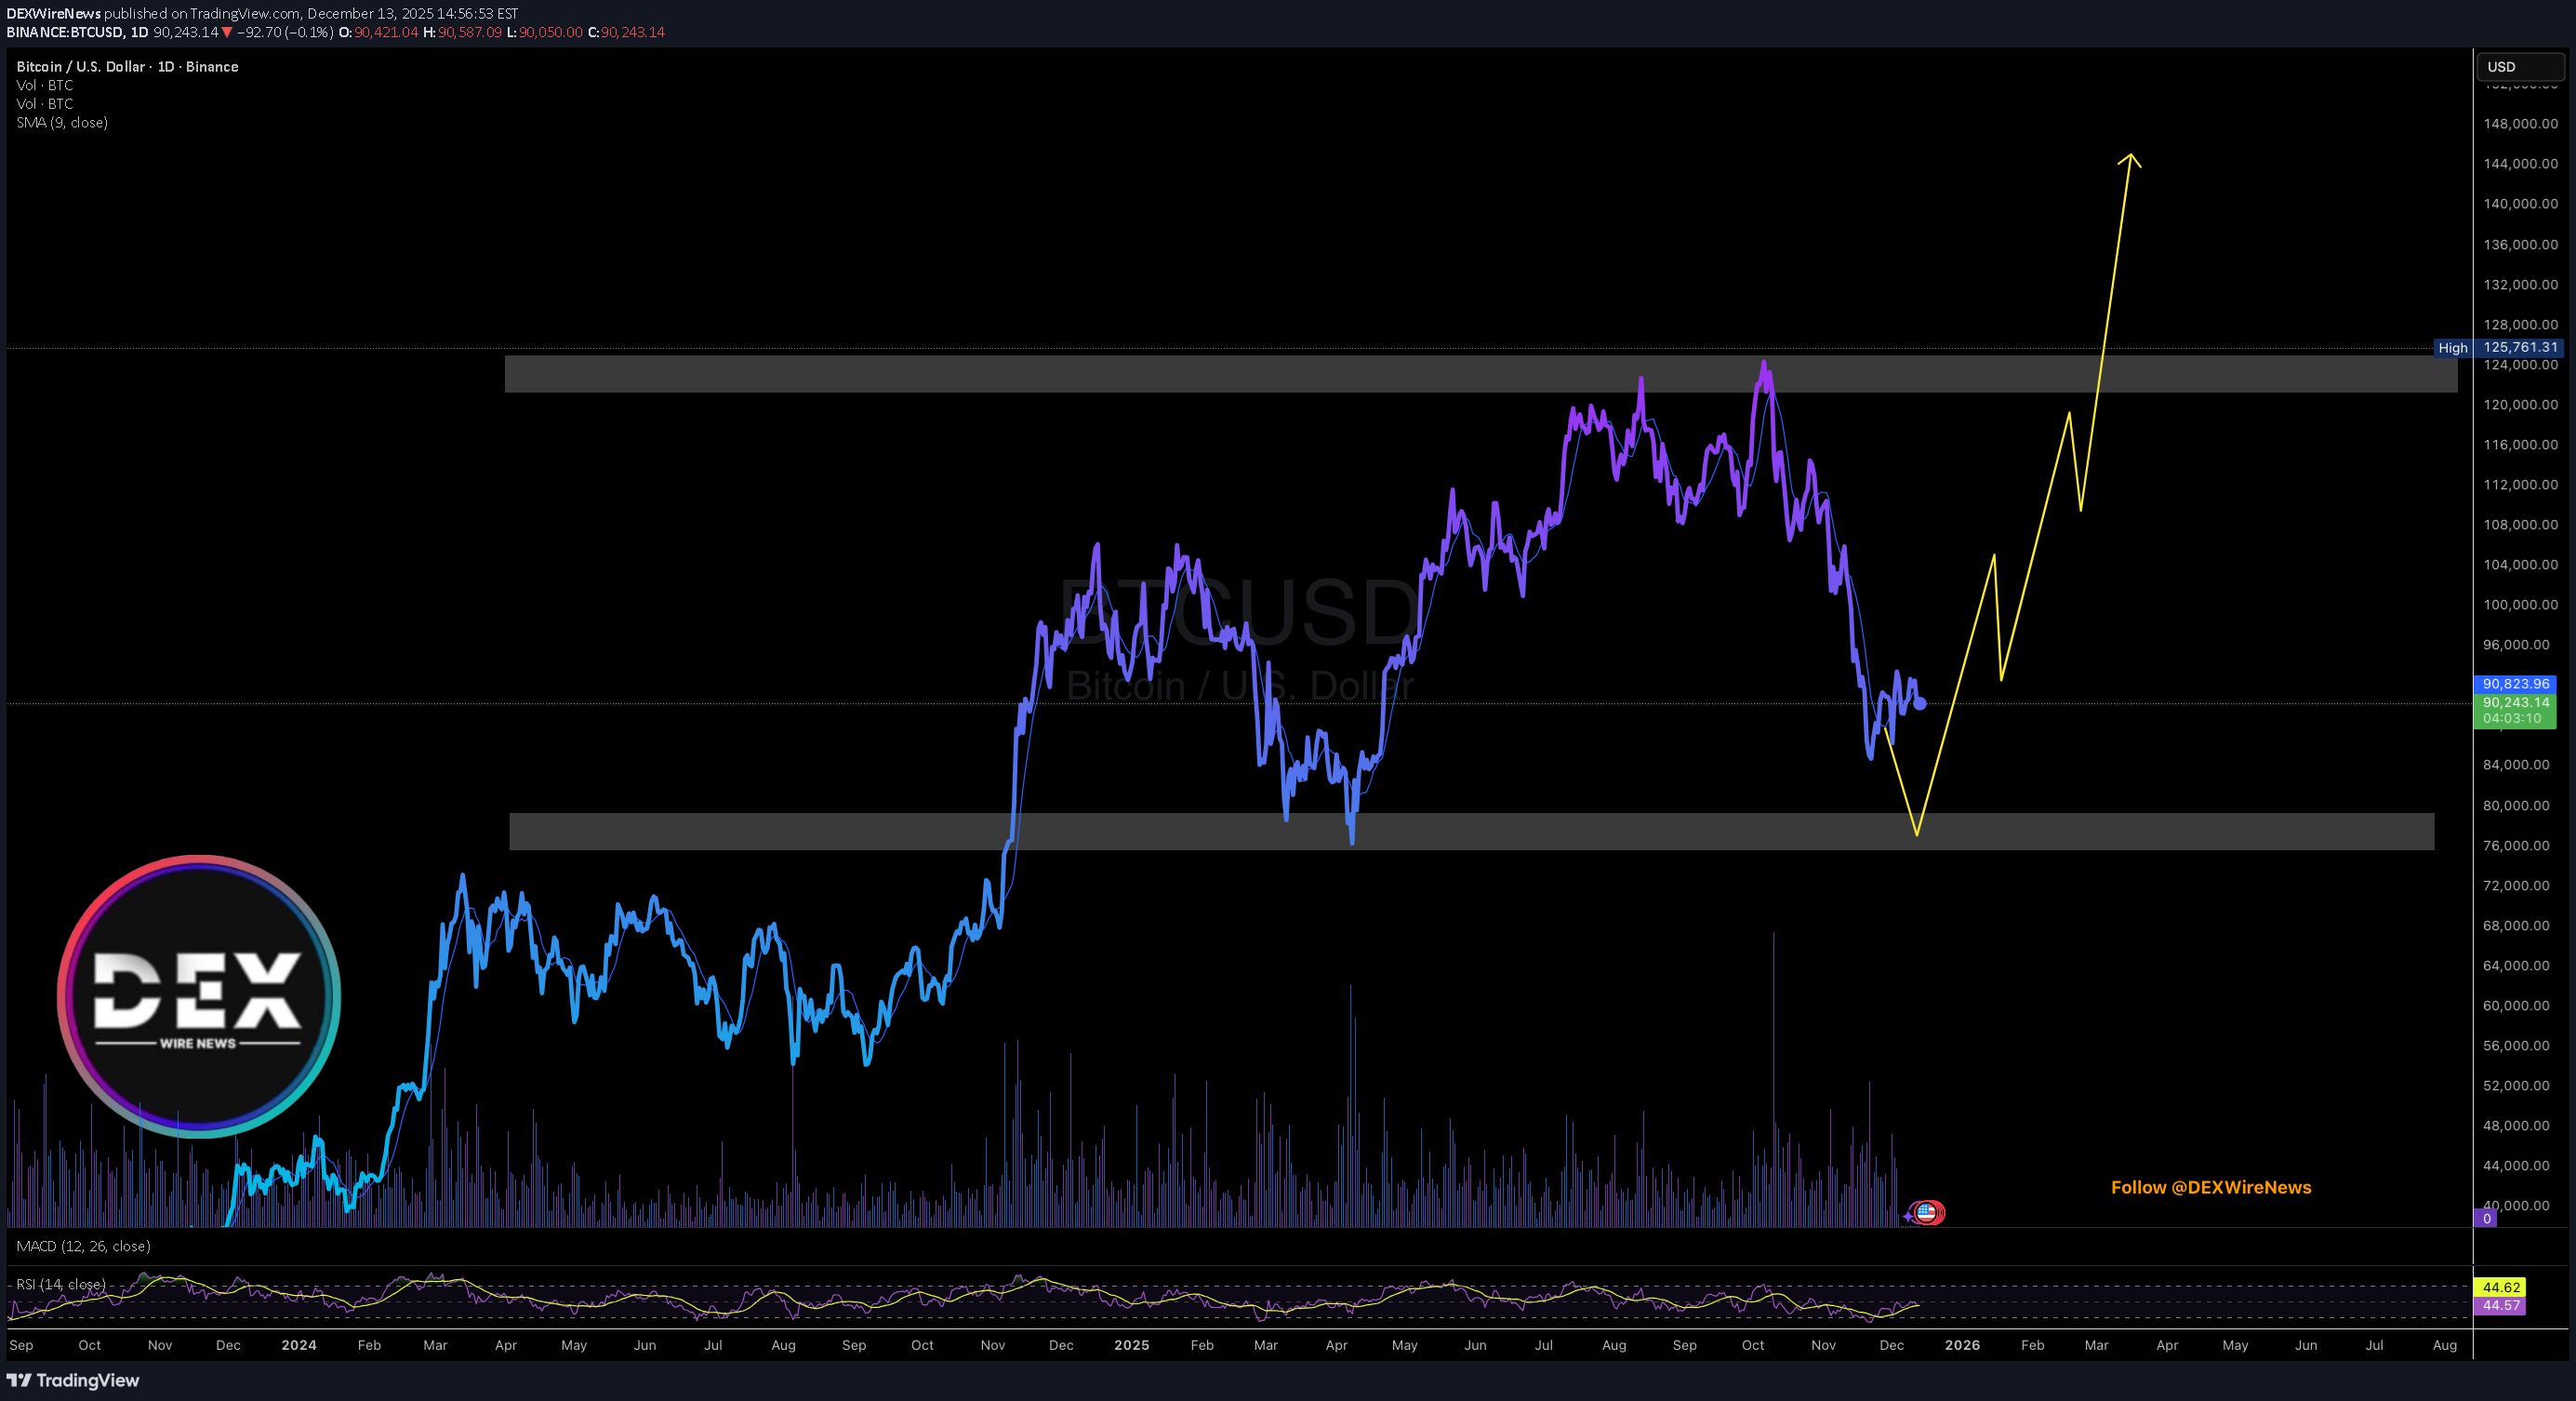
The price of BTC saw a noteworthy uptick to the $90k zone amidst bearish sentiment. The $80k levels is still acting as consolidation zone for BTC but failure to hold that level might resort to selling spree. On a bullish thesis, As per data from crypto quant, the open interest of BTC on all exchanges is up 6% the highest in over 3 months. This is a bullish sign imo. in another news, Spot Bitcoin exchange-traded funds recorded $782 million in combined withdrawals during Christmas week, extending a six-day outflow streak as seasonal factors impacted institutional positioning. Friday marked the largest single-day withdrawal, with $276 million exiting the products. BlackRock's IBIT led Friday's outflows with nearly $193 million in redemptions, followed by Fidelity's FBTC at $74 million. Grayscale's GBTC also posted modest withdrawals as total net assets across U.S.-listed spot Bitcoin ETFs fell to roughly $113.5 billion from peaks above $120 billion earlier in December.
DEXWireNews
Gold, Silver Smash Records as End-Of-Year Rally Continues

Gold, silver, and platinum extended a historic end-of-year rally for precious metals, jumping to all-time highs, with spot gold peaking above $4,530 an ounce. DICK'S Sporting Goods has recently seen its fair value estimate decrease slightly, down from $240.33 to $236.43 per share. This shift comes as the discount rate moves higher, now at 9.45 percent compared to the previous 8.73 percent. This change reflects analysts' increased caution about the company's evolving risk profile. As the company integrates its acquisition of Foot Locker and issues new guidance, investors should stay tuned to discover how they can stay ahead of shifts in the DICK'S Sporting Goods narrative moving forward. Technically, XAU is approaching the $4600 point as momentum peaks as the asset is up 1.41%. The daily price chart depicts a bullish flag pattern with the asset breaking above the 38.2% Fib level.
DEXWireNews
Tesla to Invest Nearly $1.2 billion Into Battery cell production
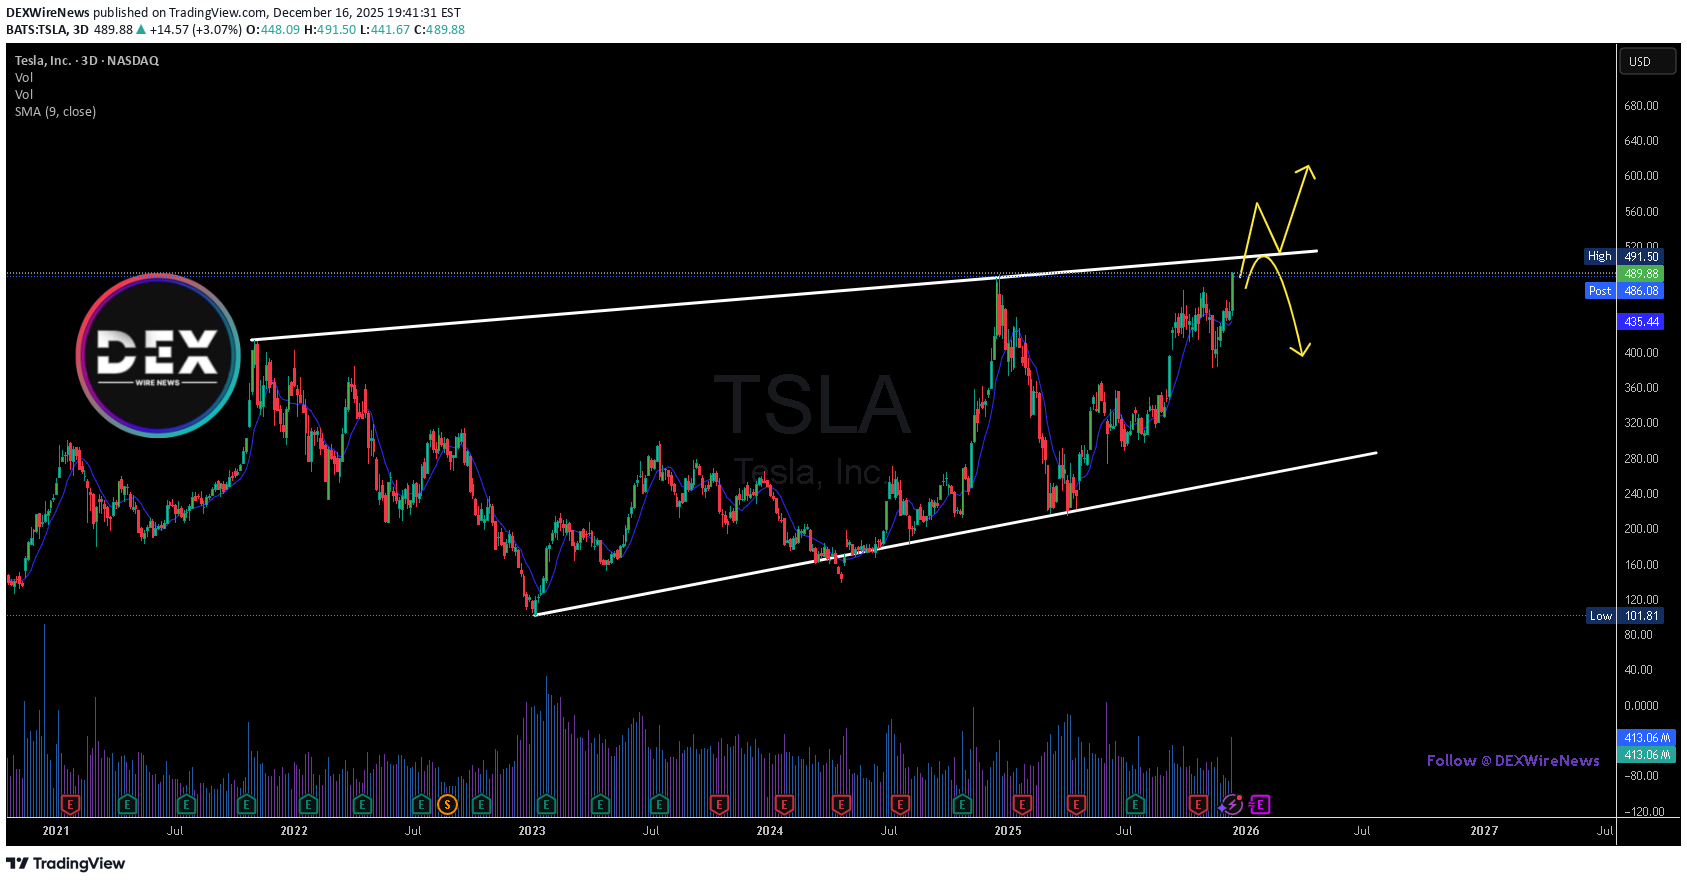
Tesla, Inc. (NASDAQ: TSLA ) announced plans to invest nearly €1 billion ($1.2 billion) into battery cell production at its Gruenheide gigafactory in Germany, with output expected to reach up to 8 gigawatt hours annually starting in 2027. The move strengthens Tesla’s vertical integration strategy, allowing battery cells and vehicles to be produced at a single European site. Management highlighted that this structure improves supply chain resilience and positions Tesla more competitively against China and the U.S., despite acknowledging that large-scale battery production remains challenging in Europe due to cost pressures. Fundamentally, the investment signals Tesla’s long-term commitment to Europe, even as its regional market share has come under pressure. By localizing more of the battery value chain, Tesla aims to reduce reliance on imports, control costs over time, and improve margins once scale is achieved. While near-term financial impact is limited, the strategy supports Tesla’s broader push into energy efficiency, battery innovation, and manufacturing autonomy. Technically, the chart shows TSLA trading within a long-term rising channel that has guided price action since early 2023. Shares recently surged toward the upper boundary of this channel near the $490–$500 zone, an area that aligns with prior highs and visible resistance. The strong rally has pushed price well above the 9-period moving average, signaling extended conditions in the short term. A rejection from the channel top could trigger a pullback toward the $430–$450 support region, where buyers previously stepped in. Conversely, a decisive breakout above channel resistance would open the door toward the $550–$600 range, as projected by the measured move on the chart. Overall, TSLA remains structurally bullish, but near-term price action hinges on whether buyers can absorb supply at this critical resistance level.
DEXWireNews
کوینبیس از دلاور به تگزاس رفت: تغییر ساختار قانونی چه تاثیری بر قیمت COIN دارد؟
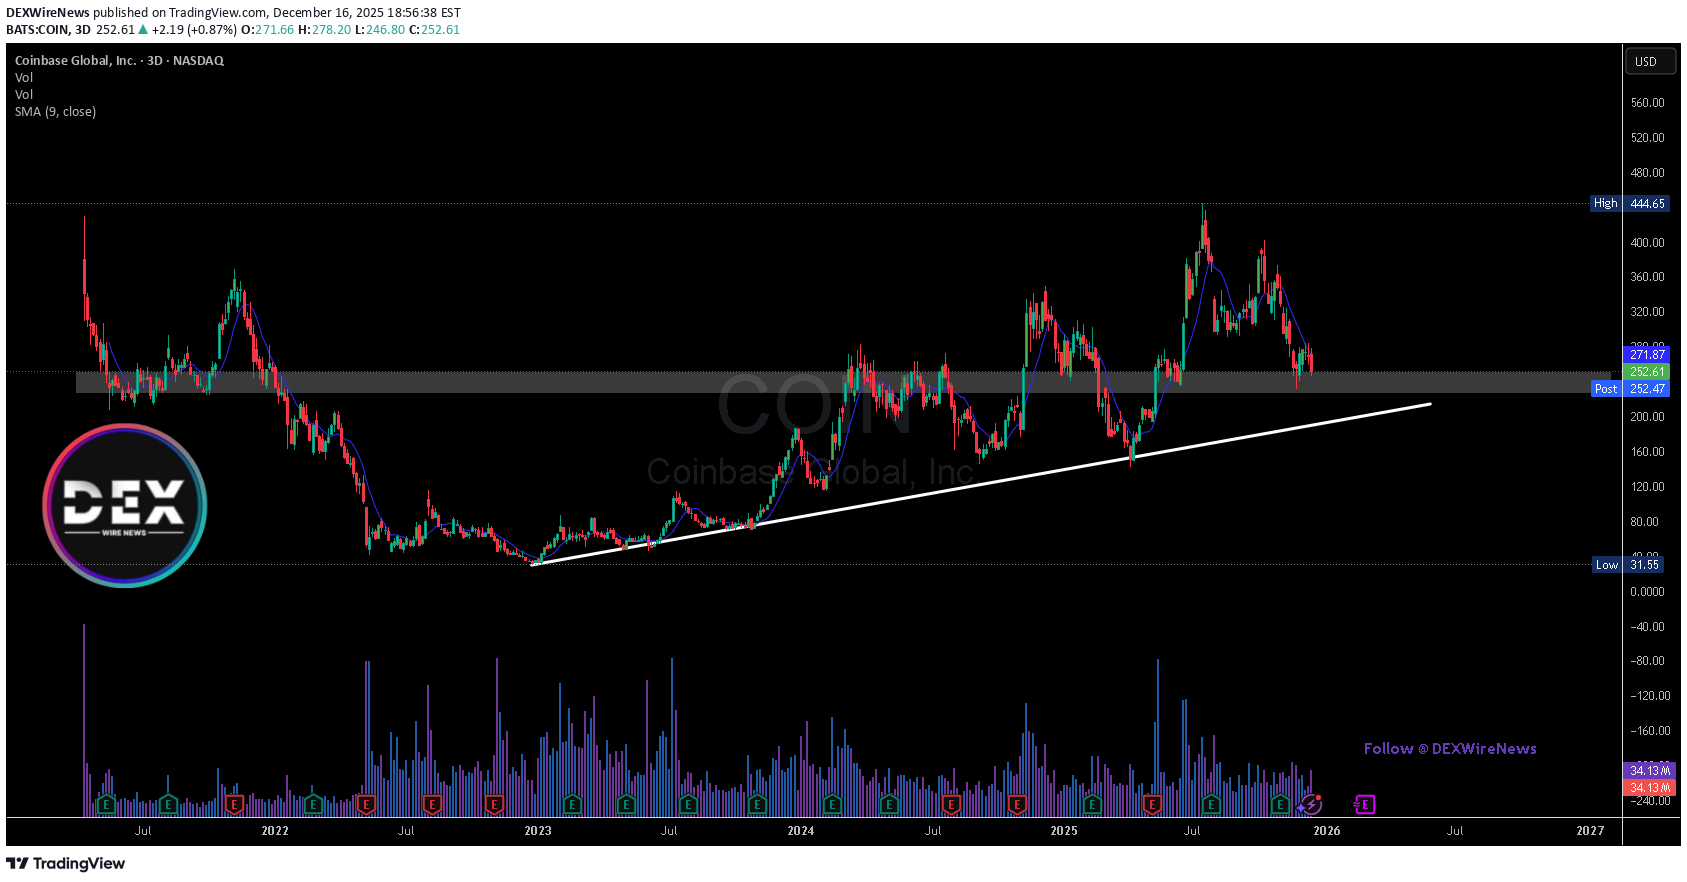
Coinbase Global, Inc. (NASDAQ: COIN ) has completed its reincorporation from Delaware to Texas, effective December 15, 2025. The move is largely administrative and does not change Coinbase’s business operations, management structure, or day-to-day activities. The company confirmed that its Class A common stock will continue trading on Nasdaq under the ticker COIN, with no disruption to shareholders or customers. While certain shareholder rights are now governed under Texas law, Coinbase emphasized continuity across assets, obligations, and strategic direction. The decision reflects a broader trend of corporations reassessing legal domiciles amid evolving regulatory and governance considerations. From a fundamentals perspective, the reincorporation does not materially impact Coinbase’s revenue streams, balance sheet, or growth outlook. Coinbase remains closely tied to crypto market activity, institutional adoption, and regulatory clarity in the U.S. Any long-term valuation impact will likely depend more on trading volumes, ETF-related flows, and broader digital asset sentiment than on corporate structure changes. Technically, the chart shows COIN pulling back sharply from recent highs near the $440 area, entering a corrective phase. Price is now testing a key demand zone around the $250–$260 region, which previously acted as both resistance and support. This area aligns closely with the rising long-term trendline, suggesting a technically important inflection point. Holding above this zone could support a bounce toward the $300–$320 range, while a clean breakdown would expose downside risk toward the low $200s. Momentum indicators have cooled, pointing to consolidation rather than immediate trend continuation. Overall, COIN remains structurally bullish on a long-term basis, but short-term price action hinges on whether buyers defend this critical support level.
DEXWireNews
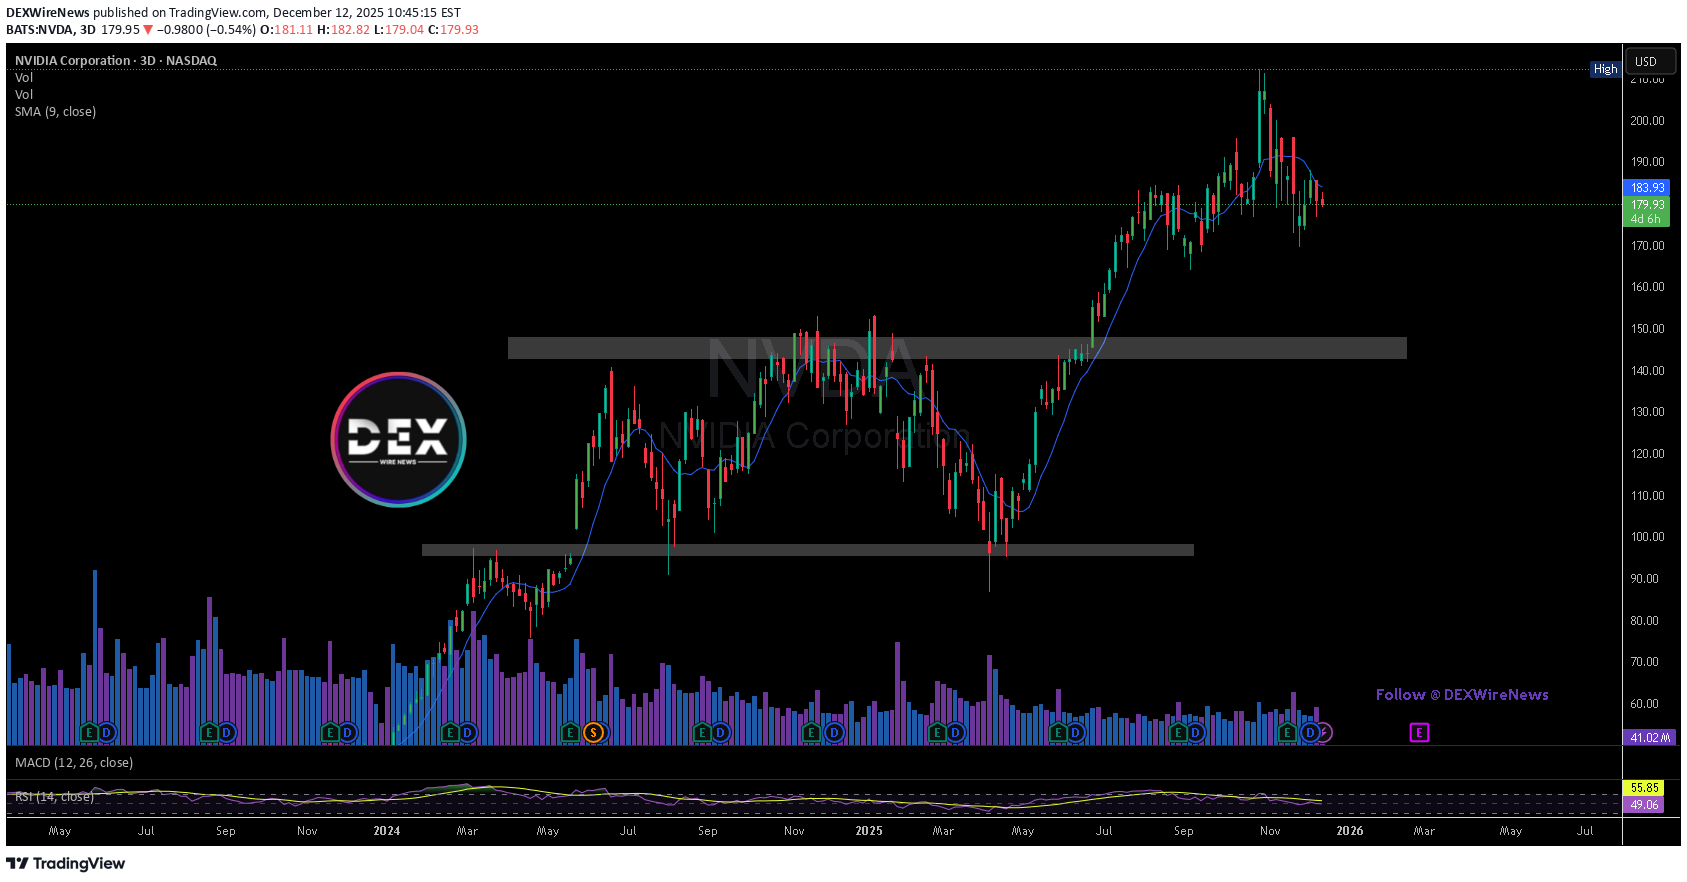
NVIDIA Strengthens AI Stack With SchedMD Acquisition
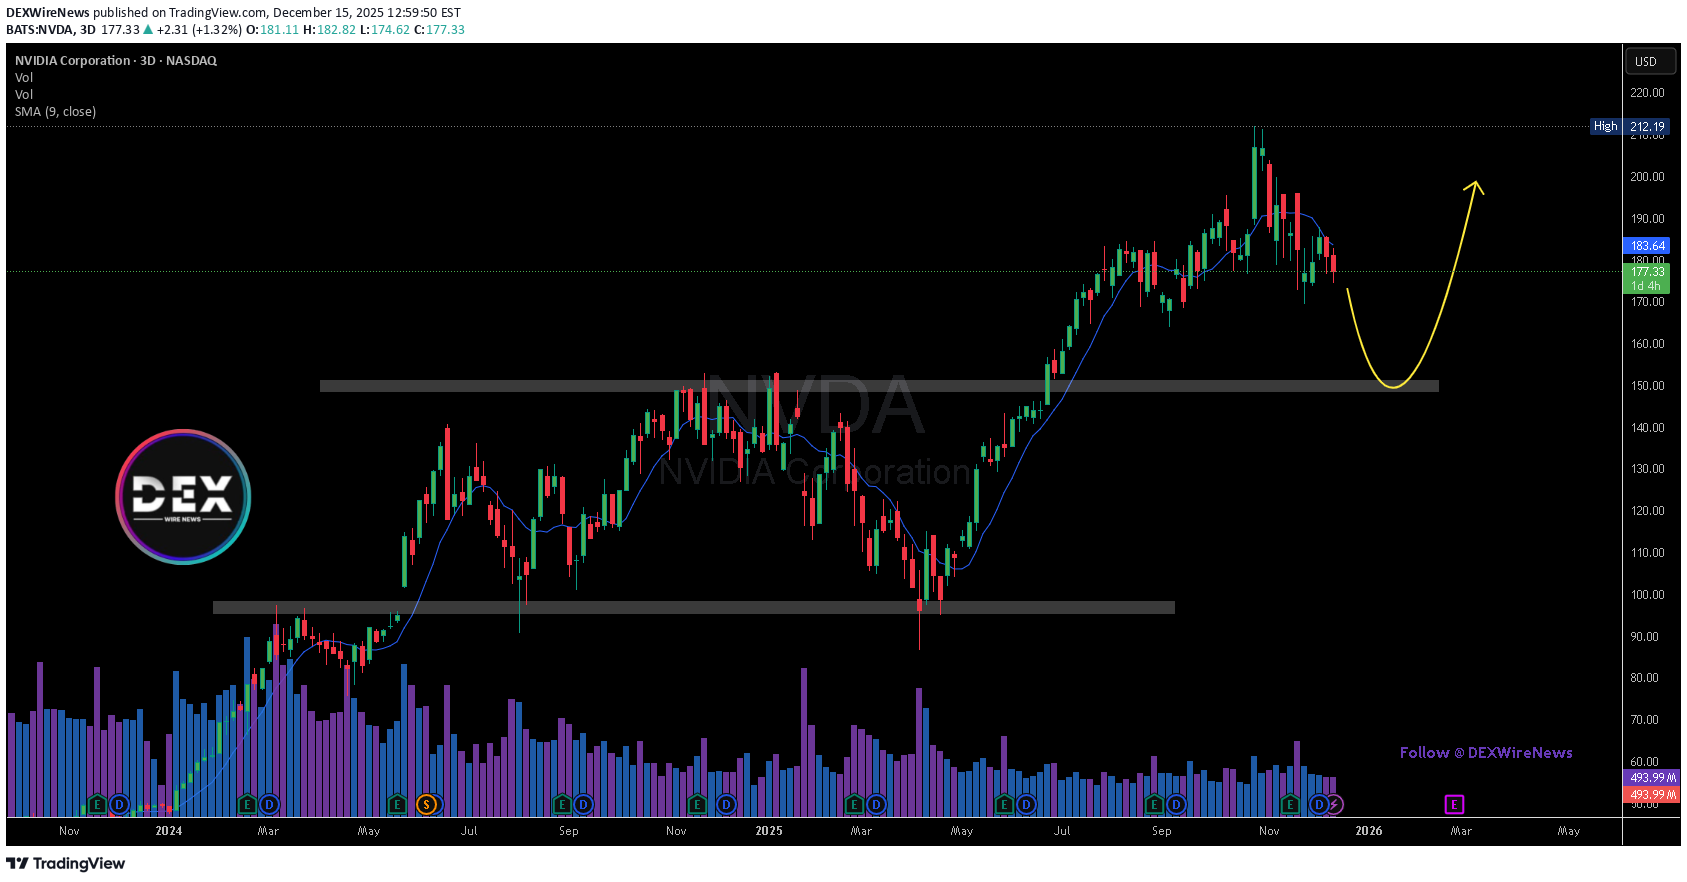
NVIDIA (NASDAQ: NVDA) has expanded its software and infrastructure footprint with the acquisition of SchedMD, the developer of Slurm — the world’s most widely used open-source workload manager for high-performance computing (HPC) and AI. The move reinforces NVIDIA’s strategy of controlling not just compute hardware, but also the software layers that orchestrate large-scale AI workloads. Slurm plays a critical role in scheduling, queuing, and allocating resources across massive compute clusters, and is currently used in more than half of the world’s top supercomputers. As AI model training and inference grow more complex and resource-intensive, efficient workload management has become essential. By acquiring SchedMD, NVIDIA gains deeper integration between its accelerated hardware and the software infrastructure that powers AI and HPC environments. Importantly, NVIDIA confirmed that Slurm will remain open-source and vendor-neutral. This signals a clear effort to strengthen the broader AI ecosystem rather than lock customers into proprietary software. NVIDIA plans to continue investing in Slurm’s development while expanding its compatibility across heterogeneous clusters, cloud providers, and enterprise systems. This positions NVIDIA as a central enabler of next-generation AI infrastructure across industries such as healthcare, autonomous driving, finance, manufacturing, and government research. From a technical perspective, NVDA is currently consolidating after a strong multi-month rally. Price has pulled back from recent highs near the $210 area and is trading below short-term resistance around $180–$185. The chart highlights a key demand zone near the $150 region, which previously acted as a breakout level and aligns with strong historical support. A deeper retracement toward this zone could offer a technical reset before the next leg higher. If buyers successfully defend support and reclaim $185, NVDA could resume its broader uptrend toward prior highs. Overall, the fundamentals remain firmly bullish, with the SchedMD acquisition strengthening NVIDIA’s long-term AI dominance as the stock navigates a short-term technical consolidation.
DEXWireNews
بیت کوین در راه ۷۰ هزار دلار؟ کاهش قیمت در آستانه رالی جدید!
The price of Bitcoin is poised to dip to the $70k support to shake off weak hands before picking liquidity up albeit the market is generally bearish. The $70k support is feasible or nearest support zone for bitcoin to consolidate before going back up. In similar context, as per data from crypto quant the open interest of Bitcoin on all exchanges is down 0.45% losing roughly $29 billion. This data further solidifies our bearish thesis on $BTC.
DEXWireNews
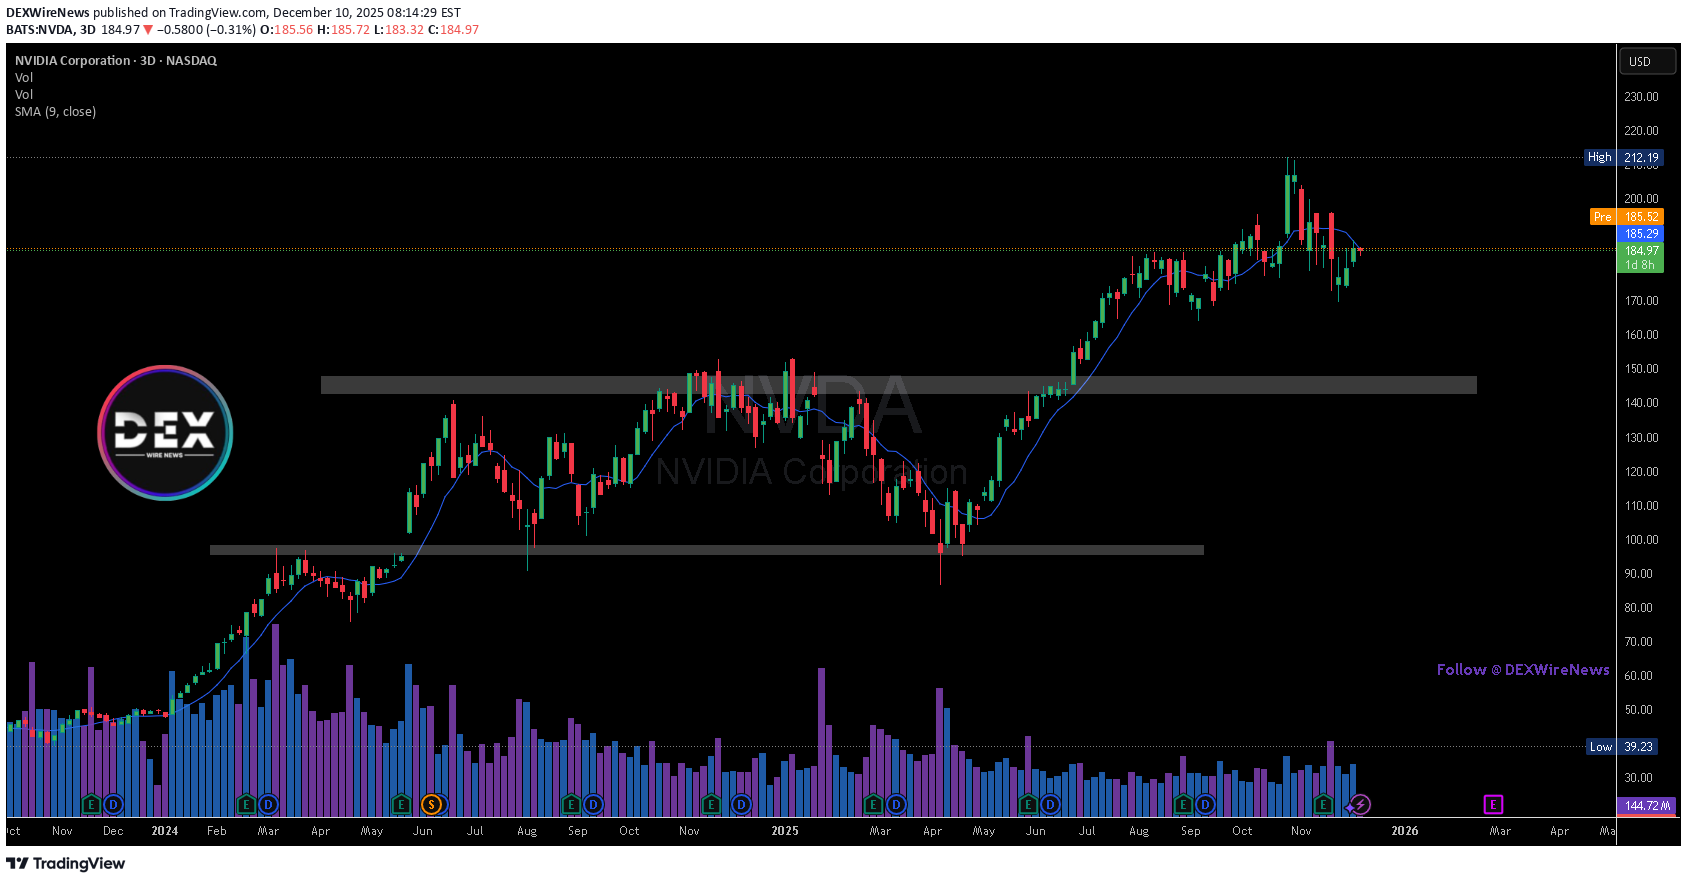
Nvidia (NASDAQ: $NVDA) Eyes H200 Output Boost on China Demand
Nvidia (NASDAQ: NVDA) is weighing a major expansion of its H200 AI chip production after demand from Chinese companies exceeded current supply, according to Reuters sources. The surge in interest follows the U.S. government’s recent decision to allow Nvidia to export H200 processors to China under a 25% tariff, reigniting competition for access to high-performance computing hardware. Chinese tech giants—including Alibaba and ByteDance—reportedly contacted Nvidia almost immediately after the announcement, eager to secure bulk orders of the H200. However, the situation remains fluid. The Chinese government has not yet approved inbound H200 shipments and held emergency meetings this week to determine whether to allow the chip into the country. Limited supply is another complication. Nvidia is prioritizing production of its next-generation Blackwell and upcoming Rubin architectures, leaving only small quantities of H200 units available. This scarcity has intensified demand because the H200 is currently the most powerful AI chip legally accessible to Chinese companies—nearly six times stronger than the downgraded H20 version released in 2023. Industry analysts warn that allowing the H200 into China could slow the growth of China’s domestic AI chip ecosystem. Chinese regulators are considering conditions such as requiring each H200 purchase to be bundled with locally produced chips to support homegrown semiconductor development. Technical Analysis The NVDA chart currently shows price consolidating below the recent high near $212. After a strong multi-month rally, the stock has pulled back into a key short-term support zone around $175–$185. Holding this range could position NVDA for a retest of its highs, supported by strong demand catalysts and ongoing AI infrastructure investment. If price breaks below $175, a deeper correction toward the $150 demand zone becomes likely. Volume is stabilizing, and RSI sits mid-range, indicating a neutral momentum backdrop awaiting a directional catalyst. Traders should watch for reclaiming the $190–$195 area to confirm bullish continuation.
DEXWireNews
DeepSeek Smuggles Nvidia (NASDAQ: $NVDA) Chips for AI Model
Chinese AI startup DeepSeek is reportedly building its next major artificial intelligence model using thousands of Nvidia (NASDAQ: NVDA) Blackwell-generation GPUs that were smuggled into China, according to a detailed investigation by The Information. These chips, among Nvidia’s most advanced AI accelerators, are restricted under U.S. export controls, making them unavailable to Chinese buyers through legal channels. The report highlights a sophisticated smuggling operation in which servers equipped with Blackwell chips were initially shipped to data centers in countries not affected by U.S. restrictions. The servers were then dismantled, and their components imported into China in pieces, bypassing regulatory scrutiny. Most Nvidia chips are produced in Taiwan and distributed globally through a network of intermediaries, creating gaps that can be exploited. For DeepSeek, access to the Blackwell architecture provides a significant performance advantage. It enables faster training times, larger models, and superior inference efficiency—critical factors in the global AI race. Despite Beijing’s aggressive support for domestic semiconductor advancement, Chinese-made AI chips still trail Nvidia’s top-tier performance, according to executives from Chinese AI companies. Nvidia, responding to the allegations, stated that it has not seen evidence of “phantom data centers” being constructed and dismantled to disguise smuggling routes, though the company emphasized that it investigates any credible tip it receives. Technical Analysis NVDA’s price action remains in a broad structural uptrend, despite recent volatility. The stock is currently trading near $185, just below its shorter-term moving average. A critical resistance zone lies around $212, marked by the previous swing high. A breakout above this level could resume the macro uptrend, potentially targeting new all-time highs. If price fails to reclaim momentum, downside support sits around $170, where significant demand previously pushed price higher. A deeper correction could revisit the $145 liquidity zone, aligning with historical consolidation. Overall, NVDA remains technically strong, but sensitive to geopolitical and regulatory headlines.
Disclaimer
Any content and materials included in Sahmeto's website and official communication channels are a compilation of personal opinions and analyses and are not binding. They do not constitute any recommendation for buying, selling, entering or exiting the stock market and cryptocurrency market. Also, all news and analyses included in the website and channels are merely republished information from official and unofficial domestic and foreign sources, and it is obvious that users of the said content are responsible for following up and ensuring the authenticity and accuracy of the materials. Therefore, while disclaiming responsibility, it is declared that the responsibility for any decision-making, action, and potential profit and loss in the capital market and cryptocurrency market lies with the trader.