
AERGO
Aergo
| تریدر | نوع سیگنال | حد سود/ضرر | زمان انتشار | مشاهده پیام |
|---|---|---|---|---|
No results found. | ||||
Price Chart of Aergo
سود 3 Months :
سیگنالهای Aergo
Filter
Sort messages by
Trader Type
Time Frame

AERGO - Descending Trendline Break from Major Demand Zone – Bull
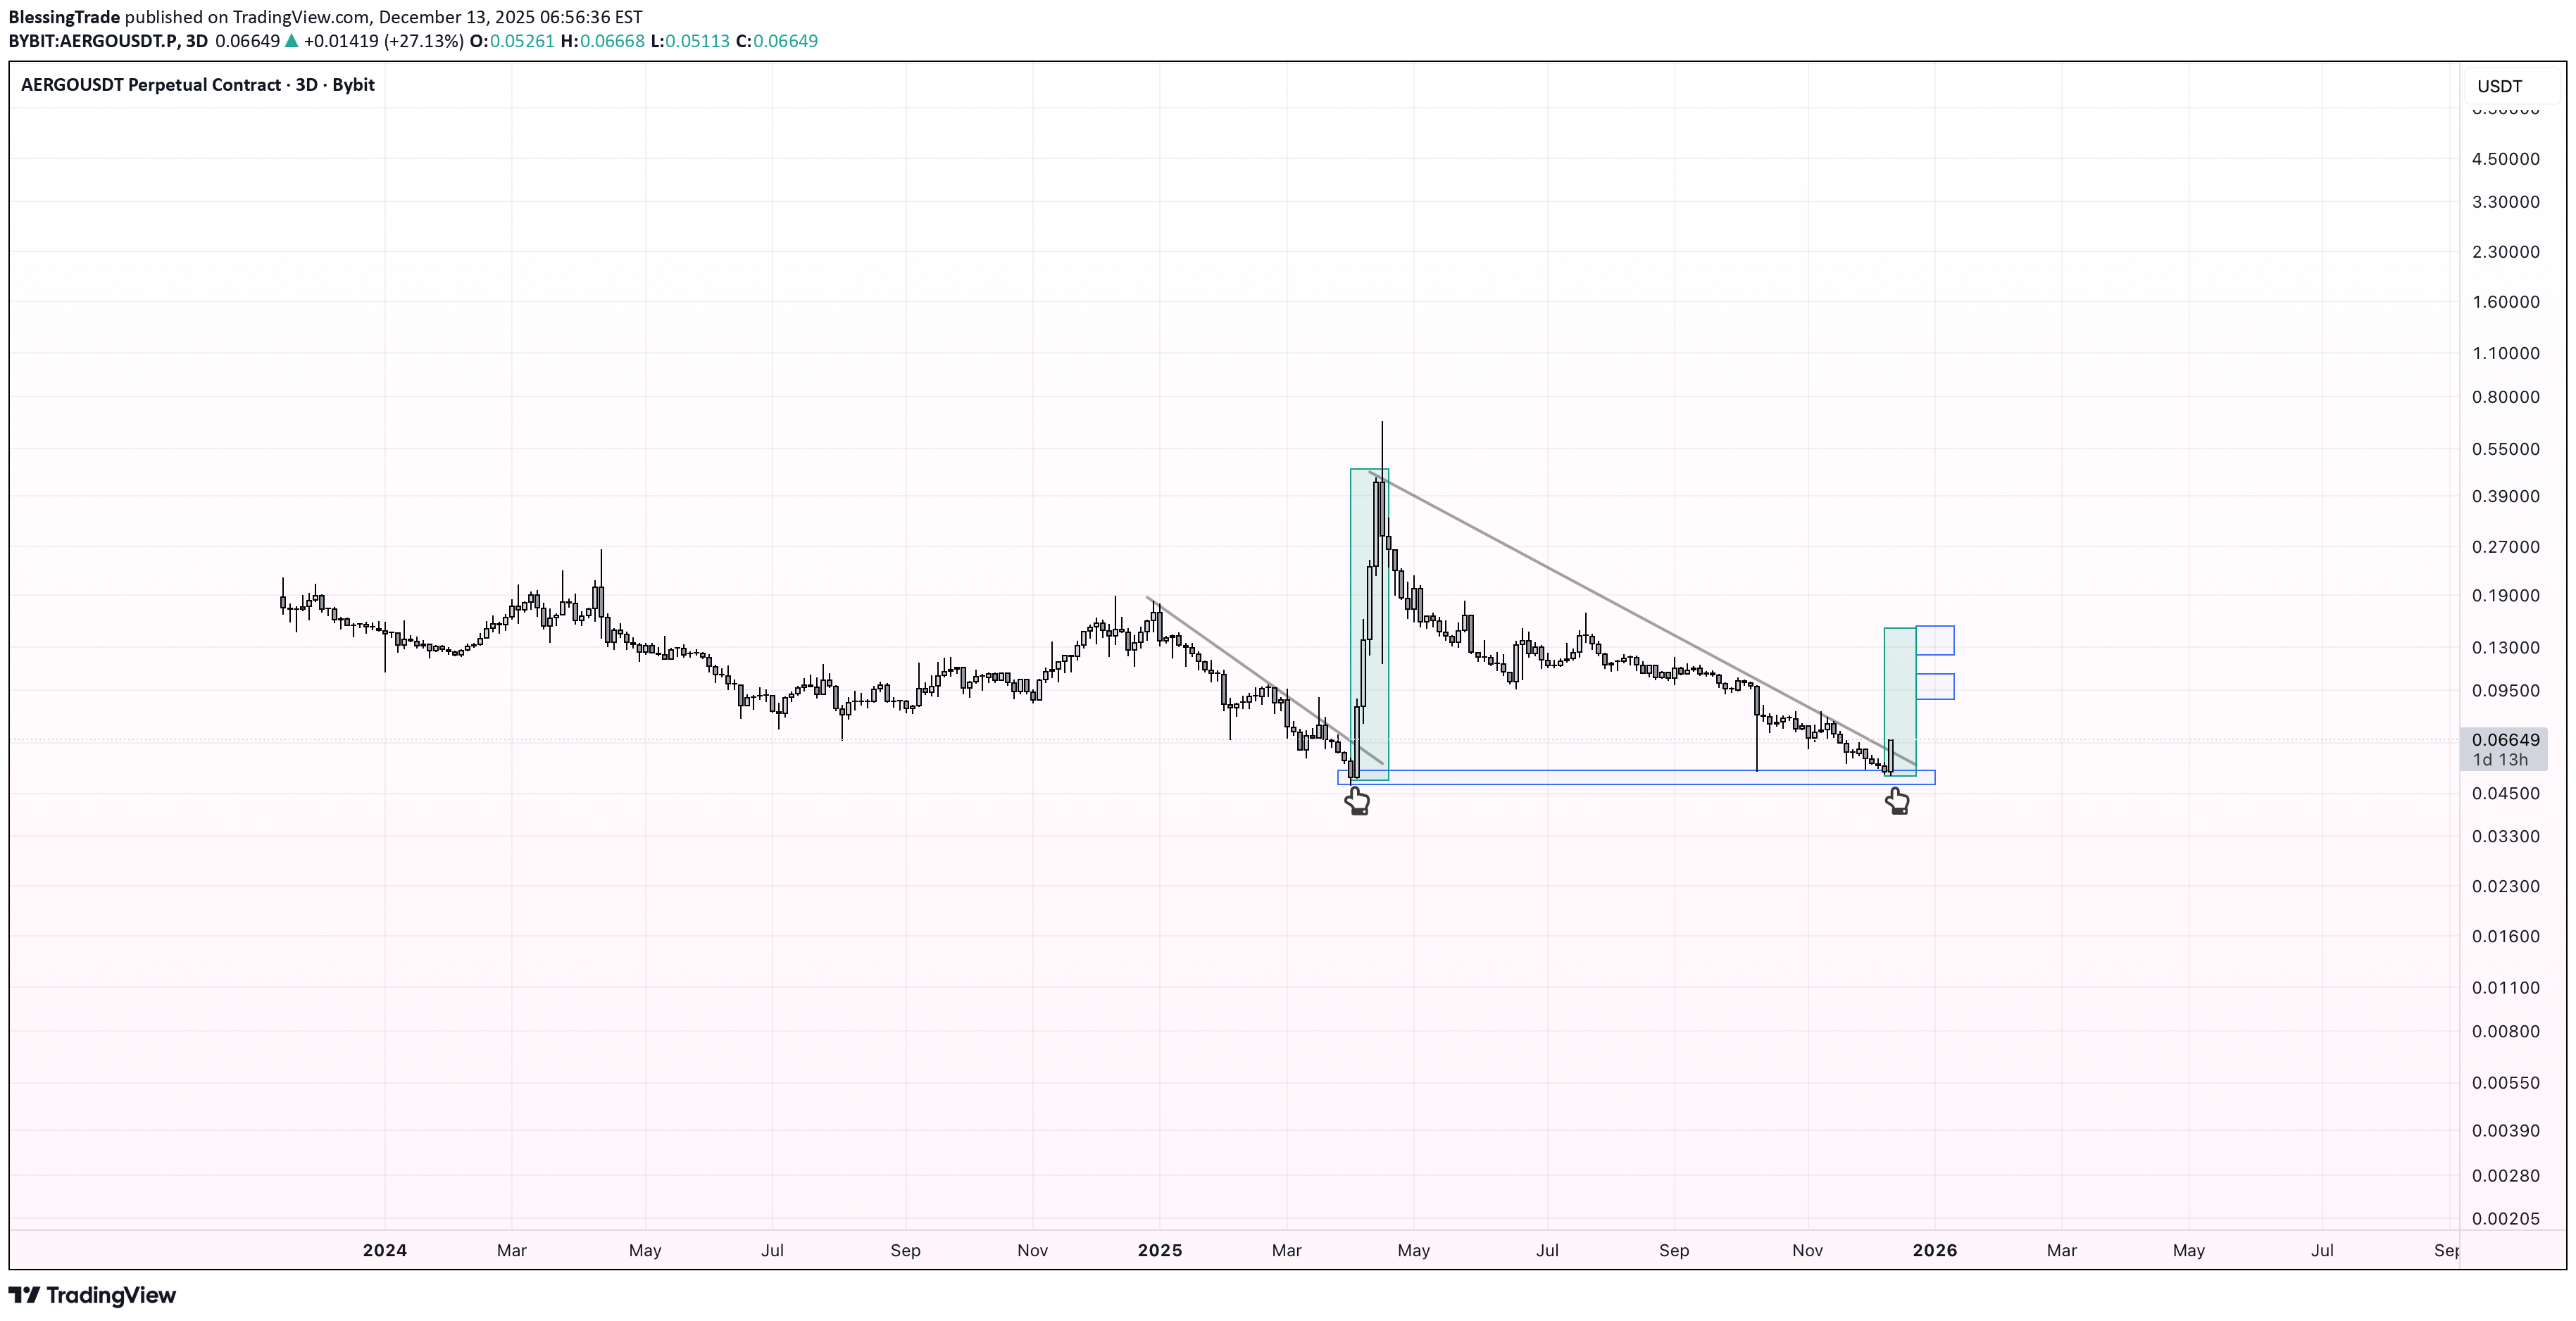
Price has returned to a key demand zone that previously acted as a strong accumulation area. The last time AERGO reached this zone, we saw a sharp reaction: price formed a strong impulse, broke above the descending trendline, and was followed by a powerful pump. Currently, the market is showing a very similar structure. Price has once again tested this horizontal support area, sellers are losing momentum, and bullish impulse is starting to form. We are now seeing a potential breakout of the descending trendline, which has been capping price for months. This setup suggests a possible trend reversal from bearish to bullish: Strong historical demand zone holding Repeated reaction from the same support level Descending trendline break (or imminent breakout) Increasing impulsive price behavior after compression If the breakout confirms, I expect continuation to the upside with targets around $0.09 as the first resistance and $0.12 as the next major target zone.

rainbow_sniper
تحلیل سریع و شانس سود کوتاه در ایرگ (AERGO): استراتژی معاملاتی کوتاهمدت
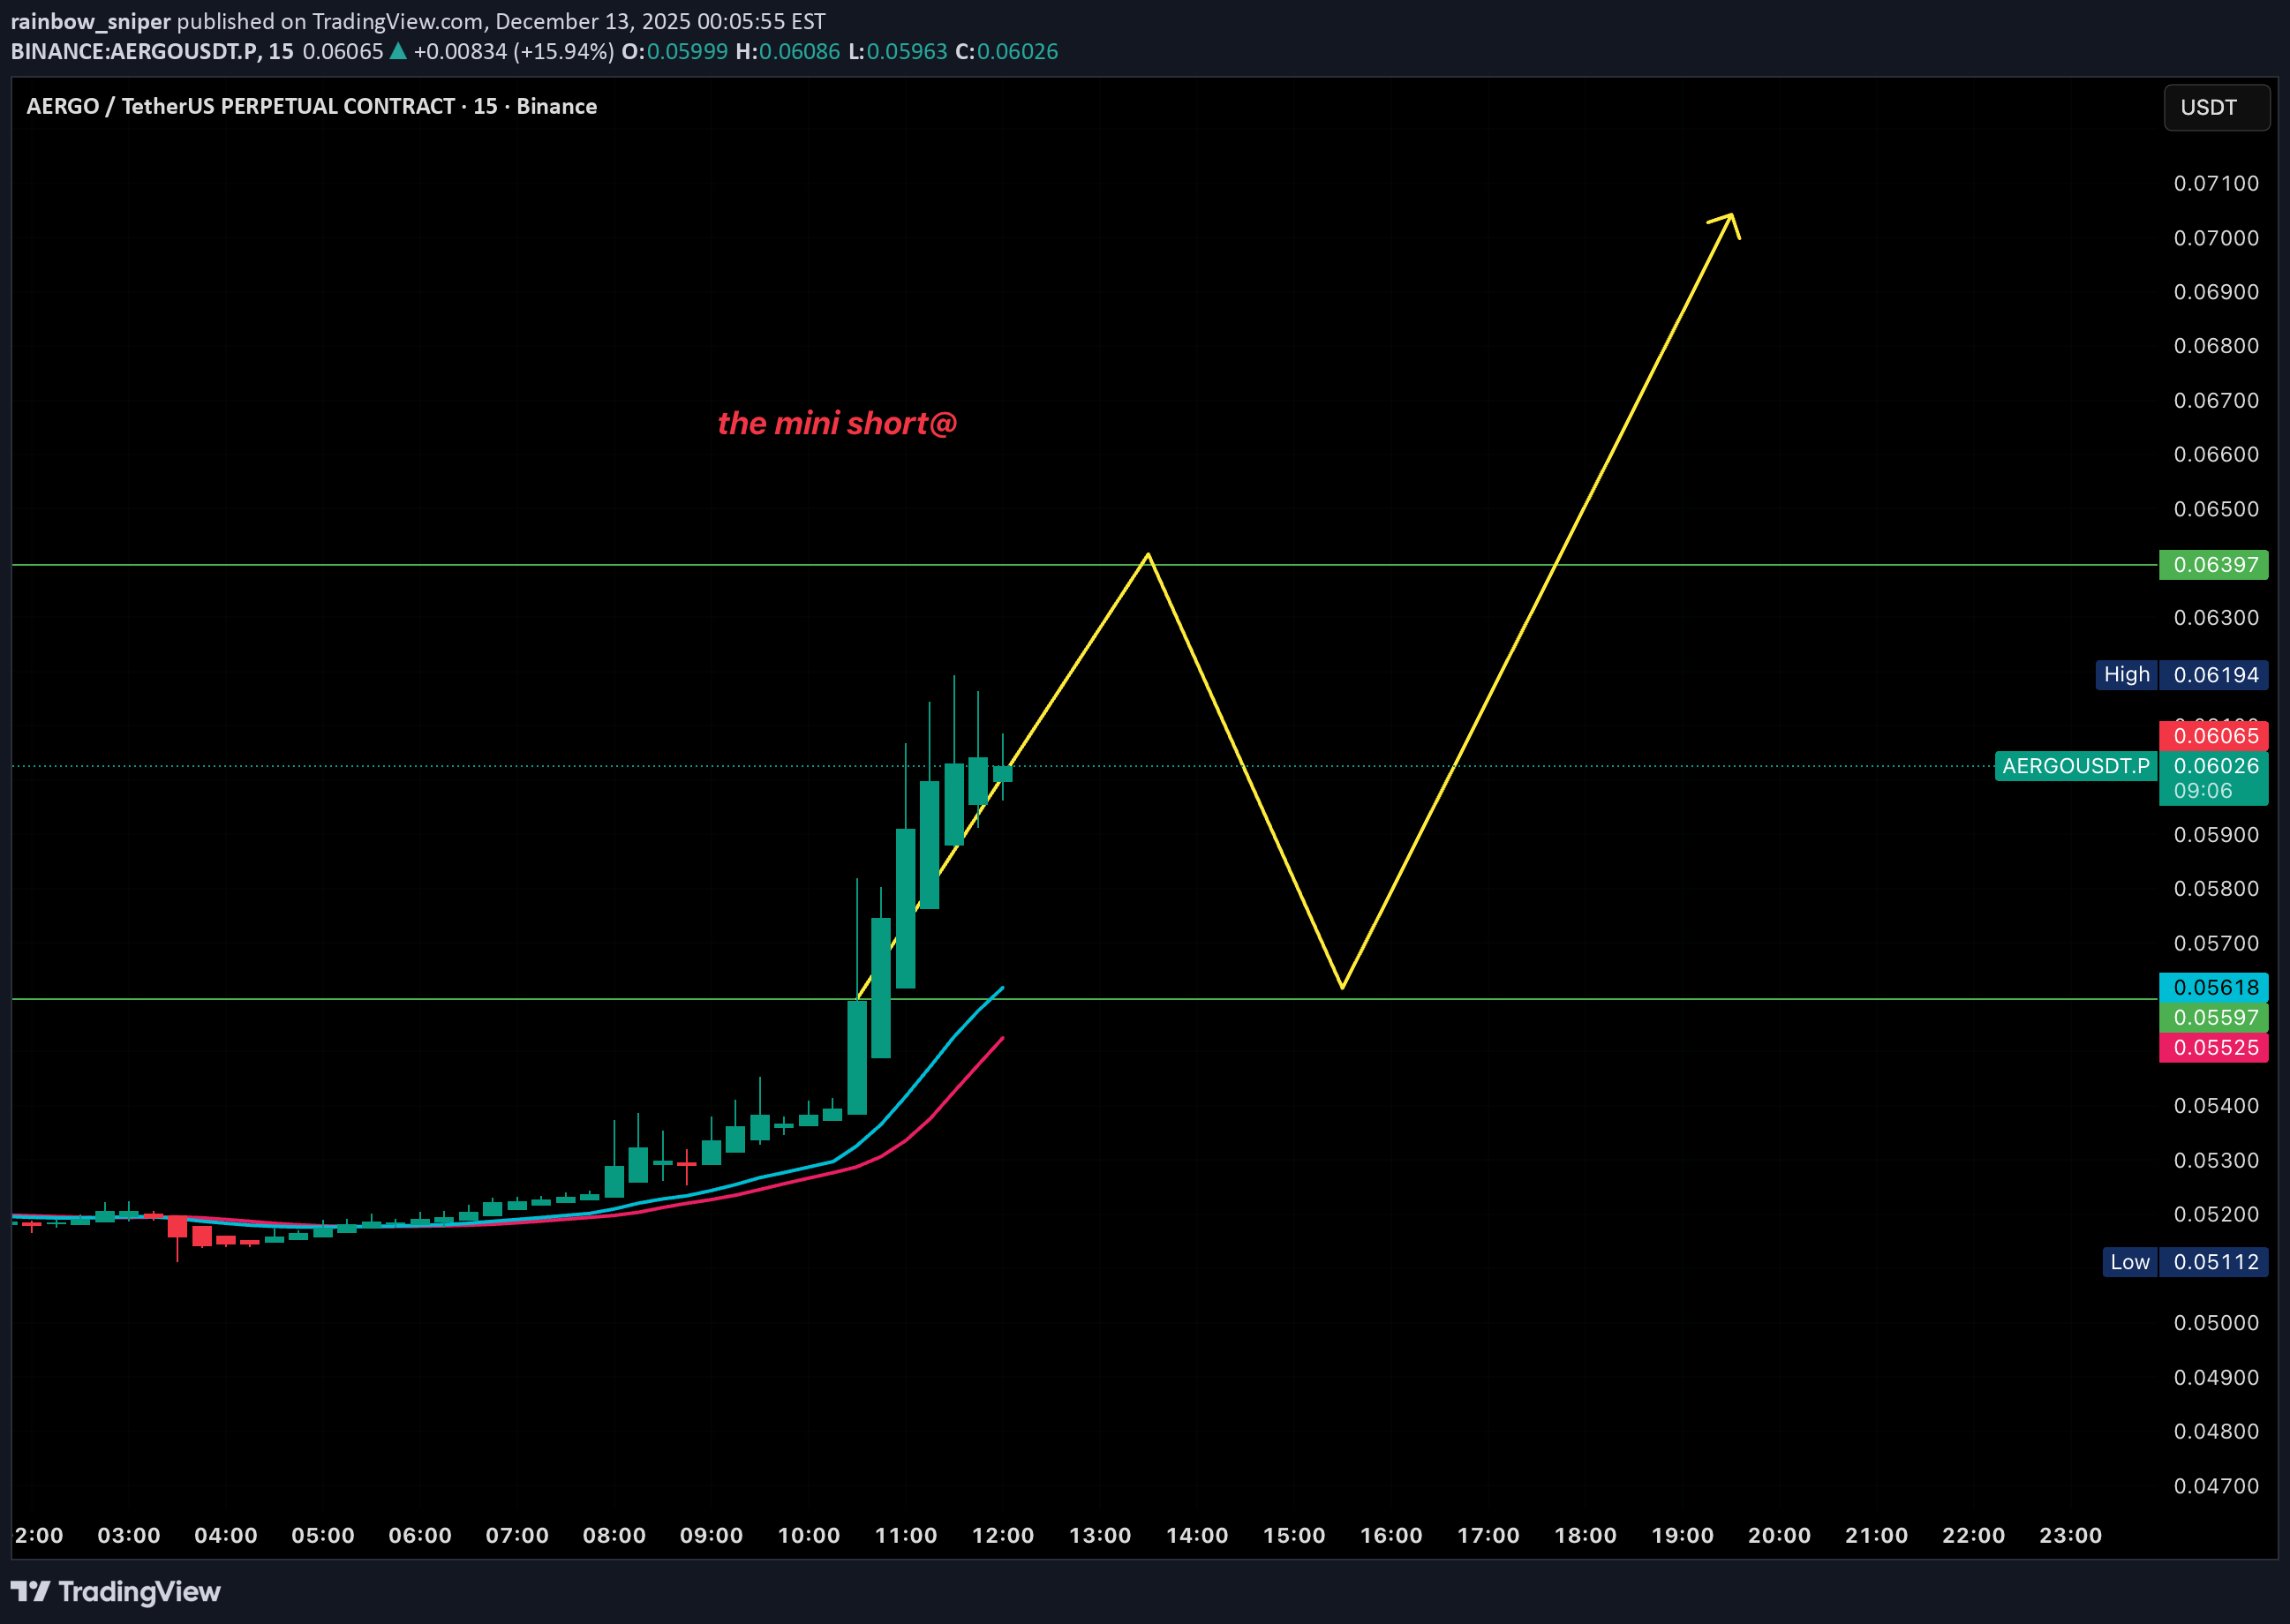
Market Context This idea is based on short term structure and local confluence. It represents a probability based scenario, not a prediction. Price is reacting near a short term resistance zone. Strategy Strategy name: The Mini Short This setup targets short moves within a smaller range. Designed for quick reaction, not long holding. Risk control is required. Entry Zone Planned entry area: 0.063 to 0.064 Position should be managed carefully due to tight range. Target Zone Potential downside area: 0.055 Trade management depends on price reaction and structure. Risk Note Always define invalidation before entry. If price breaks above the structure, the idea is invalid. Capital protection comes first.

RoyalExcellence
AERGOUSDT Trading Idea.

Likely a reversal to the upside from $0.09030 provided the weekly order block is not mitigated. The preferred position should be a long position.

Captain-MAO
AERGO/USDT +110%
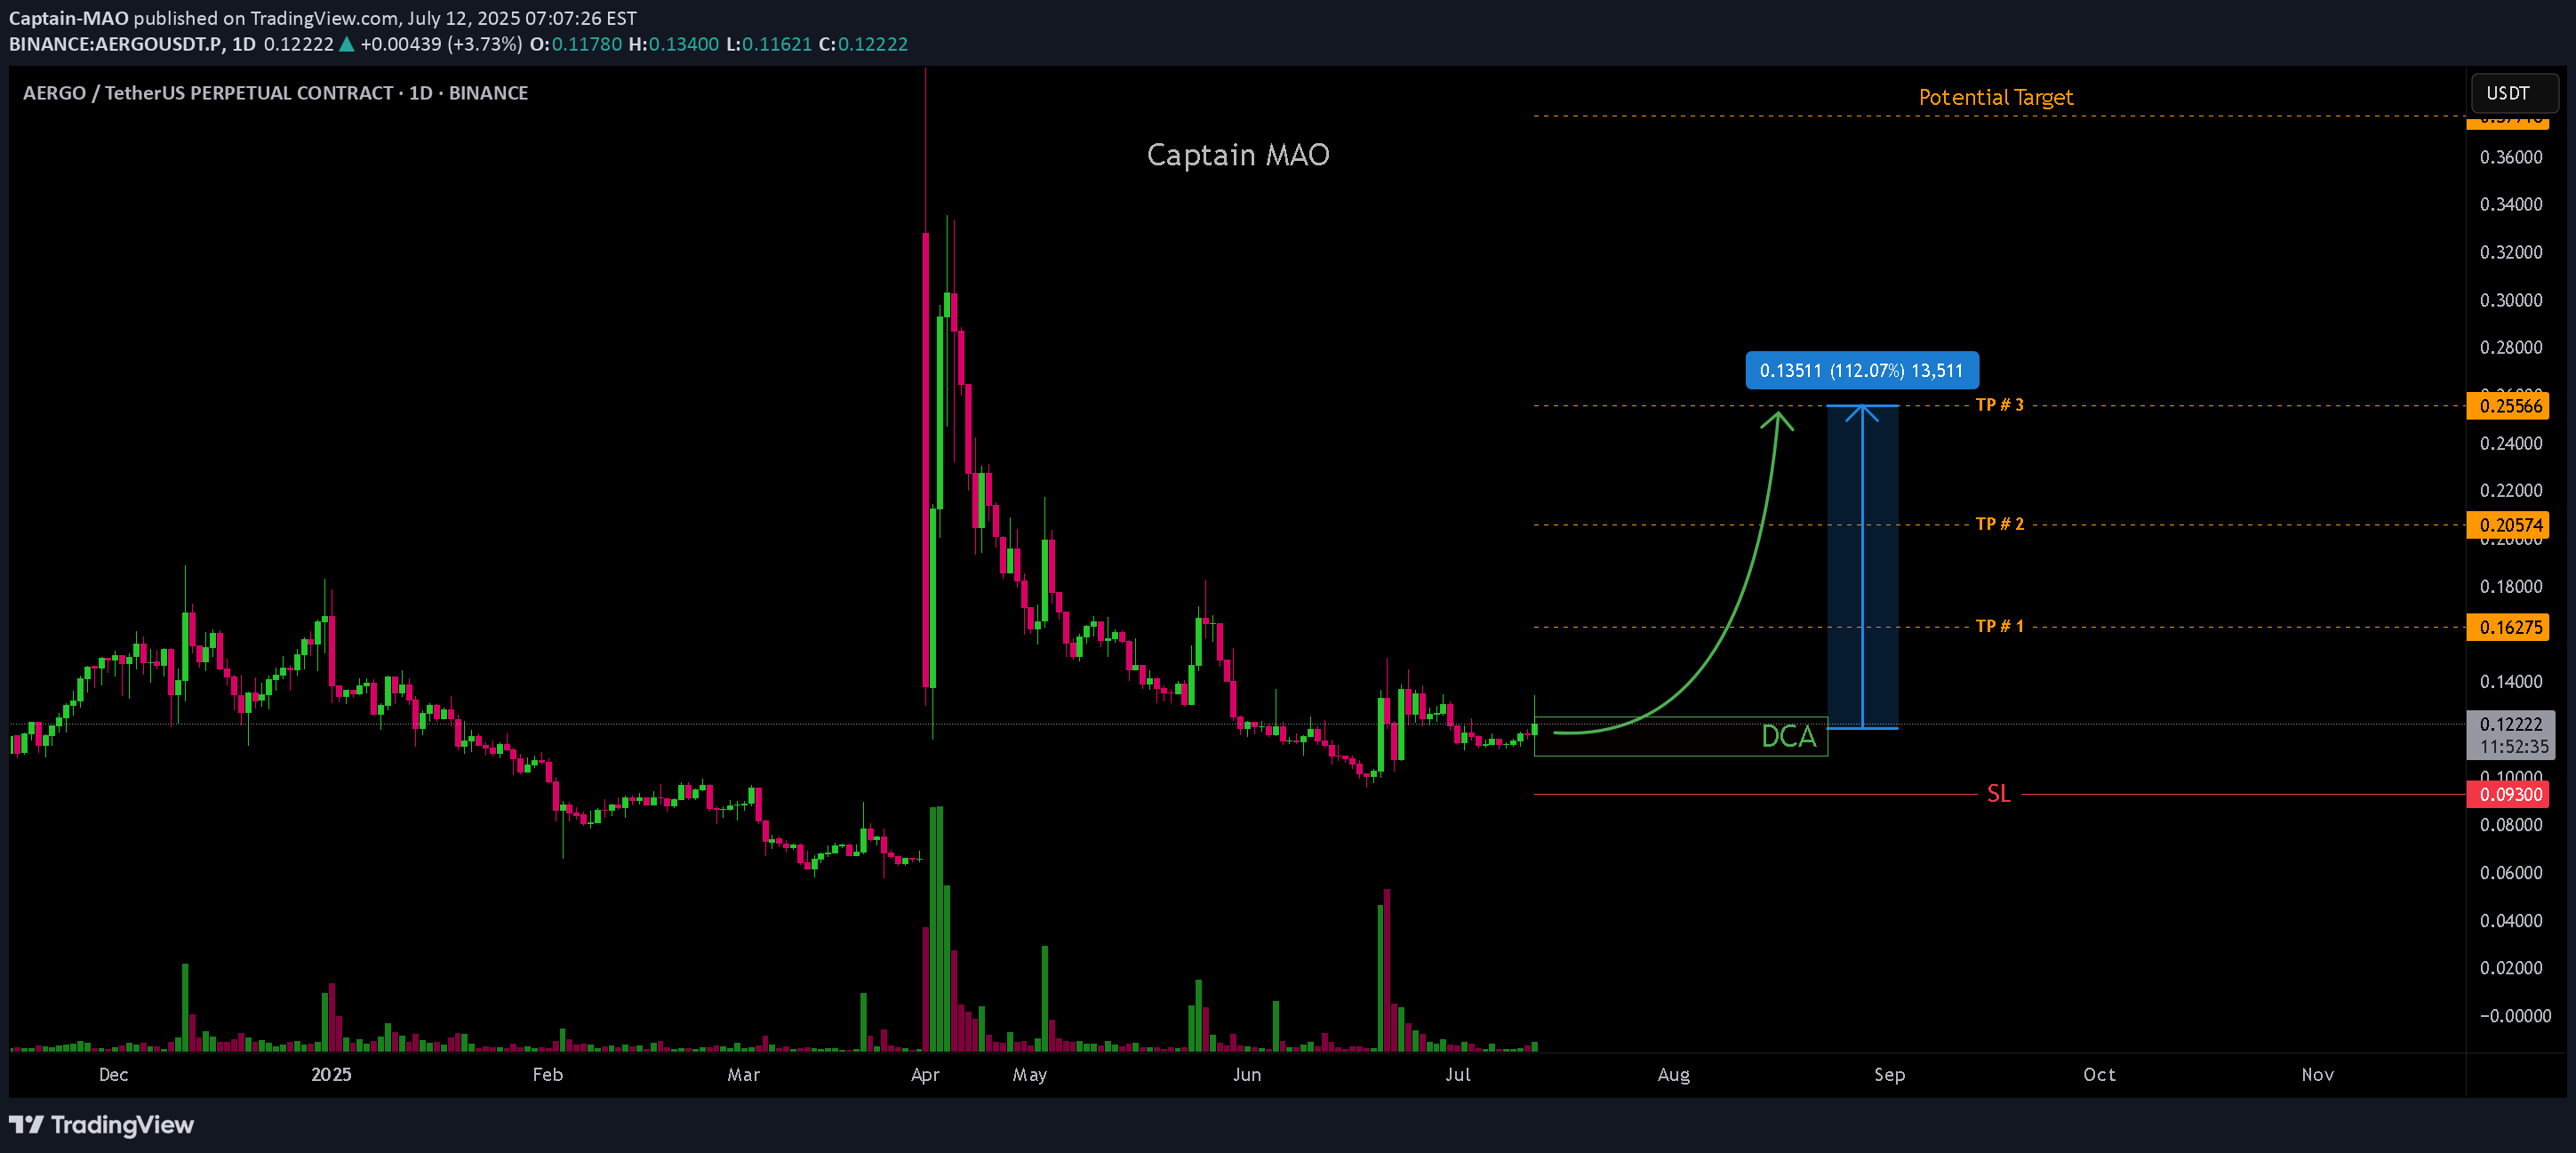
AERGO is setting up for a potential breakout after establishing a solid accumulation range. The price action has been consolidating within a tight structure, indicating the sellers are getting exhausted while buyers are silently stepping in. Entry Zone Green Box

Ren_MomentumTrader
AERGO/USDT

Key Level Zone: 0.11800 - 0.11880LMT v1.0 detected.The setup looks promising—price previously trended upward with rising volume and momentum, then retested this zone cleanly. This presents an excellent reward-to-risk opportunity if momentum continues to align.Introducing LMT (Levels & Momentum Trading)- Over the past 3 years, I’ve refined my approach to focus more sharply on the single most important element in any trade: the KEY LEVEL.- While HMT (High Momentum Trading) served me well—combining trend, momentum, volume, and structure across multiple timeframes—I realized that consistently identifying and respecting these critical price zones is what truly separates good trades from great ones.- That insight led to the evolution of HMT into LMT – Levels & Momentum Trading.Why the Change? (From HMT to LMT)Switching from High Momentum Trading (HMT) to Levels & Momentum Trading (LMT) improves precision, risk control, and confidence by:- Clearer Entries & Stops: Defined key levels make it easier to plan entries, stop-losses, and position sizing—no more guesswork.- Better Signal Quality: Momentum is now always checked against a support or resistance zone—if it aligns, it's a stronger setup.- Improved Reward-to-Risk: All trades are anchored to key levels, making it easier to calculate and manage risk effectively.- Stronger Confidence: With clear invalidation points beyond key levels, it's easier to trust the plan and stay disciplined—even in tough markets.Whenever I share a signal, it’s because:- A high‐probability key level has been identified on a higher timeframe.- Lower‐timeframe momentum, market structure and volume suggest continuation or reversal is imminent.- The reward‐to‐risk (based on that key level) meets my criteria for a disciplined entry.***Please note that conducting a comprehensive analysis on a single timeframe chart can be quite challenging and sometimes confusing. I appreciate your understanding of the effort involved.Important Note: The Role of Key Levels- Holding a key level zone: If price respects the key level zone, momentum often carries the trend in the expected direction. That’s when we look to enter, with stop-loss placed just beyond the zone with some buffer.- Breaking a key level zone: A definitive break signals a potential stop‐out for trend traders. For reversal traders, it’s a cue to consider switching direction—price often retests broken zones as new support or resistance.My Trading Rules (Unchanged)Risk Management- Maximum risk per trade: 2.5%- Leverage: 5xExit Strategy / Profit Taking- Sell at least 70% on the 3rd wave up (LTF Wave 5).- Typically sell 50% during a high‐volume spike.- Move stop‐loss to breakeven once the trade achieves a 1.5:1 R:R.- Exit at breakeven if momentum fades or divergence appears.The market is highly dynamic and constantly changing. LMT signals and target profit (TP) levels are based on the current price and movement, but market conditions can shift instantly, so it is crucial to remain adaptable and follow the market's movement.If you find this signal/analysis meaningful, kindly like and share it.Thank you for your support~Sharing this with love!From HMT to LMT: A Brief Version HistoryHM Signal :Date: 17/08/2023- Early concept identifying high momentum pullbacks within strong uptrends- Triggered after a prior wave up with rising volume and momentum- Focused on healthy retracements into support for optimal reward-to-risk setupsHMT v1.0:Date: 18/10/2024- Initial release of the High Momentum Trading framework- Combined multi-timeframe trend, volume, and momentum analysis.- Focused on identifying strong trending moves high momentumHMT v2.0:Date: 17/12/2024- Major update to the Momentum indicator- Reduced false signals from inaccurate momentum detection- New screener with improved accuracy and fewer signalsHMT v3.0:Date: 23/12/2024- Added liquidity factor to enhance trend continuation- Improved potential for momentum-based plays- Increased winning probability by reducing entries during peaksHMT v3.1:Date: 31/12/2024- Enhanced entry confirmation for improved reward-to-risk ratiosHMT v4.0:Date: 05/01/2025- Incorporated buying and selling pressure in lower timeframes to enhance the probability of trending moves while optimizing entry timing and scalingHMT v4.1:Date: 06/01/2025- Enhanced take-profit (TP) target by incorporating market structure analysisHMT v5 :Date: 23/01/2025- Refined wave analysis for trending conditions- Incorporated lower timeframe (LTF) momentum to strengthen trend reliability- Re-aligned and re-balanced entry conditions for improved accuracyHMT v6 :Date : 15/02/2025- Integrated strong accumulation activity into in-depth wave analysisHMT v7 :Date : 20/03/2025- Refined wave analysis along with accumulation and market sentimentHMT v8 :Date : 16/04/2025- Fully restructured strategy logicHMT v8.1 :Date : 18/04/2025- Refined Take Profit (TP) logic to be more conservative for improved win consistencyLMT v1.0 :Date : 06/06/2025- Rebranded to emphasize key levels + momentum as the core framework
Captain-MAO
AERGO/USDT for weekend

AERGO/USDT for a short-term weekend trade with a high-risk/high-reward profile. The chart is showing potential for a breakout move, supported by recent volume upticks and technical structure forming a bullish continuation pattern.upside: 30–40% from current levels if momentum sustains.Buy Entry : green DCA box 🎯 Targets:TP#1: $0.18TP#2: $0.21TP#3: $0.23SL: $0.15 This is a high-risk weekend trade idea

amstrade09
Bullish flag, will it continue to go up?

will it return to the high or make a new high? There are two patterns visible on this trendline, such as bullish flag, bullish falling wedge, will it continue to occur to reach a new ATH?

UmutTrades
AERGO/USDT – Blue Box Support… But Beware

AERGO’s been carving out a zone that looks like a textbook demand area—our blue box. It’s tempting to jump in as soon as price drifts down there, but there’s a real chance it doesn’t hold. That’s why moving without proof is a fast track to getting stopped out.Here’s what needs to happen before you pull the trigger:Volume + CDV confirmation: Price dips into the blue box, then you see a clear surge in traded volume that lines up with a bullish CDV divergence—smart money quietly stepping in.Low-timeframe break & reclaim: On your one- or five-minute chart, watch for a quick break below the box followed by an aggressive reclaim. That flip in order flow is your green light.Order flow shift: Watch for bids eating through offers, not just a wick. That tells you buyers are serious.“I will not insist on my short idea. If the levels suddenly break upwards and do not give a downward break in the low time frame, I will not evaluate it. If they break upwards with volume and give a retest, I will look long.”I’ve seen setups like this crumble when traders act on hope instead of signals. If you buy early and it snaps through, chasing feels a lot worse than waiting. But if you wait for the trifecta—volume, CDV, and that clean break-retest—you’ll be in position when AERGO decides to rip.🧠 Miss the confirmation and you might regret sitting on the sidelines… jump in too soon and you’ll regret taking the hit.Keep your eyes locked on that blue box. When those confirmation elements align, that’s your moment. Otherwise, patience wins again.📌I keep my charts clean and simple because I believe clarity leads to better decisions.📌My approach is built on years of experience and a solid track record. I don’t claim to know it all but I’m confident in my ability to spot high-probability setups.📌If you would like to learn how to use the heatmap, cumulative volume delta and volume footprint techniques that I use below to determine very accurate demand regions, you can send me a private message. I help anyone who wants it completely free of charge.🔑I have a long list of my proven technique below:🎯 ZENUSDT.P: Patience & Profitability | %230 Reaction from the Sniper Entry🐶 DOGEUSDT.P: Next Move🎨 RENDERUSDT.P: Opportunity of the Month💎 ETHUSDT.P: Where to Retrace🟢 BNBUSDT.P: Potential Surge📊 BTC Dominance: Reaction Zone🌊 WAVESUSDT.P: Demand Zone Potential🟣 UNIUSDT.P: Long-Term Trade🔵 XRPUSDT.P: Entry Zones🔗 LINKUSDT.P: Follow The River📈 BTCUSDT.P: Two Key Demand Zones🟩 POLUSDT: Bullish Momentum🌟 PENDLEUSDT.P: Where Opportunity Meets Precision🔥 BTCUSDT.P: Liquidation of Highly Leveraged Longs🌊 SOLUSDT.P: SOL's Dip - Your Opportunity🐸 1000PEPEUSDT.P: Prime Bounce Zone Unlocked🚀 ETHUSDT.P: Set to Explode - Don't Miss This Game Changer🤖 IQUSDT: Smart Plan⚡️ PONDUSDT: A Trade Not Taken Is Better Than a Losing One💼 STMXUSDT: 2 Buying Areas🐢 TURBOUSDT: Buy Zones and Buyer Presence🌍 ICPUSDT.P: Massive Upside Potential | Check the Trade Update For Seeing Results🟠 IDEXUSDT: Spot Buy Area | %26 Profit if You Trade with MSB 📌 USUALUSDT: Buyers Are Active + %70 Profit in Total🌟 FORTHUSDT: Sniper Entry +%26 Reaction🐳 QKCUSDT: Sniper Entry +%57 Reaction📊 BTC.D: Retest of Key Area Highly Likely📊 XNOUSDT %80 Reaction with a Simple Blue Box!📊 BELUSDT Amazing %120 Reaction!📊 Simple Red Box, Extraordinary ResultsI stopped adding to the list because it's kinda tiring to add 5-10 charts in every move but you can check my profile and see that it goes on..

alirazamonad
It looks bullish

What do you guys think of this what cand be the next movement for aergousdt

Zorroreny
AERGO - crazy spike, what next?

AERGO as expected bounced up to top of channel but failed to reach fibb 1.272 target range. We got very nasty rejection from top of channel and it's hard to say if we get one more push to try get fibb 1.272 target. My guess is as long as we stay above fibb 0.5 (0.17$) we have chance for one more push higher - especially as we are still not overbought or have any signs of bearish divergence (even on lower timeframes). If we get one more push higher make sure to secure profits on time as it will be over faster than you can think - you can see how it moves 1 crazy candle up next candle 100% retrace....
Disclaimer
Any content and materials included in Sahmeto's website and official communication channels are a compilation of personal opinions and analyses and are not binding. They do not constitute any recommendation for buying, selling, entering or exiting the stock market and cryptocurrency market. Also, all news and analyses included in the website and channels are merely republished information from official and unofficial domestic and foreign sources, and it is obvious that users of the said content are responsible for following up and ensuring the authenticity and accuracy of the materials. Therefore, while disclaiming responsibility, it is declared that the responsibility for any decision-making, action, and potential profit and loss in the capital market and cryptocurrency market lies with the trader.