
rainbow_sniper
@t_rainbow_sniper

What symbols does the trader recommend buying?
Purchase History
پیام های تریدر
Filter
rainbow_sniper
The Big Long — BTCUSDT
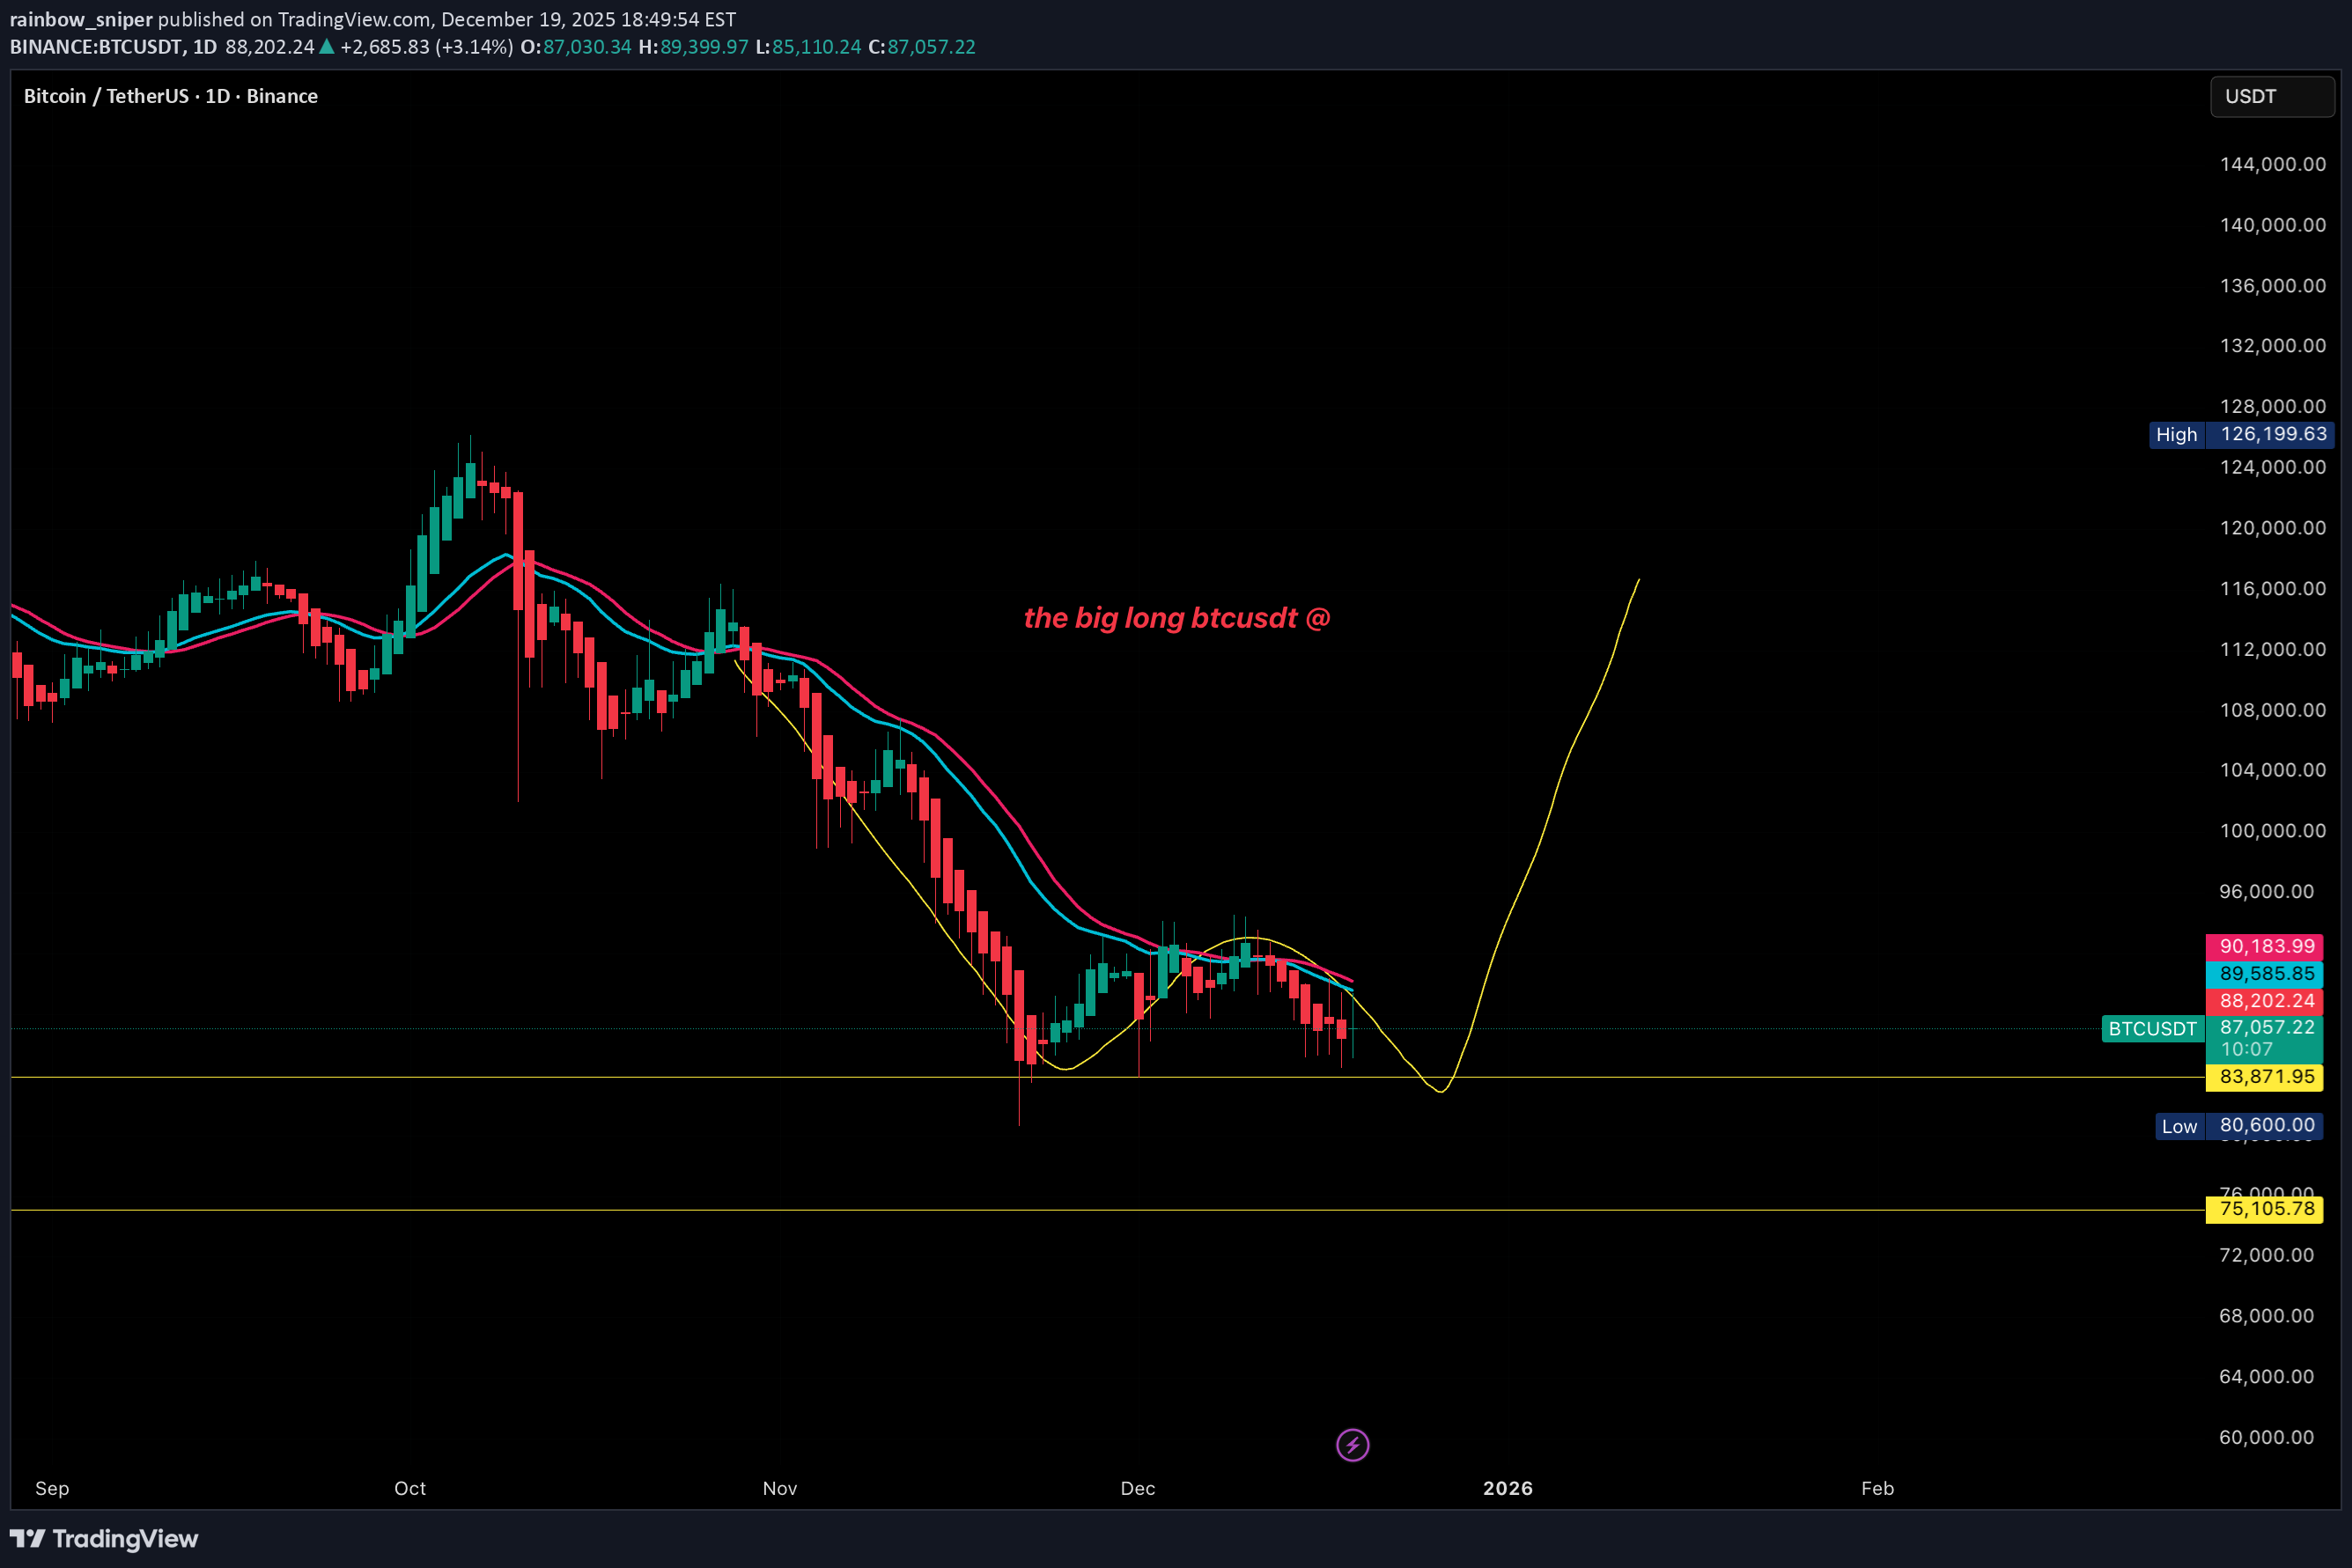
📈 The Big Long — BTCUSDT Bias: Long Timeframe Resonance: D1 & W 🧠 Market View: BTC is preparing for a major bullish wave driven by daily and weekly frequency resonance. This is a higher-timeframe setup, favoring patience and capital allocation rather than chasing price. 🔹 Entry Zones (scale in): 75,000 83,000 85,000 🔹 Close / Take Profit Zone: 110,000 – 118,000 📌 Execution Plan: Allocate capital across the listed entry zones Let higher-timeframe momentum do the work Avoid overtrading lower timeframes during the move 🧠 Mindset: When D1 and W resonate, volatility expands in your favor. Prepare early — the market rewards positioning, not emotion. This content is for market perspective sharing only and does not constitute financial advice.
rainbow_sniper
تحلیل سریع و شانس سود کوتاه در ایرگ (AERGO): استراتژی معاملاتی کوتاهمدت
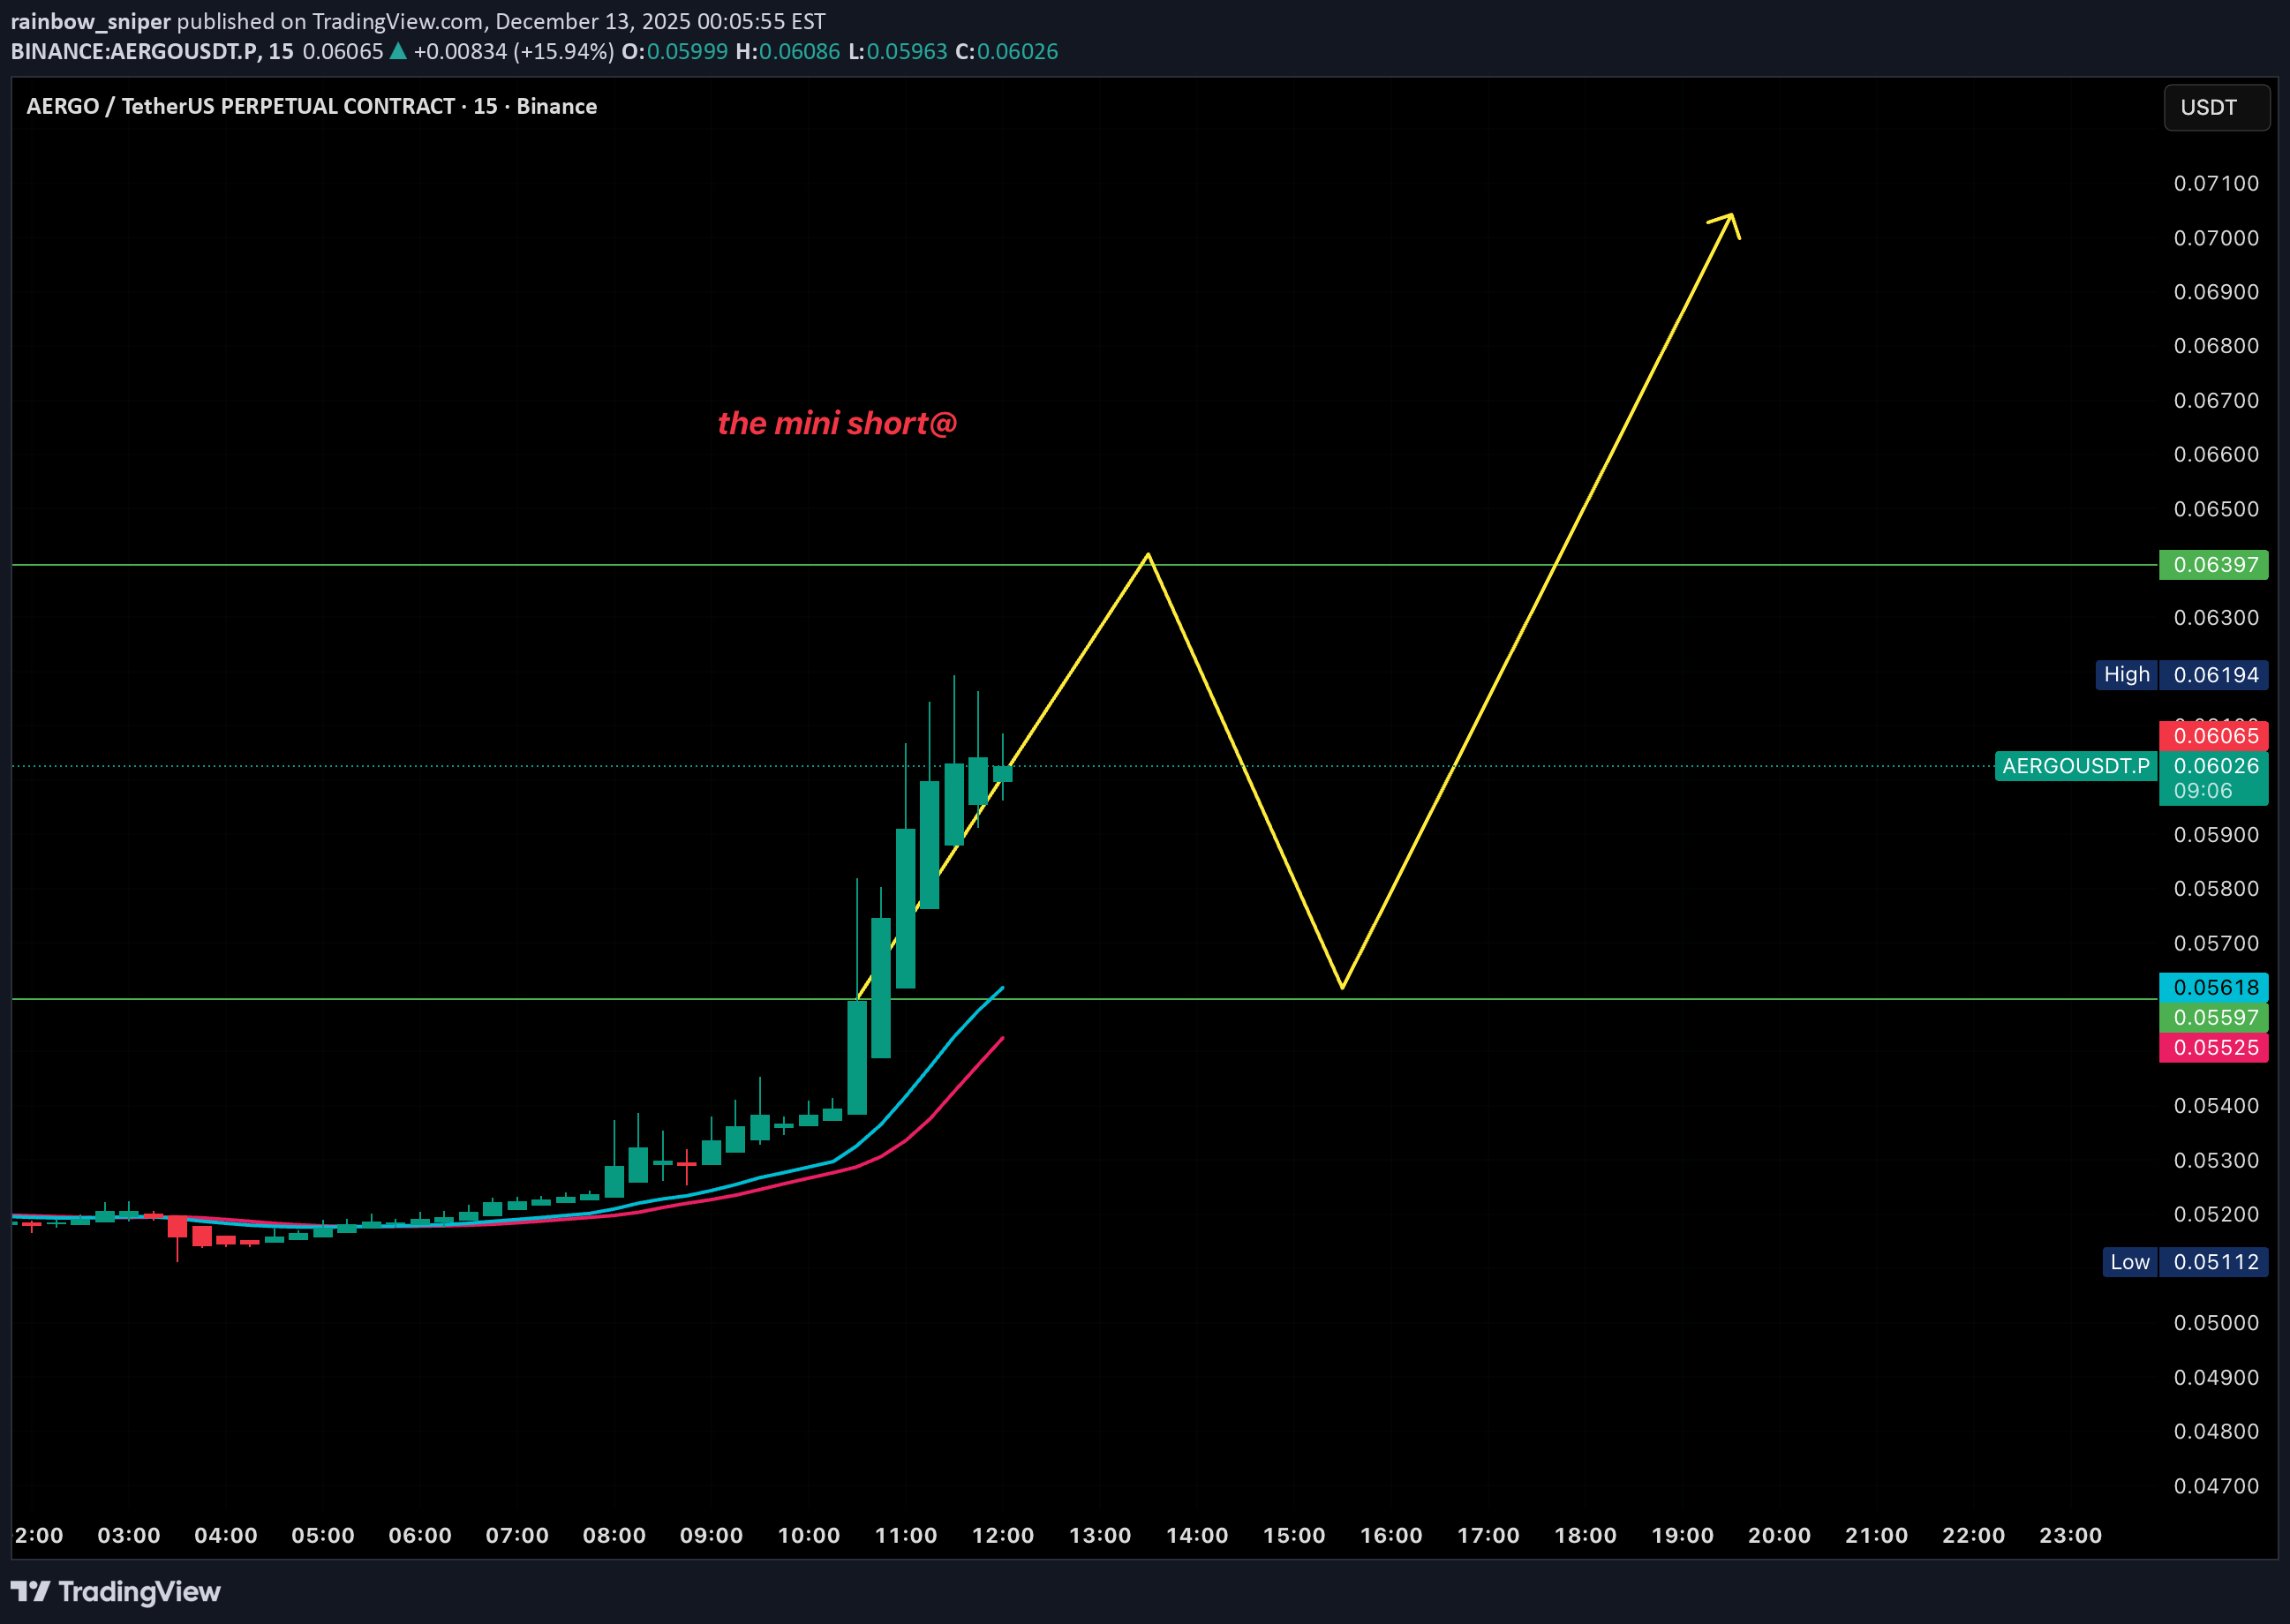
Market Context This idea is based on short term structure and local confluence. It represents a probability based scenario, not a prediction. Price is reacting near a short term resistance zone. Strategy Strategy name: The Mini Short This setup targets short moves within a smaller range. Designed for quick reaction, not long holding. Risk control is required. Entry Zone Planned entry area: 0.063 to 0.064 Position should be managed carefully due to tight range. Target Zone Potential downside area: 0.055 Trade management depends on price reaction and structure. Risk Note Always define invalidation before entry. If price breaks above the structure, the idea is invalid. Capital protection comes first.
rainbow_sniper
The Big Short AXLUSDT
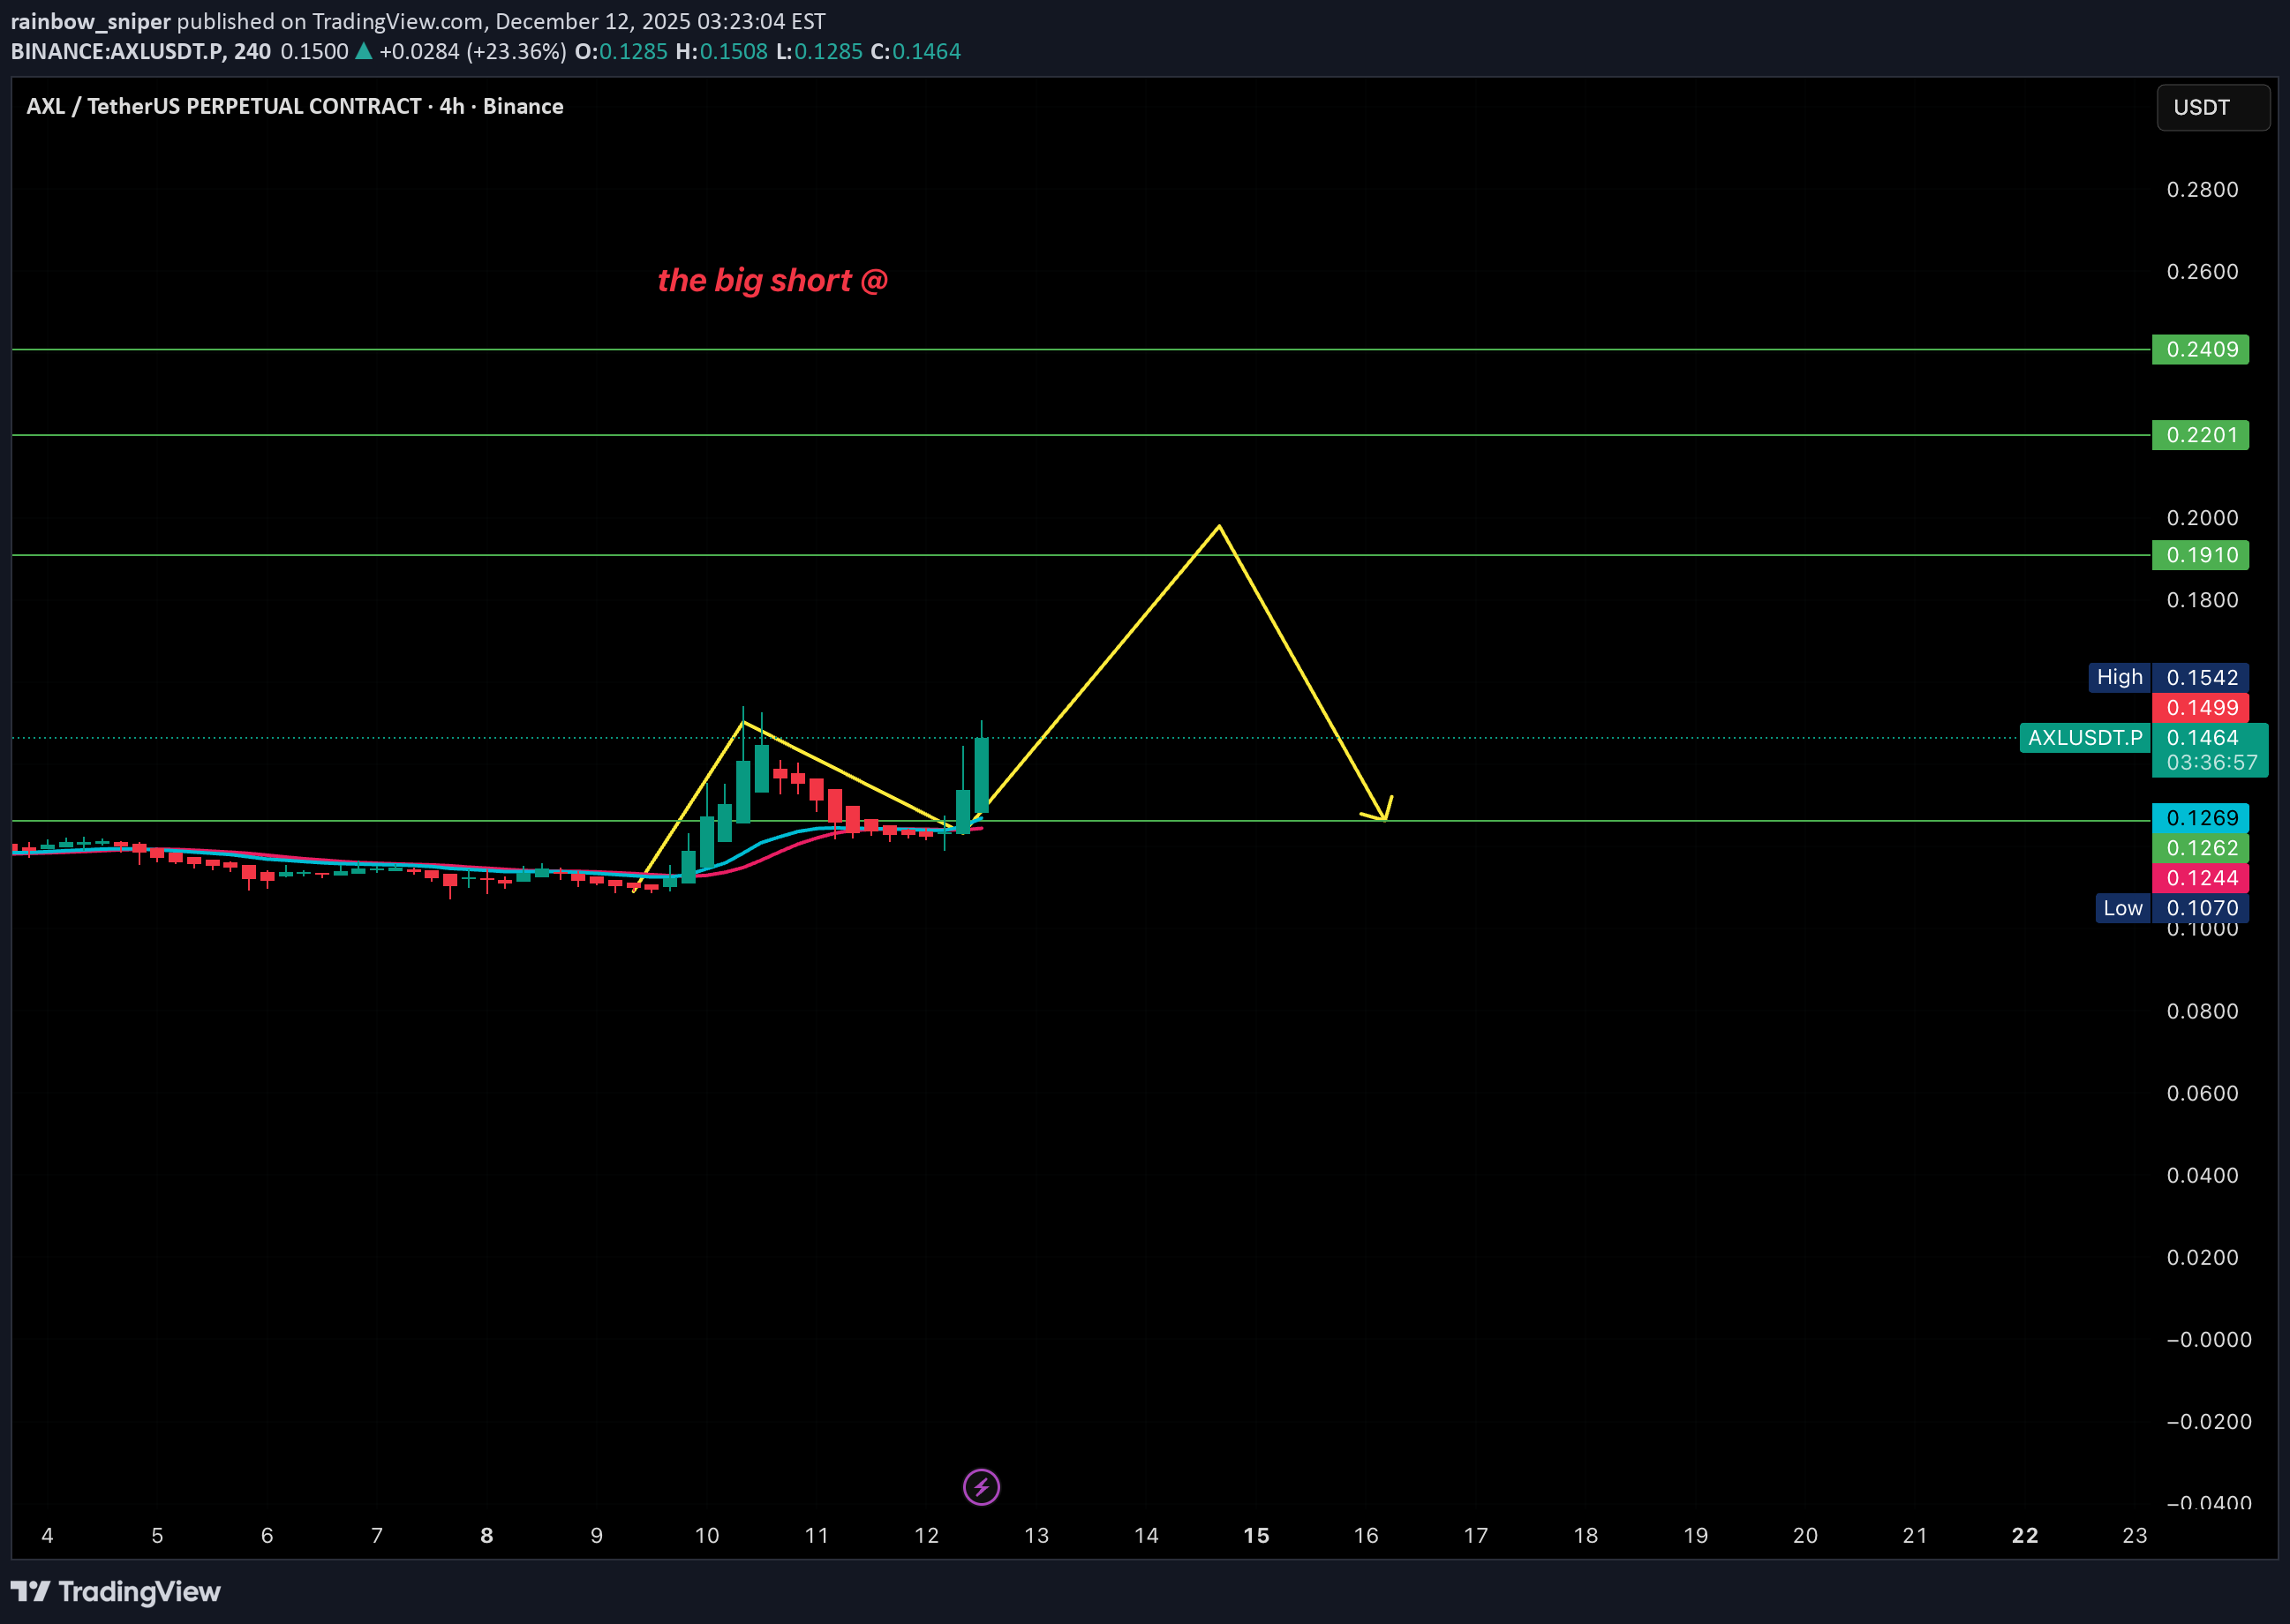
Market Context This idea is based on higher timeframe structure and short confluence. It represents a probability based scenario, not a prediction. The setup forms near a potential D1 top area. Strategy Strategy name: The Big Short This setup focuses on short signals when multiple conditions align. When confluence appears at higher timeframe levels, price may move quickly. Leverage amplifies both risk and reward. Risk management is mandatory. Entry Zones Planned short zones: 0.19 0.22 0.24 Position should be managed in parts to reduce execution risk. Trade Management Possible management approach: Partial profit taking or active management based on price reaction. With leverage, returns can be significant if the scenario plays out. Losses must be predefined if structure fails. Time Expectation This setup is expected to develop over a short term window. It follows the current cycle rather than intraday noise. Risk Note Always define invalidation before entry. If price breaks the structure, the idea is invalid. Capital protection comes first.
rainbow_sniper
بیت کوین به ۲۵۰ هزار دلار میرسد؟ تحلیل فاز توزیع و قیمتهای پیش رو!
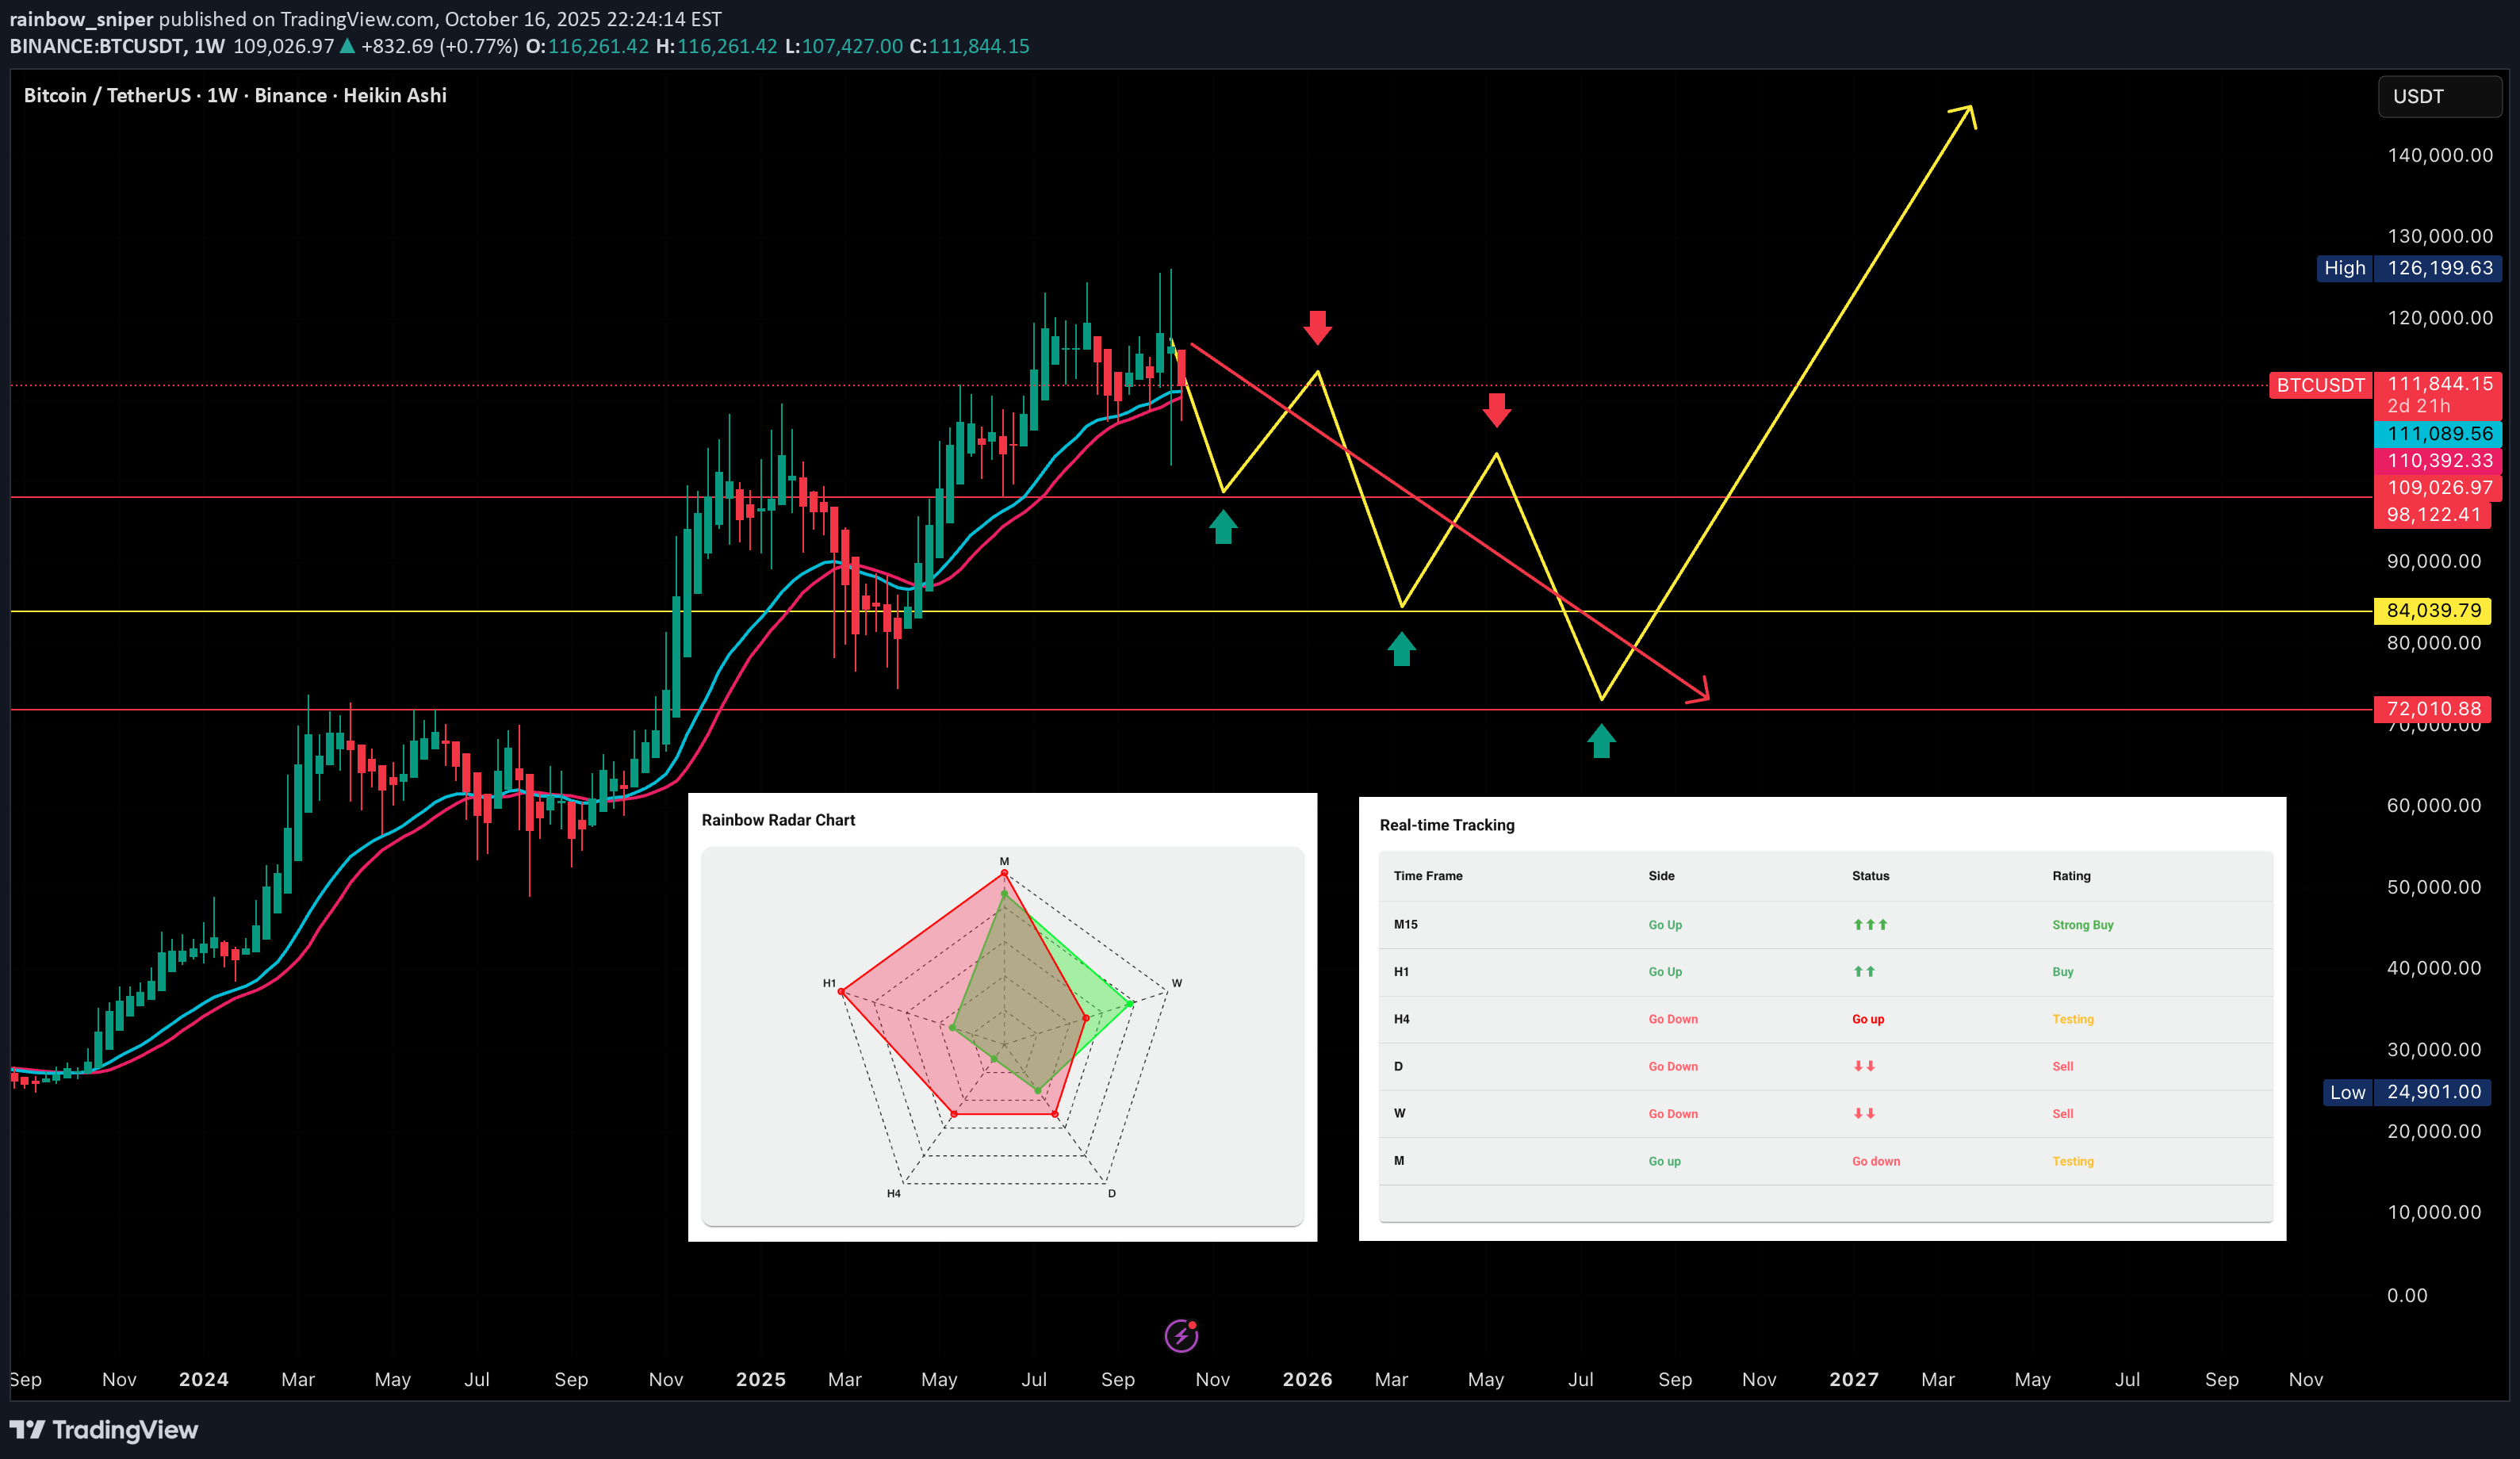
⚠️ BTCUSDT (W–M–6M) — WILL IT REALLY GO TO $250,000? 📈 Macro View | 🧭 Cycle Analysis | 💰 Distribution Phase Ahead 🧠 1. The FOMO Trap If you still believe BTC will shoot straight to $180,000 or $250,000 from the current base, that belief itself is your biggest risk. Why? Because that mindset pushes traders to LONG around the ATH, or buy spot positions at exhaustion, only to get liquidated or trapped holding the top. Remember: The current bull wave began on October 1st 2023. It has already run two full years of continuous growth. From wave base to ATH, BTC has gained roughly +600%. That’s not an “early trend.” That’s a distribution zone in disguise. 🧩 2. The Structure: Monthly Distribution, Weekly Volatility Yes — BTCUSDT is in the Monthly distribution phase. But short-term, the Monthly (M) structure isn’t ready to roll over just yet. Throughout October and November 2025, we’ll likely see BTC revisit ATH levels again — but every retest of those highs will trigger heavy distribution waves. Expect sharp sell-offs toward: $97,000 $83,000 $73,000 These zones represent Weekly correction layers, where the market will stage temporary rebounds — not new macro uptrends. ⚔️ 3. How to Operate in This Zone This stage isn’t about SWING LONGS — the upside reward/risk ratio is shrinking fast. Instead, treat it as a segment-by-segment battlefield: If you Short, do it near ATH liquidity zones. If you Long, do it tactically at corrective supports only. Never chase green candles — every rally is someone else’s exit. For SPOT investors, patience is your strongest position: wait for $73k–$83k range reactions before considering re-entry. 🎯 4. The Long Game After the correction plays out, BTCUSDT will eventually earn the right to travel toward $200,000+ — but not from here, not yet, and not in one straight line. We’re nearing the top of the mountain, not the launch pad. 🧘 Summary Cycle: 2-year run complete Gain: +600% from wave base Current state: Monthly distribution Short-term: Sideways → Sell-off → Correction Mid-term opportunity: Spot re-entry near $73k–$83k Long-term potential: $200k+, once the next base is formed Trade what’s in front of you, not what you hope for. The mountain’s summit isn’t where new journeys begin — it’s where climbers rest and descend. 💬 Follow for macro cycle updates and deep-wave analyses from Rainbowsniper.ai — “The Market Brain.”
rainbow_sniper
اوج قیمت ZEC تأیید شد: آیا زمان فروش فرا رسیده است؟ (تحلیل کامل)
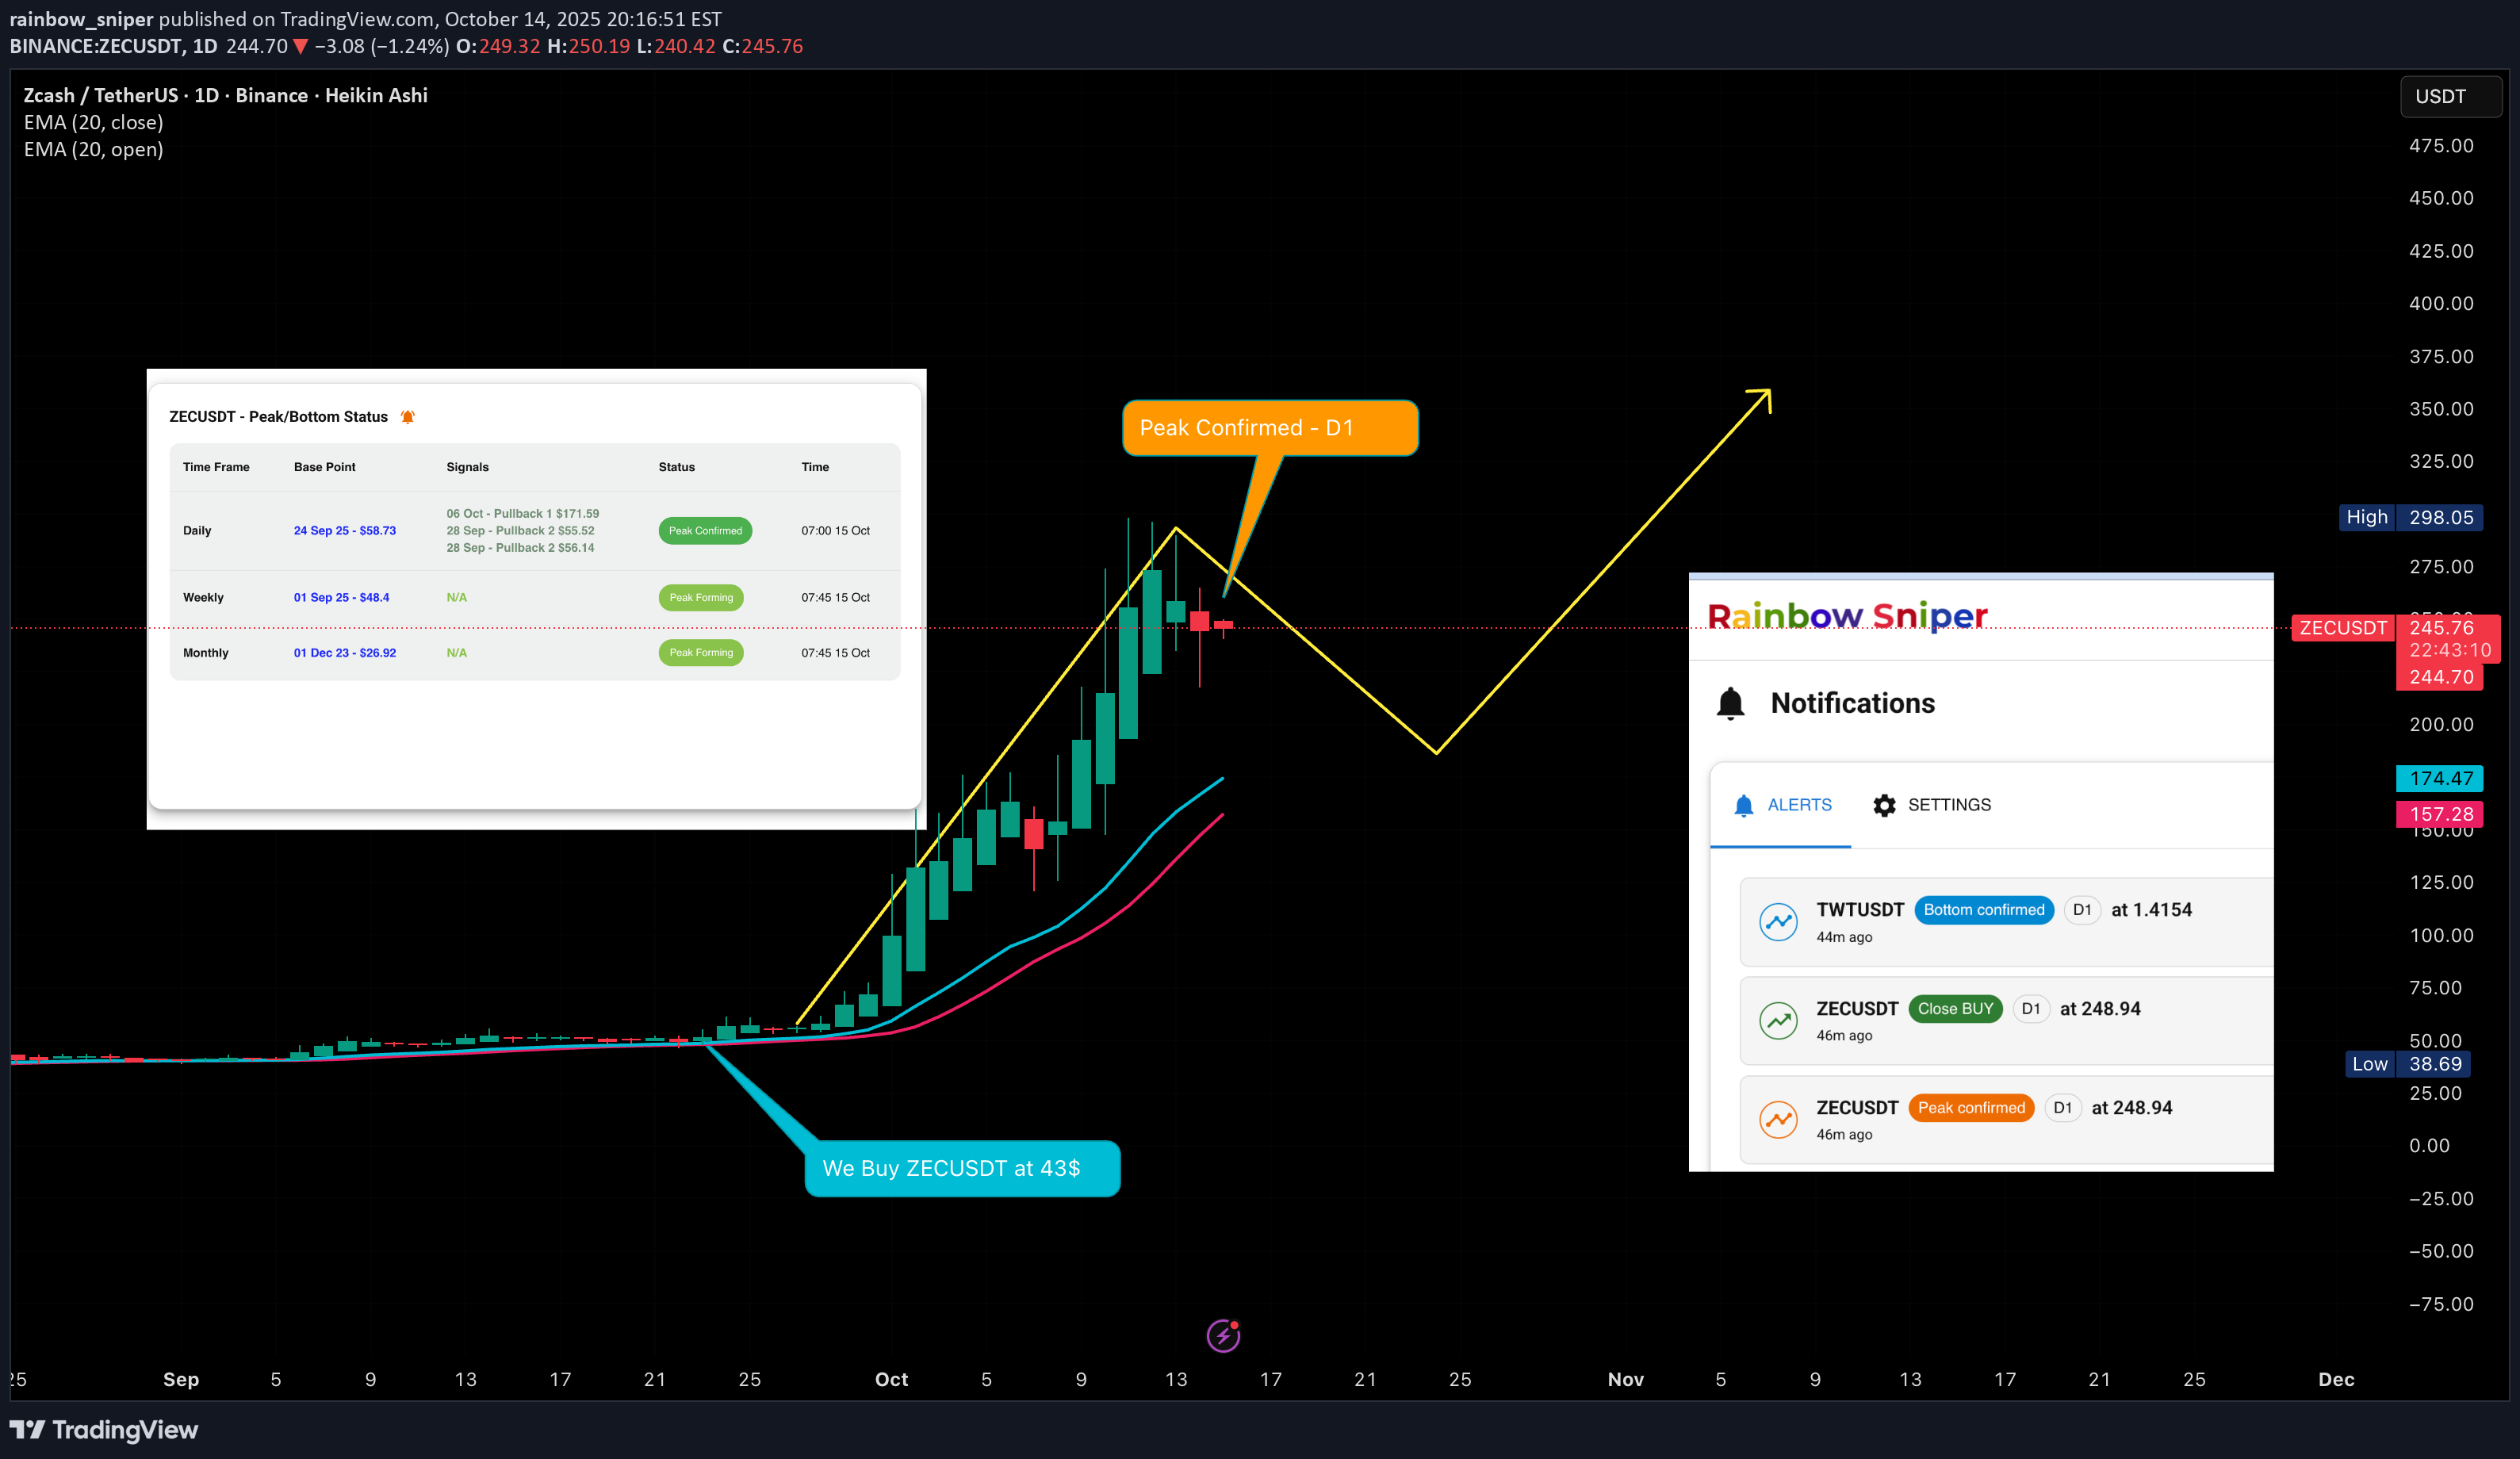
⚠️ ZECUSDT — D1 Peak Confirmed! Should You Cash Out? We bought ZEC early around $43, and it has now rocketed nearly 7× from our base entries. Not only that — we also caught multiple pullback buys along the way. 📈 Macro Setup (W & M Trend) ZEC remains in a strong uptrend across Weekly and Monthly charts. The most recent Weekly wave base formed near $48, confirmed on Sept 1, 2025 — the true starting point of this powerful rally. 🧩 Daily Wave (D1 Structure) On the Daily chart, the wave base was confirmed around $58 on Sept 24, 2025. After that, we had two great pullback entries: Sept 28, 2025: $55–56 Oct 6, 2025: $171 Each one printed healthy profits before today’s D1 Peak Confirmation. 💰 Action Plan Cash Out short-term pullback positions — protect the gains. Hold the core Weekly positions for the next resistance zone at $360–$400. Expect a D1 correction soon, as the market cools off after a huge run. 🎯 Summary ZEC has given us abundance. D1 peak = confirmed, correction phase incoming. Lock in the pullback profits, stay patient with the Weekly ride to $360–$400.
rainbow_sniper
اوجگیری ماهانه بیت کوین تأیید شد: آیا دوره توزیع و ریزش سنگین آغاز شده است؟
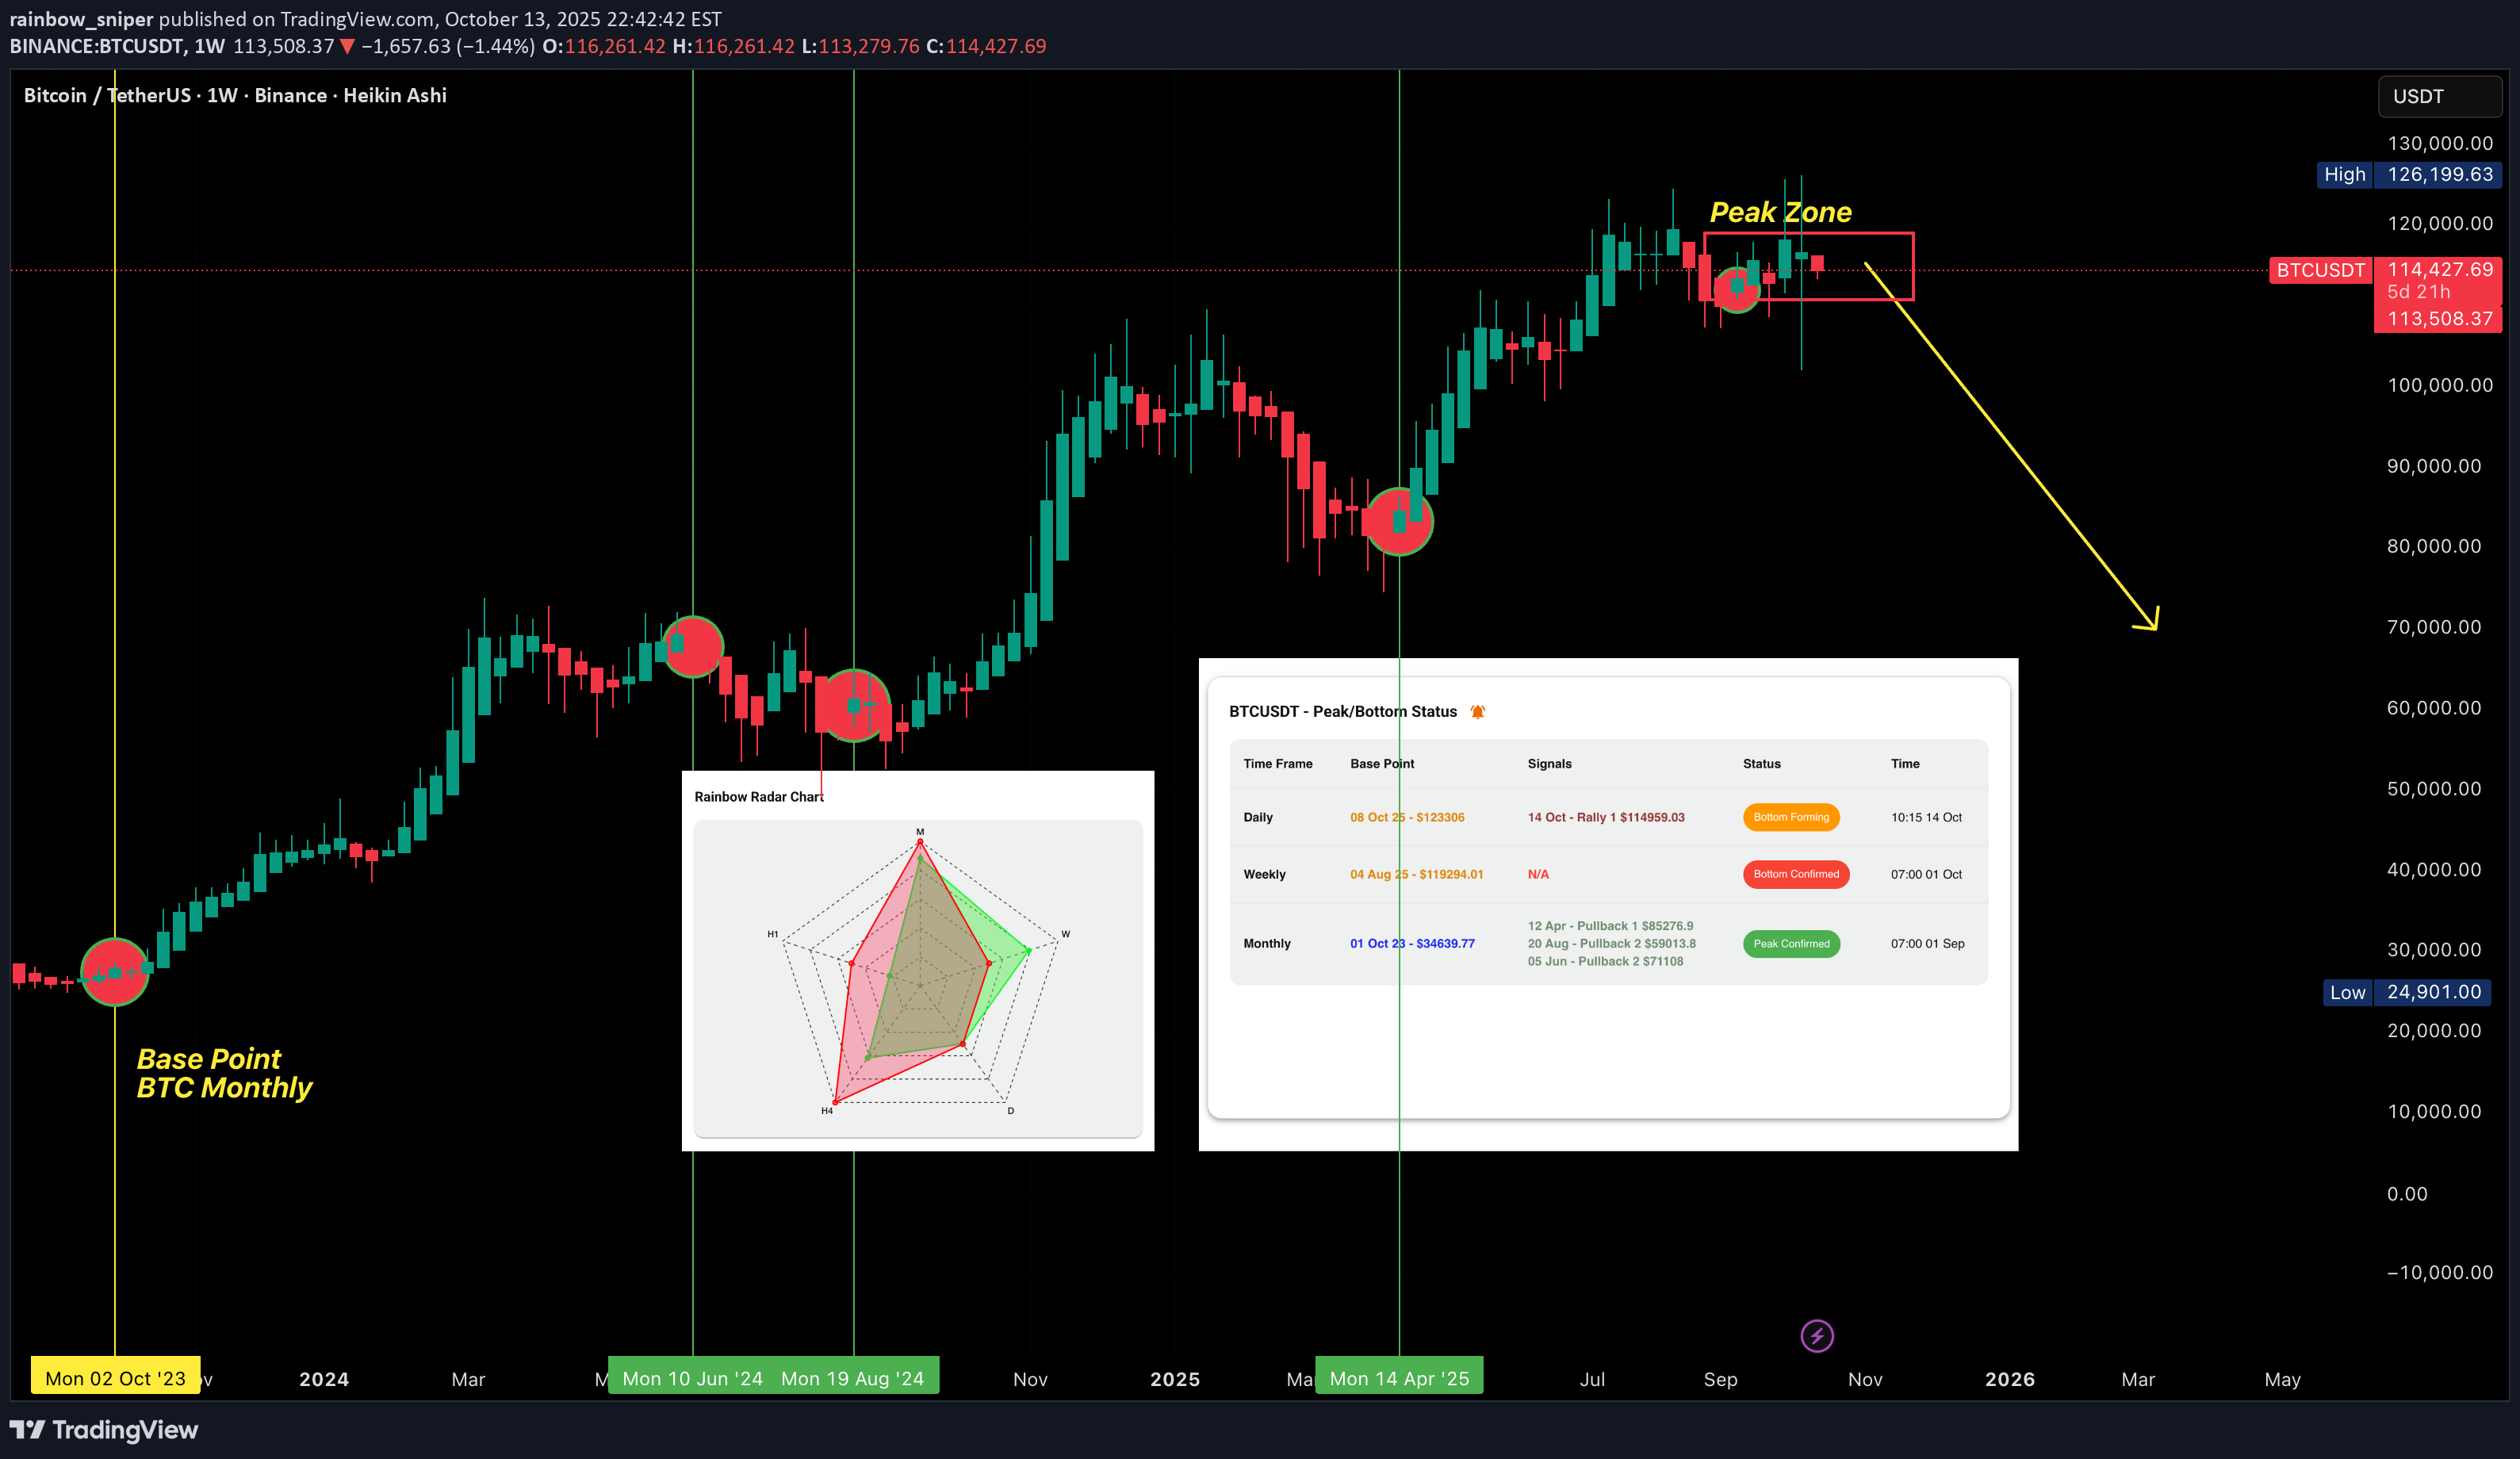
BTCUSDT — Monthly Peak Confirmed: Distribution Phase Begins Bitcoin has just flashed a Monthly Peak Confirmation, hinting that the market may have entered its distribution zone after a two-year bull run. 1. The Origin of the Wave: The current bullish wave began on October 1st, 2023, when BTC traded around $34,639. From that level, price climbed relentlessly until September 1st, 2025, marking a top near $119,000. Anyone who bought at the wave’s origin would be sitting on more than $90,000 profit per BTC after almost two years. 2. Key Pullback Opportunities: Throughout the uptrend, BTC offered three clear pullback entries: June 5th, 2024 August 20th, 2024 April 12th, 2025 Each of these corrections gave profitable continuation entries before the final monthly peak. 3. Current Status (October 14th, 2025): BTC trades near $115,000, only slightly below the all-time high. However, the chart structure shows that Monthly Peak = Confirmed, implying the start of an ATH distribution phase — the moment when large holders quietly reduce exposure. 4. Forward Outlook: We now anticipate a SWING SHORT setup developing on the Monthly timeframe. Target: $77,000 — a long and deep retracement expected to unfold over several months. This is not a flash crash scenario but a slow, heavy correction marking the end of the bull cycle and transition into consolidation. Summary: Bitcoin has completed its two-year impulse wave from $34K to $119K. Monthly peak confirmed → distribution started → next macro opportunity lies on the short side.
rainbow_sniper
SUPERUSDT – Multi-timeframe Analysis (29/09/2025)

📊 SUPERUSDT – Multi-timeframe Analysis (29/09/2025) 🔹 Realtime Tracking Intraday (D1–H4): Both Daily and 4H show Go Up, reflecting short-term strength. Weekly (W–D1): Weekly and Daily remain aligned on the upside, confirming mid-term support. Monthly (M–W): Monthly still shows Correction, while Weekly holds BUY → long-term trend is not yet fully confirmed. 🔹 Rainbow Radar Chart Monthly: Red inside, narrow green loop → weak long-term structure, low inflows. Weekly: Red outer layer, green wide → strong BUY momentum with visible capital flow. Daily: BUY bias but with limited expansion → short-term trend still building up. H4 & H1: BUY present, with H1 showing strong expansion. 👉 Overall: Strength is concentrated in the short and mid-term, while the long-term trend is still in correction. 🔹 Daily Signals Signals: 3 Win rate: 100% Avg return: ~22.59% Current price: around 0.90, spiking after an extended accumulation phase. 📌 This post reflects statistical data from the dashboard and does not represent investment advice.
rainbow_sniper
OGUSDT – W Pattern Add-on Signal
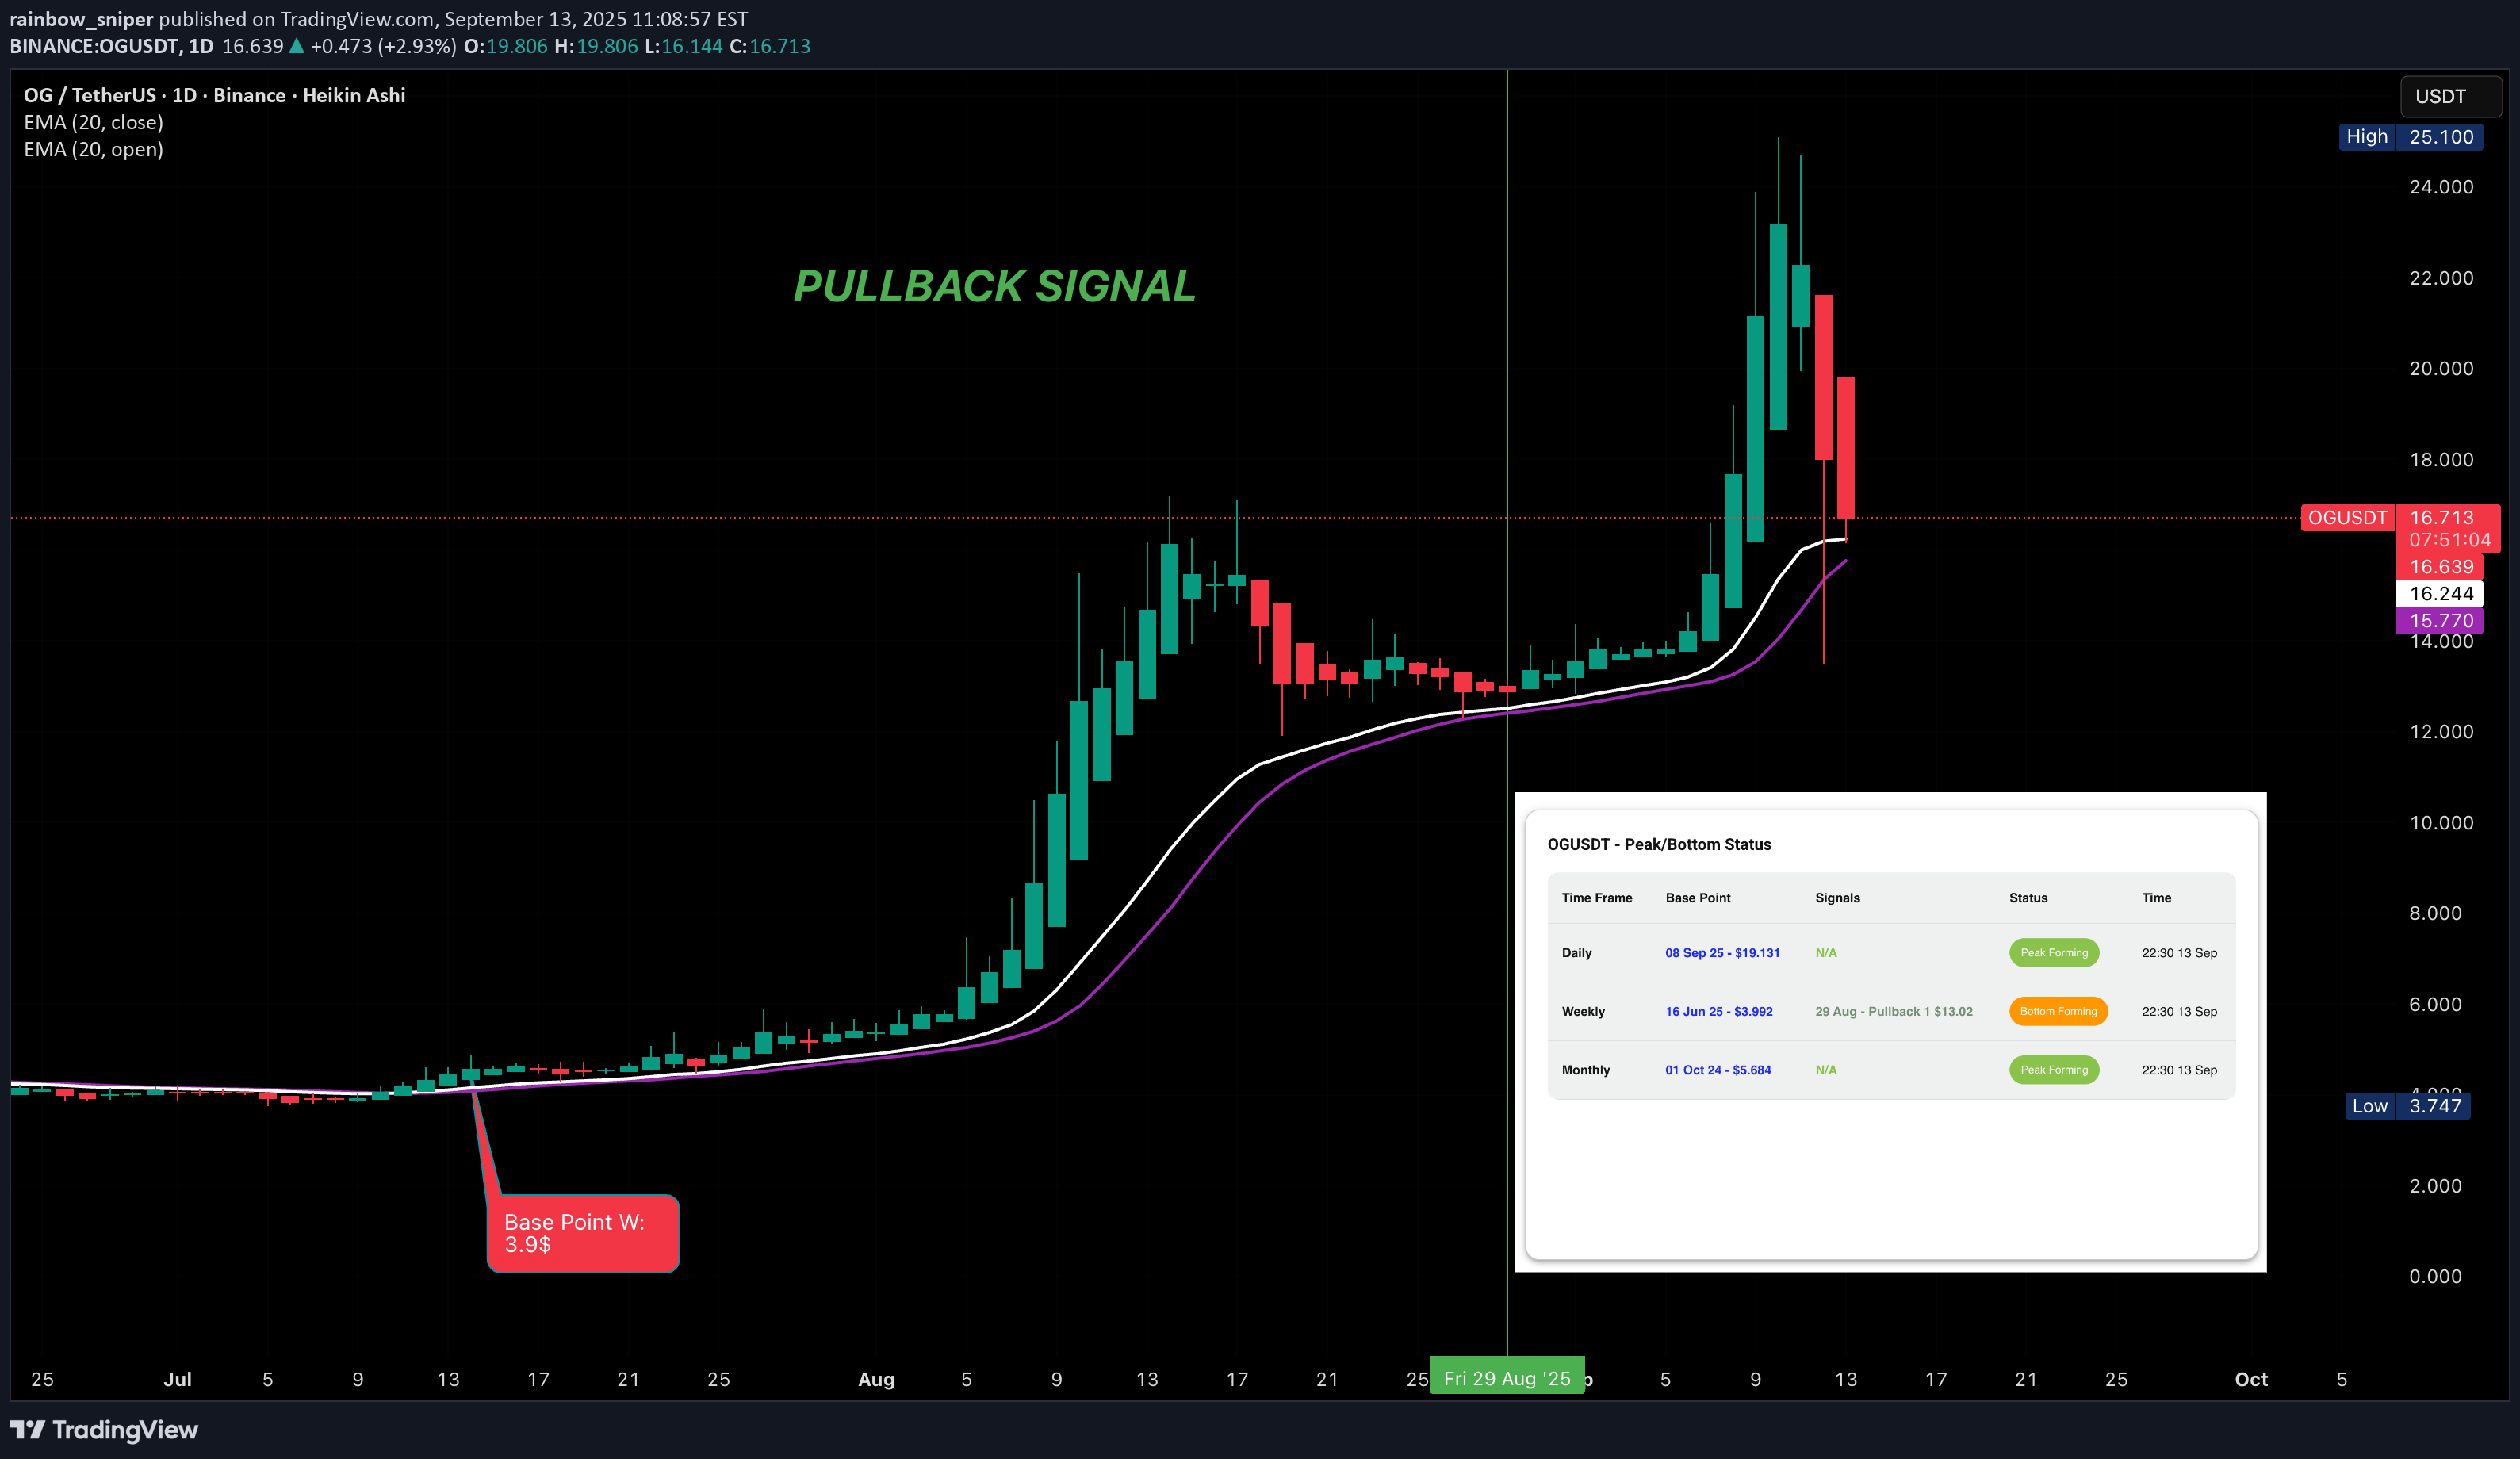
OGUSDT – W Pattern Add-on Signal In early September, I shared with my group that OGUSDT was one of the must-watch plays for this cycle. Alongside OG, we were also tracking HIFI, YGG, LINK, SOL, ETH, and others. With an automated data analysis system, signals like these can be detected and alerted in a clear and structured way. OG formed a W-pattern base at the $3 level on June 16, 2025. A pullback signal then appeared on August 28, 2025, with an entry around $13. After a short rally, on September 8, 2025, the daily timeframe confirmed a new upward leg, entering a bullish cycle toward the $24+ zone. This entire process was captured automatically, operating 24/7.
rainbow_sniper
BTCUSDT — D1 Bottom Still Not Complete?

BTCUSDT — D1 Bottom Still Not Complete? The market’s process works with precision. Not yet means exactly that — even if price pushes higher, it will eventually return to complete the bottom formation. On the D1 timeframe, BTCUSDT began forming its bottom on July 24, 2025 at $118,300. On the W timeframe, BTCUSDT started its upward leg on May 12, 2025 (W’s third peak). On the M timeframe, BTCUSDT began its upward leg on October 1, 2023 and is now in the process of forming a top before a potential decline. Our strategy is patience: let BTC complete this final D1 peak. Potential long entries: Around $115,500 Or when BTCUSDT officially completes its D1 bottom formation — at which point we can also long altcoins to ride the next wave of capital inflow.
rainbow_sniper
BTCUSDT — No New D1 BUY Signal Yet

BTCUSDT — No New D1 BUY Signal Yet Even as BTCUSDT pulls back, I’m confident we still have one more D1 peak ahead — likely pushing above the 123k zone — before it gradually tops out on the D1, then W, and eventually the M timeframe. When that happens, BTC will start to decline, TOTAL will see outflows, and TOTAL2 and TOTAL3 will follow suit. In other words, BTC and TOTAL will hold their top range to give altcoins (which began their run in July) time to form their own W tops. Once that’s complete, the entire market will decline together — potentially bringing TOTAL down toward the $2.5T level. That stage of the market will feel bleak and hopeless, but it will also be the moment to accumulate assets forming W bottoms. For now, we wait for one more drop on H4 to long BTC. As for altcoins you already hold — XRP, ZEN, LTC, HBAR, XLM, ETH, LINK, and others — keep holding. It’s not yet the time to take profits.
Disclaimer
Any content and materials included in Sahmeto's website and official communication channels are a compilation of personal opinions and analyses and are not binding. They do not constitute any recommendation for buying, selling, entering or exiting the stock market and cryptocurrency market. Also, all news and analyses included in the website and channels are merely republished information from official and unofficial domestic and foreign sources, and it is obvious that users of the said content are responsible for following up and ensuring the authenticity and accuracy of the materials. Therefore, while disclaiming responsibility, it is declared that the responsibility for any decision-making, action, and potential profit and loss in the capital market and cryptocurrency market lies with the trader.