
AAPLX
Apple tokenized stock (xStock)
| تریدر | نوع سیگنال | حد سود/ضرر | زمان انتشار | مشاهده پیام |
|---|---|---|---|---|
 KrisadaYoonaisilRank: 635 | خرید | حد سود: تعیین نشده حد ضرر: تعیین نشده | 11/6/2025 | |
 LevelUpToolsRank: 675 | خرید | حد سود: تعیین نشده حد ضرر: تعیین نشده | 11/4/2025 | |
 isahebdadiRank: 1056 | خرید | حد سود: تعیین نشده حد ضرر: تعیین نشده | 11/6/2025 | |
 Truck14Rank: 32023 | خرید | حد سود: تعیین نشده حد ضرر: تعیین نشده | 11/14/2025 | |
خرید | حد سود: تعیین نشده حد ضرر: تعیین نشده | 11/12/2025 |

Price Chart of Apple tokenized stock (xStock)
سود 3 Months :
سیگنالهای Apple tokenized stock (xStock)
Filter
Sort messages by
Trader Type
Time Frame

tomj2417
اصلاح موج 4 اپل (AAPL): آیا وقت افت سهام فرا رسیده است؟
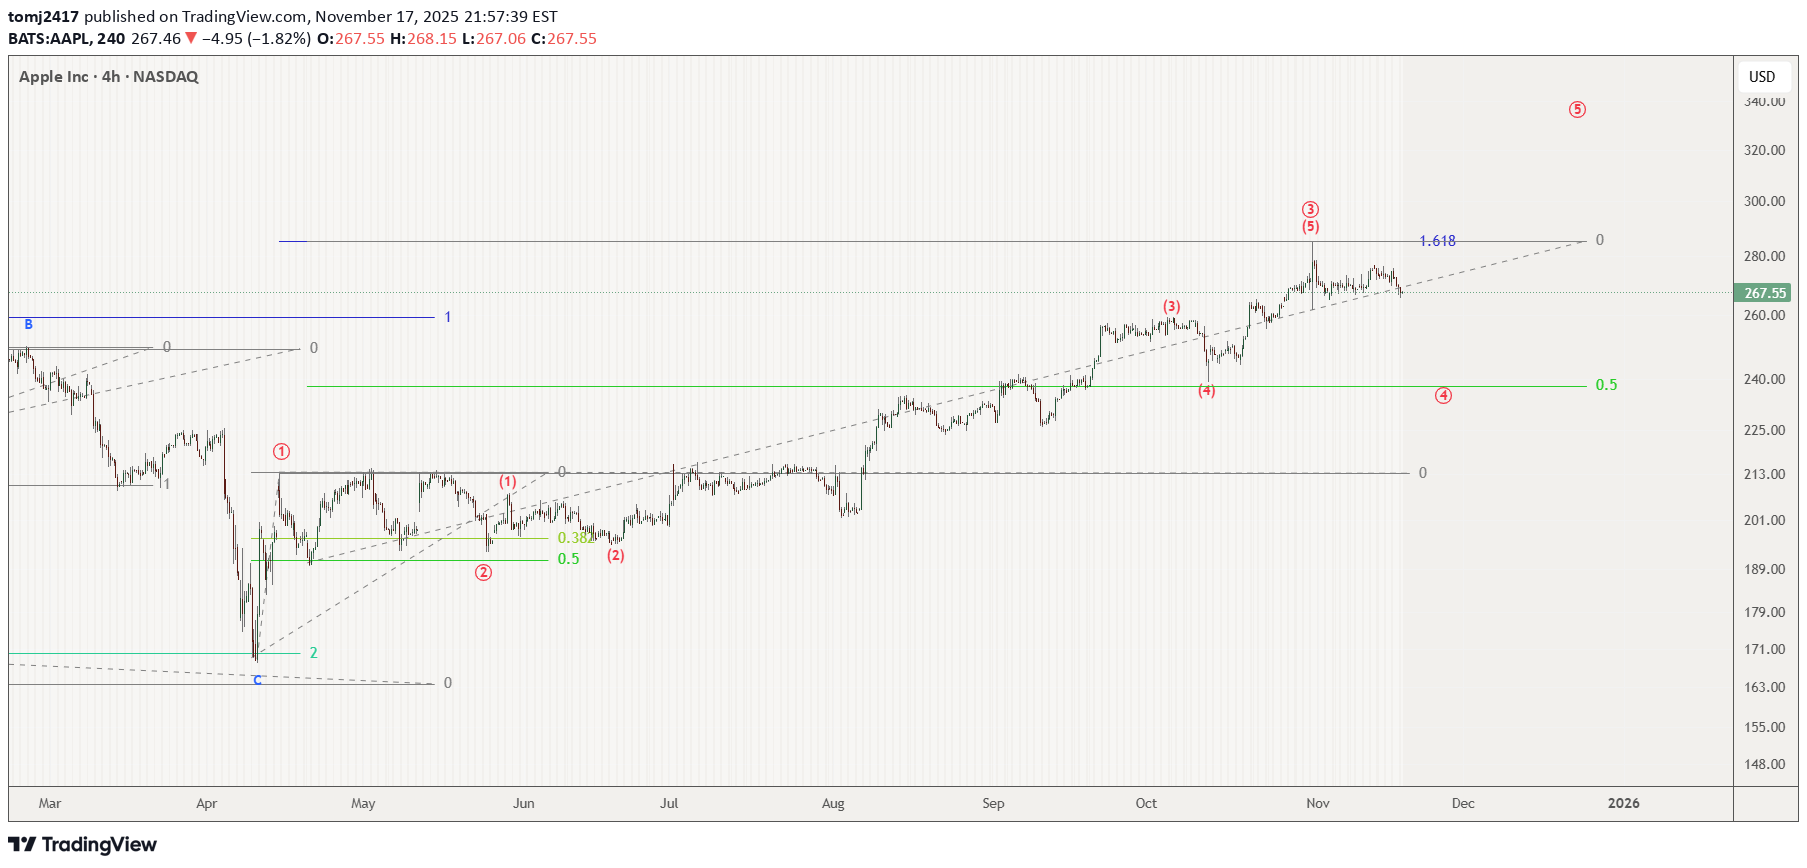
The 1.618 fib extension hit the high in AAPL perfectly which could suggest that a 3rd wave has now completed and we are looking at the decent 4th wave correction for this stock.

BullBearInsights
تحلیل تکنیکال اپل (AAPL): راز حرکت بزرگ بعدی در سطوح کلیدی پنهان است!
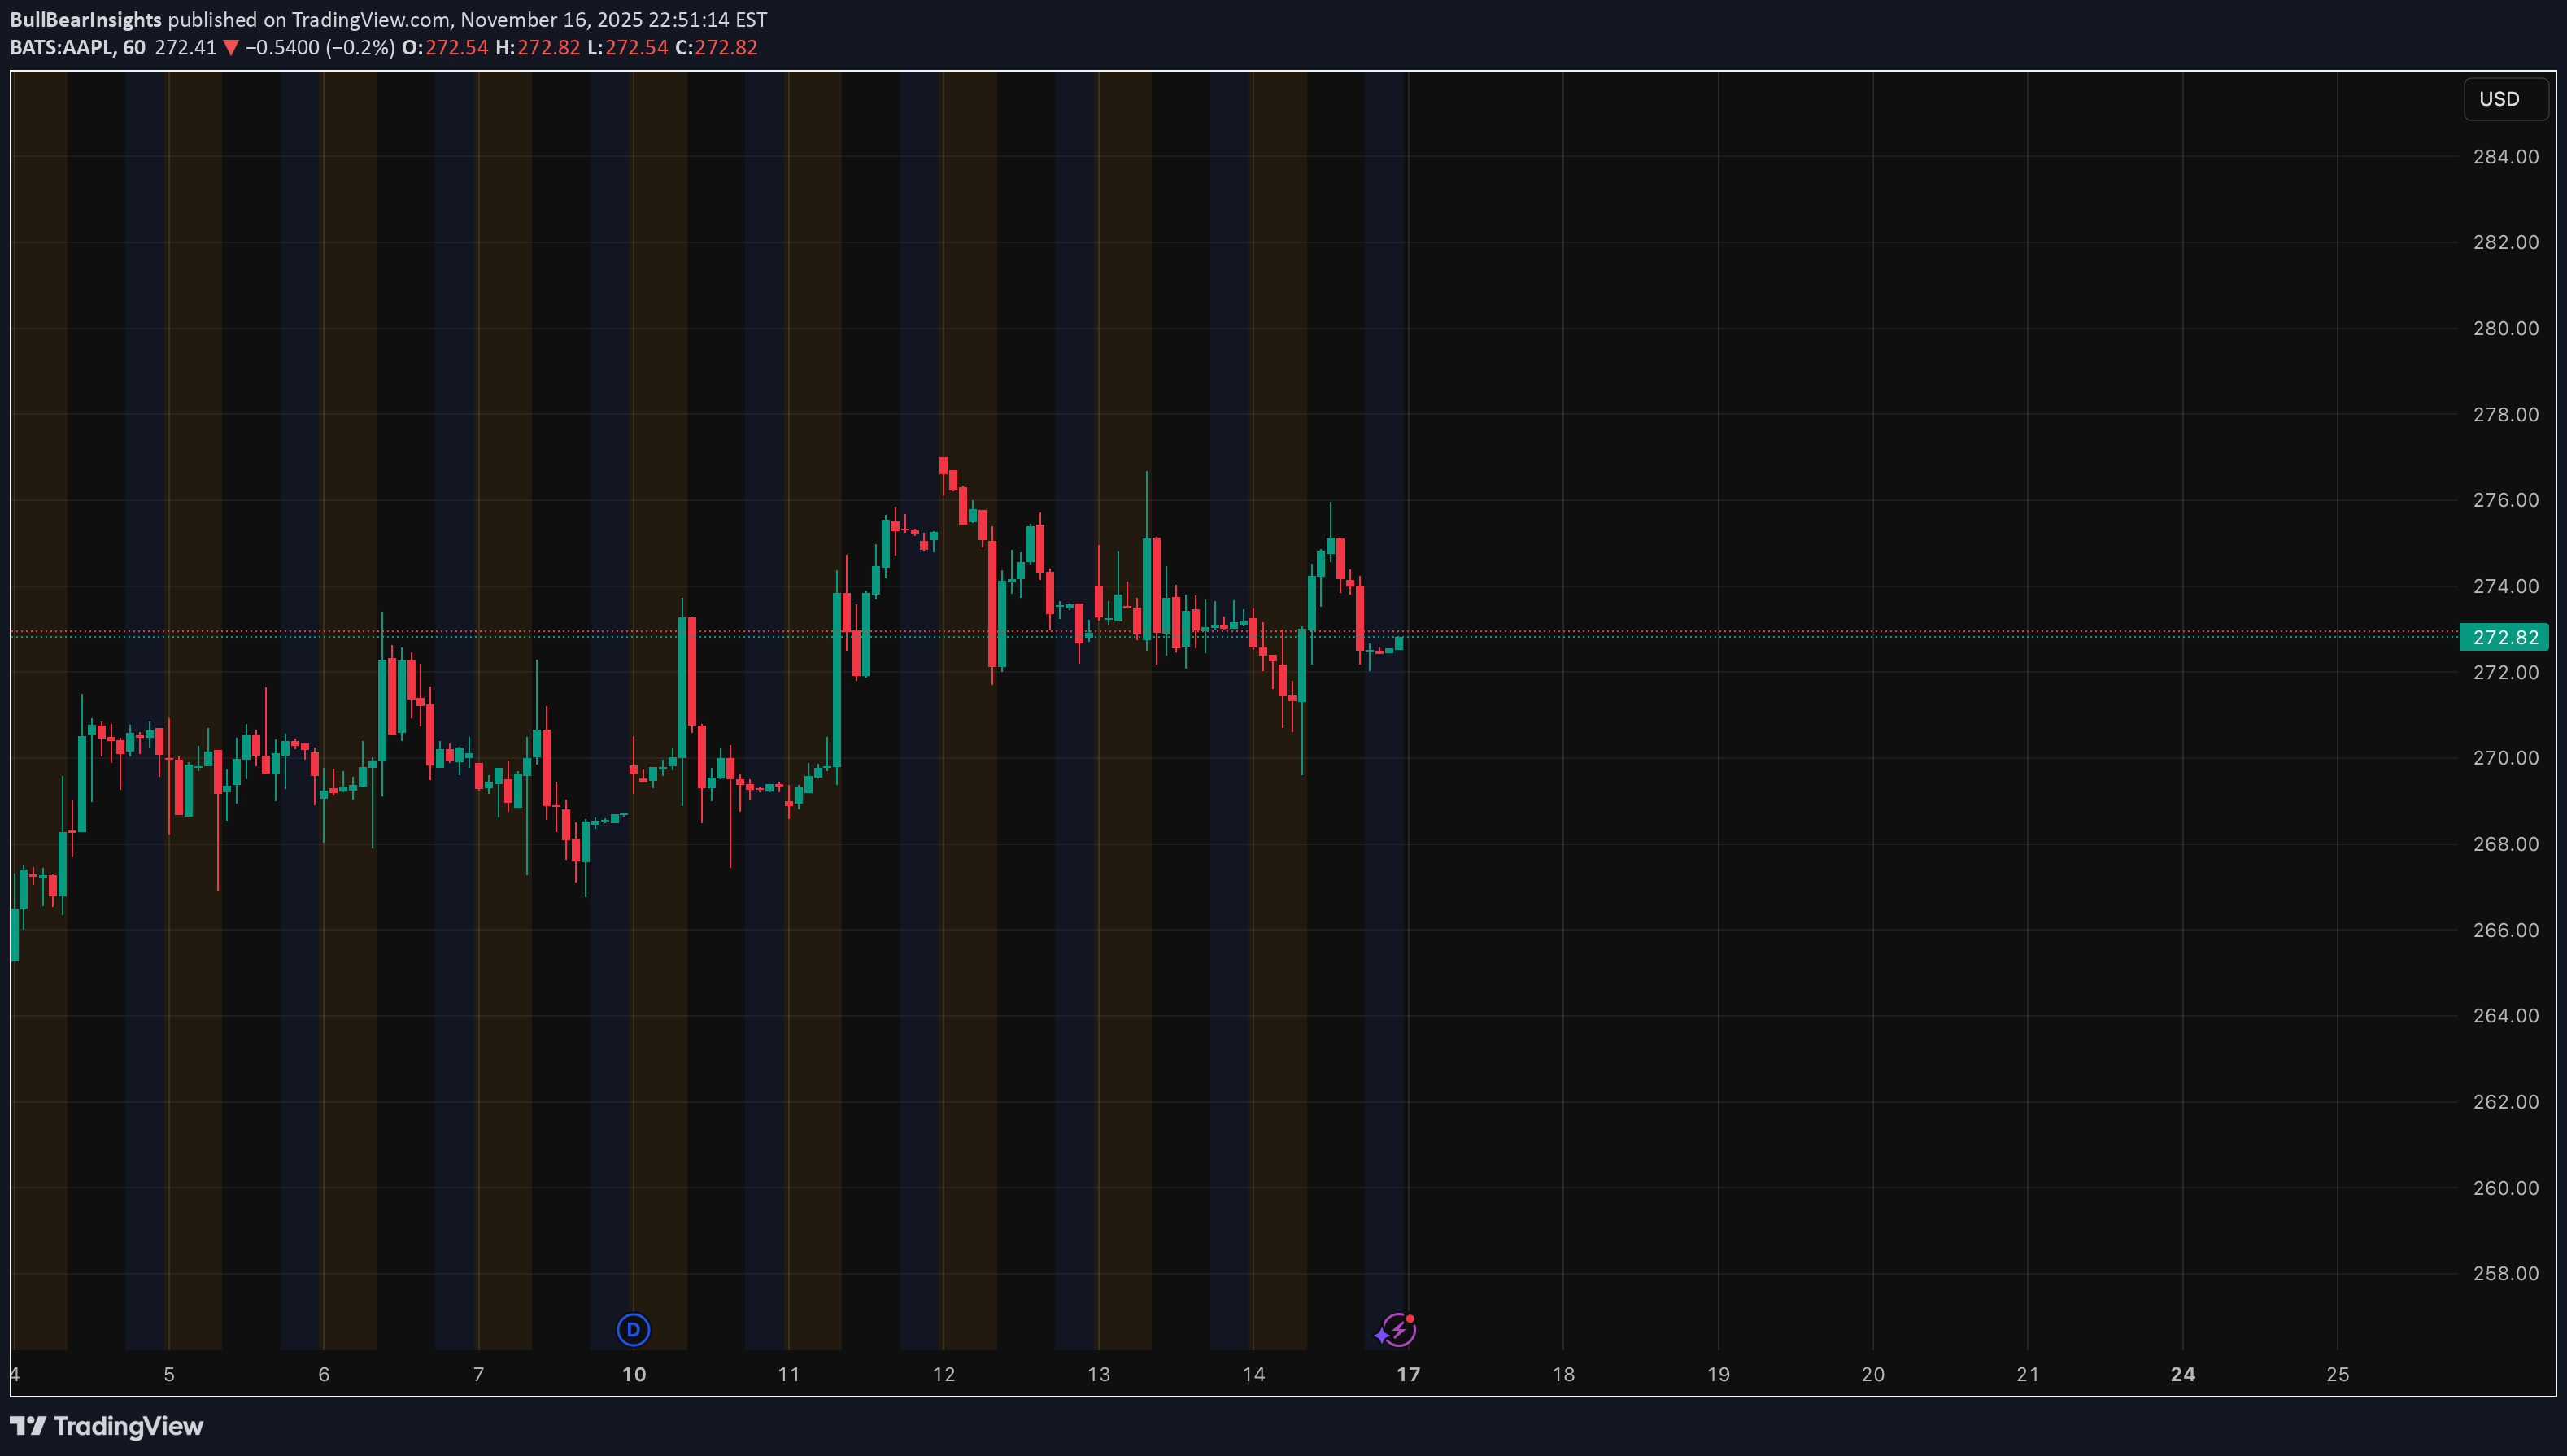
Over the last few sessions, AAPL has been stuck inside a tight range, but the way the price is reacting around 272–275 is starting to get interesting. When I line up the 1-hour, the 15-minute, and the options/GEX map together, the picture becomes clearer: AAPL is closer to a move than most traders realize. I’ll walk through the logic the same way I analyze it for myself. 1️⃣ 1-Hour Chart — Market is Coiling On the 1H chart, AAPL is still respecting the descending channel that has been developing for several days. Lower highs at 277.5 → 275 → 273.8 show sellers leaning on this structure, but the important part is the repeated defense at 272. Every push into that area gets bought. The trendline from Friday’s low also hasn’t broken, so instead of a clean downtrend, what we’re seeing is compression. That usually leads to a breakout once one side finally gives up. So on 1H: * 273.8 = the line buyers need * 272 = the line sellers want Whoever breaks first decides the direction. 2️⃣ 15-Minute Chart — Intraday Map Gets Clearer The 15M chart fills in the short-term structure that isn’t obvious on 1H. There’s a nice cluster of demand around 272.20–272.60, where an FVG is still open. That’s exactly where AAPL bounced the last time. On the opposite side, supply sits around 273.30–274, and price gets rejected as soon as it touches it. The EMAs are still flat, showing indecision, so the 15M reinforces the idea that the real move only starts when one side conquers their zone. To me, the 15M basically says: * Don’t get chopped in the middle * Wait for 274 reclaim or 272 flush * These two zones are clean and respected 3️⃣ Options/GEX Map — The Part Most Traders Miss This is where the story gets more interesting. The GEX map shows very clear magnets and barriers: Upside: * 276.70–277.00: First major call wall * 277.50–278.00: Strongest positive GEX zone If AAPL can clear 273.8, this is the type of structure that often drags price higher even when the chart looks messy. Market makers hedge into strength, and price tends to gravitate toward these zones. Downside: * 270.50–271.00: First real put shelf * 268.60: Strong put wall * 266.77: Deep hedge zone (fast moves happen here) What I like about this GEX setup is how well it explains the hesitation in price. AAPL is literally sitting right in the middle of a balanced hedging zone. Once it breaks out of it, the path becomes clean in one direction. This is why I always use GEX next to price action—it’s the part of the market structure you can’t see on the chart alone. (And yes, if you’re new to GEX, this is the kind of situation where it becomes extremely useful.) 🎯 How I’m Planning the 11/17 Session 🔼 Bullish Plan (Only if 273.80 breaks) If AAPL finally gets above 273.8 and holds it, the upside levels are clear. Stock Trade Idea: * Entry: 274–274.20 * Targets: * 275 * 276 * 276.7 → first GEX magnet * 278 → main GEX magnet Options Idea: * 275C or 277.5C * Get in after 273.8 holds, not before * Trim at GEX magnets 🔽 Bearish Plan (If 272 fails) If sellers break 272, the move down can be quick. Stock Trade Idea: * Entry: 271.80 * Targets: * 270.8 * 268.6 * 266.7 Options Idea: * 270P or 267.5P * Expect acceleration once 272 cracks, because that level lines up with options hedging pressure ⚠️ Chop Zone: 272.20–273.50 This is the area I won’t trade. Price has no momentum here and both sides get trapped. Final Thoughts AAPL doesn’t look explosive at first glance, but the multi-timeframe behavior and the way GEX levels line up tell a different story. This is the type of setup where the breakout tends to be clean once it finally happens. When price, structure, and dealer positioning all point to the same key levels, it usually pays to wait for the break and then follow the confirmation. Disclaimer This analysis is for educational purposes only and is not financial advice. Always manage risk and do your own research before trading.

vf_investment
سقف کانال صعودی اپل کجاست؟ ریسک اصلاح قیمت بزرگ در راه است؟

hi traders, AAPL is trading within a well-defined long-term ascending channel. Price is currently approaching the upper boundary of this channel, where it has historically faced resistance. Trend Structure: The broader trend remains bullish, with higher highs and higher lows consistently forming within the channel. Current Position: Price is nearing the upper trendline resistance, suggesting a potential exhaustion point for the current upward move. RSI: The monthly RSI is approaching overbought territory, indicating that upward momentum may be slowing and increasing the probability of a pullback. Potential Scenario: A rejection from the channel’s upper boundary could trigger a corrective move. The projected path shows price pulling back toward the midline or even the lower boundary of the channel, aligning with historical behavior. 🎯 Trading Idea: Watch for signs of rejection or bearish reversal patterns at the upper trendline. If confirmed, a medium-term corrective move toward the lower channel boundary could provide a high-probability buying opportunity in line with the long-term uptrend. ⚠️ Risk Note: This idea is based on technical structure only. Always consider macro factors, earnings, and risk management before entering a position.

FloBGH
افت ناگهانی سهام اپل در راه است؟ سطح حمایتی 238 دلاری کجاست؟
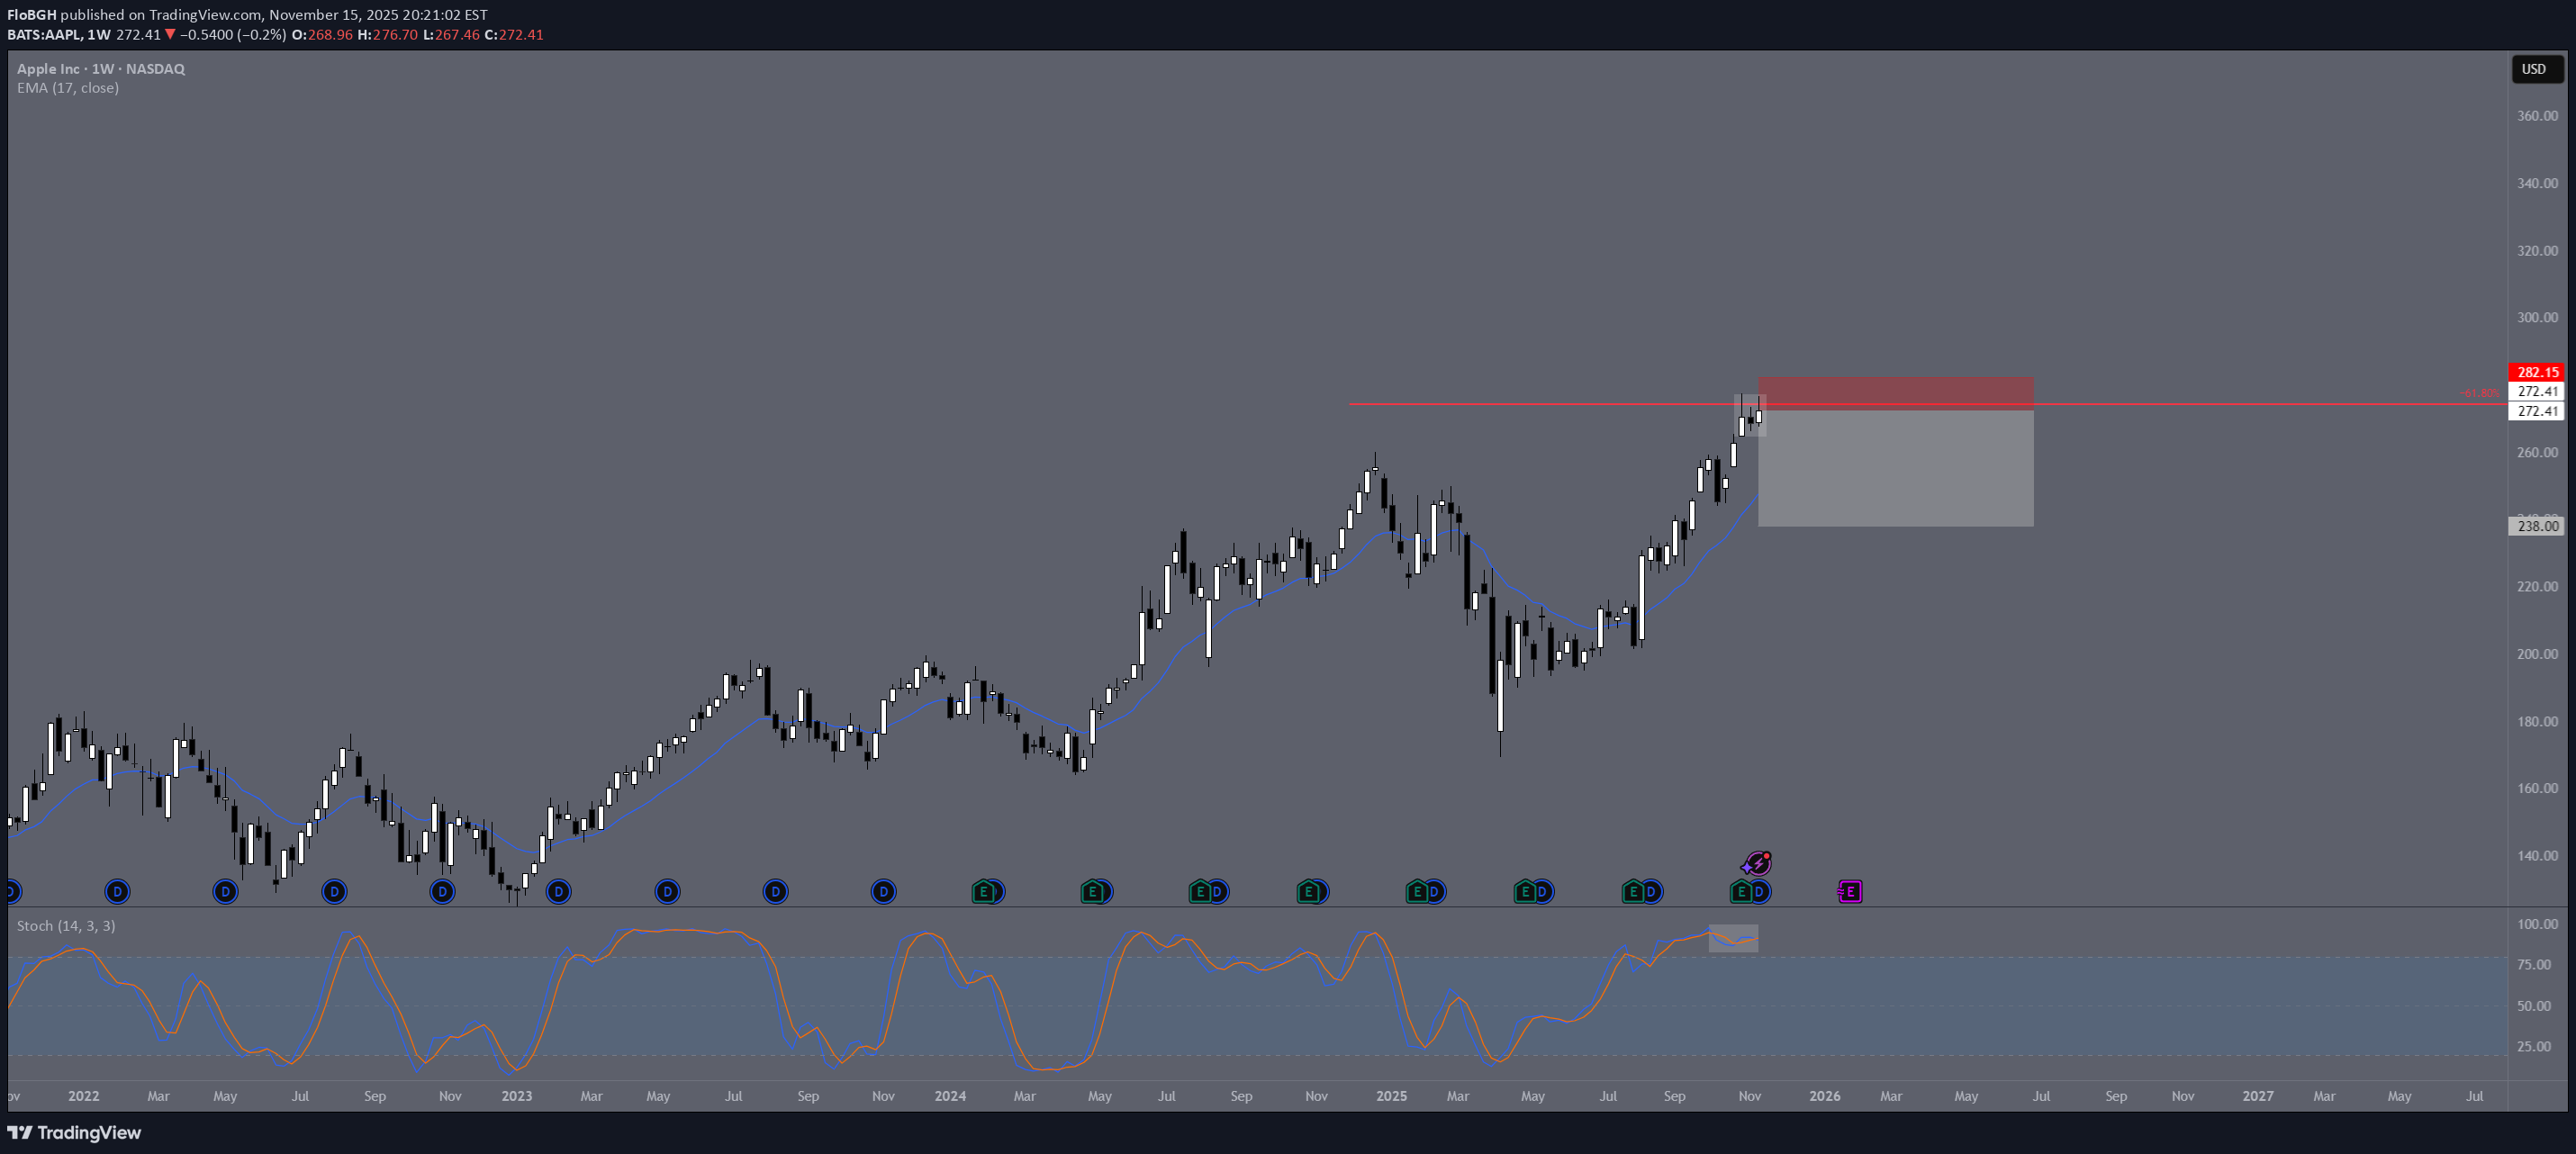
Apple Stock looks ready for a little pullback Profit Area around 238$

AnabelSignals
تحلیل تکنیکال فوری: سهام اپل (APPLE) به کجا میرود؟ (سیگنال خرید قوی!)

My dear friends, APPLE looks like it will make a good move, and here are the details: The market is trading on 272.51 pivot level. Bias - Bullish Technical Indicators: Supper Trend generates a clear long signal while Pivot Point HL is currently determining the overall Bullish trend of the market. Goal - 274.26 Recommended Stop Loss - 271.68 About Used Indicators: Pivot points are a great way to identify areas of support and resistance, but they work best when combined with other kinds of technical analysis Disclosure: I am part of Trade Nation's Influencer program and receive a monthly fee for using their TradingView charts in my analysis. ——————————— WISH YOU ALL LUCK

drasyrafz
سقوط آزاد آیفون: سطوح کلیدی حمایت و مقاومت برای رصد (285 تا 210)

iPhone dominance is declining retest zone 260–254 , a retracement Key Levels to Watch: 🟥 Resistance Trendline: 280–285 🟦 Retest Zone: 260–254 🟩 Support Trendline: 210–220

تحلیل شگفتانگیز اپل: آیا رشد 272 دلار پایان مسیر است؟
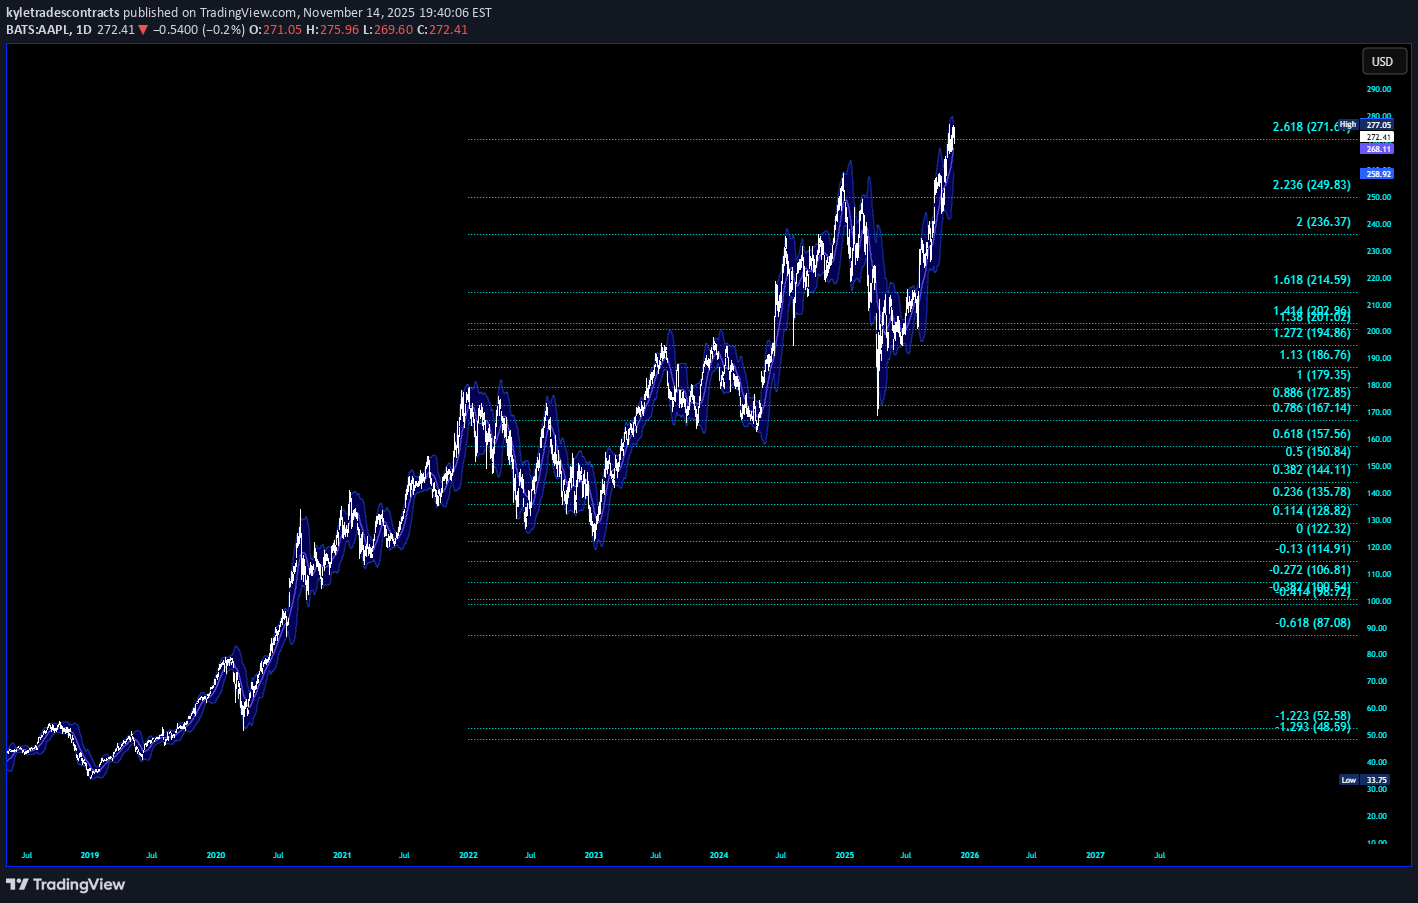
AAPL rallied up to this 2.618 here 271-272 Target 157.5 (check my profile for receipts on prior apple ideas)
Truck14
آینده درخشان اپل (AAPL): آیا قیمت به ۲۸۵ تا ۳۱۶ دلار خواهد رسید؟
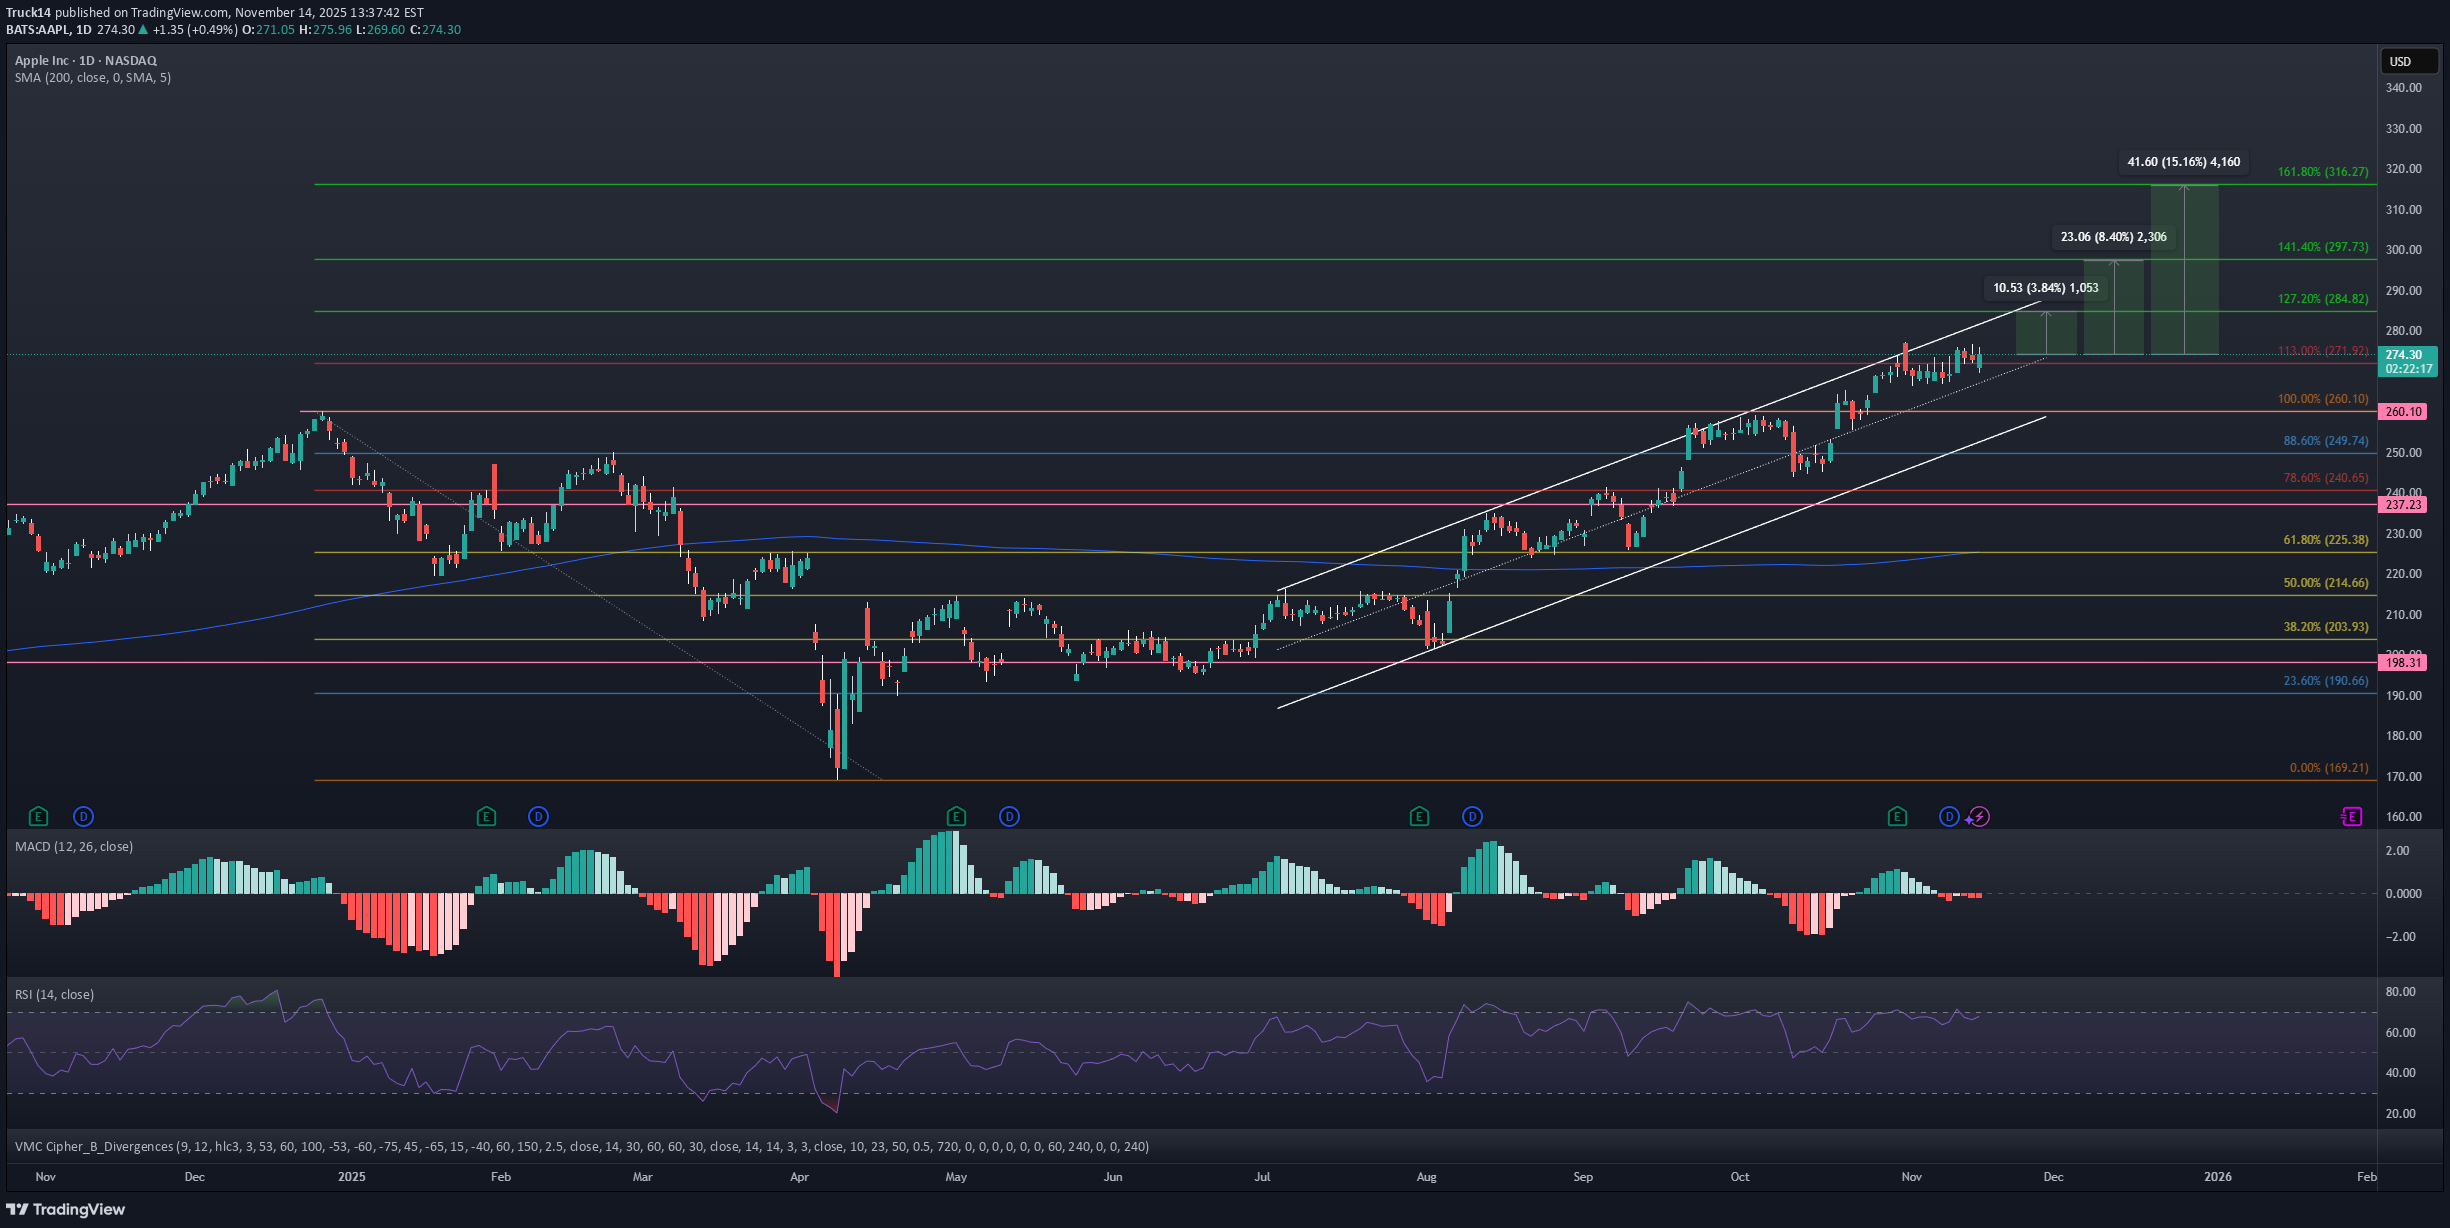
AAPL. Looks like more upside is in store for AAPL as it is on the cusp of price discovery. The daily RSI is primed at 68 right now. Additionally, if it plays catch-up to Nvidia and Google (which have hit 161.8% retraces from their December 2024 high to April 2025 lows), then one would think that $285/$300/$316 would be on deck for price targets in the relatively near future. It is also notable that Apple hasn't sold off really at all on these recent pullbacks this week. Let's see what happens.

سهام اپل (AAPL) به بالای ۲۷۵ دلار میرسد؟ تحلیل صعودی جدید!
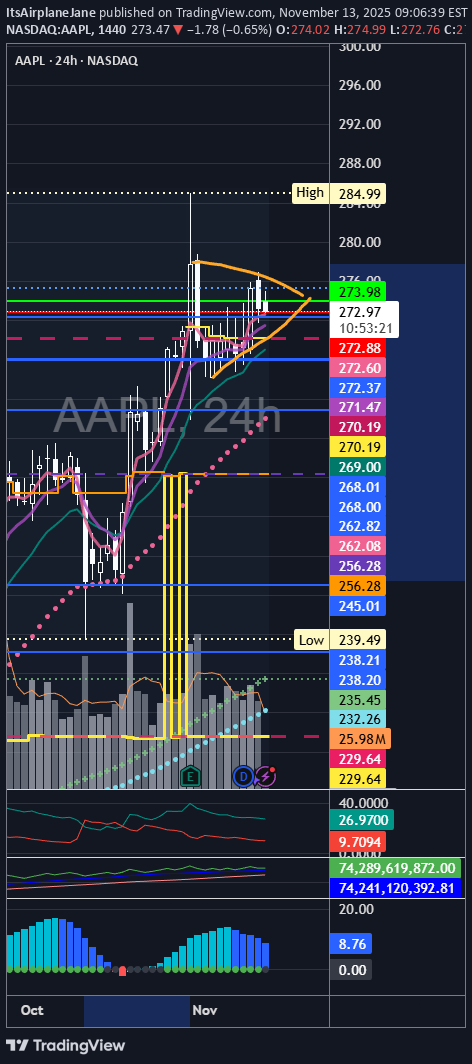
Nice 3rd leg potential above 275 for AAPL of a break down lower if we close below 270
تحلیل پروفایل حجم (Volume Profile): همه چیز درباره سطوح کلیدی حمایت و مقاومت
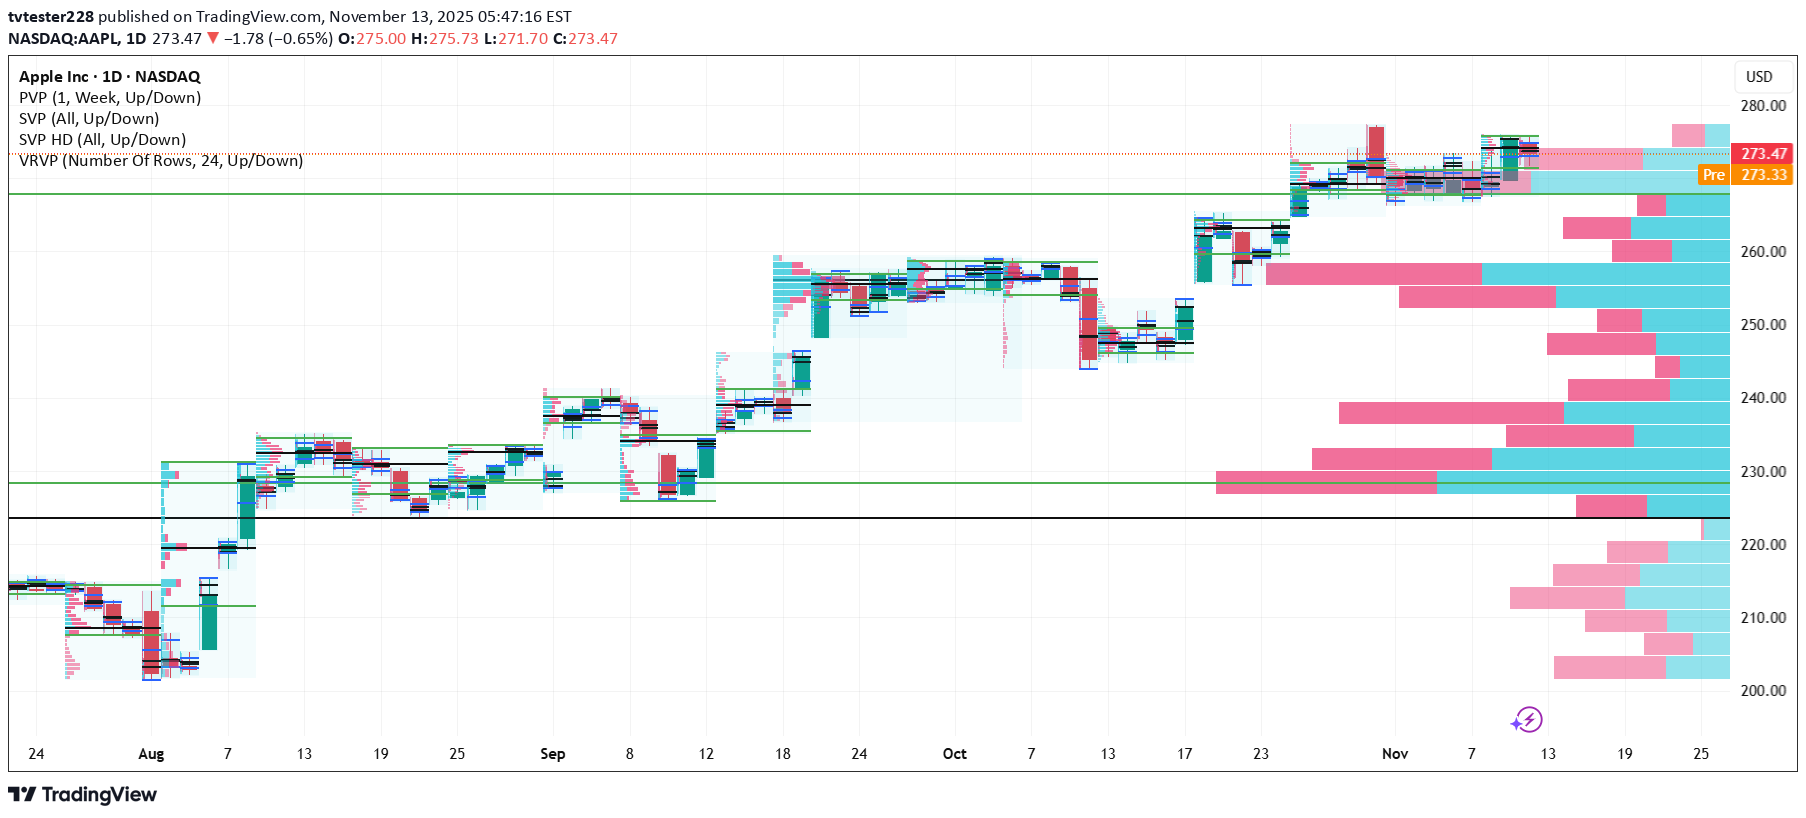
volume profile and other profiles such as svp vpsv fixed and so on
Disclaimer
Any content and materials included in Sahmeto's website and official communication channels are a compilation of personal opinions and analyses and are not binding. They do not constitute any recommendation for buying, selling, entering or exiting the stock market and cryptocurrency market. Also, all news and analyses included in the website and channels are merely republished information from official and unofficial domestic and foreign sources, and it is obvious that users of the said content are responsible for following up and ensuring the authenticity and accuracy of the materials. Therefore, while disclaiming responsibility, it is declared that the responsibility for any decision-making, action, and potential profit and loss in the capital market and cryptocurrency market lies with the trader.