
KrisadaYoonaisil
@t_KrisadaYoonaisil

What symbols does the trader recommend buying?
Purchase History
پیام های تریدر
Filter
KrisadaYoonaisil
نوسانات احساسی اتریوم: آیا ارتقاء فوساکا (Fusaka) مسیر صعودی را کلید میزند؟
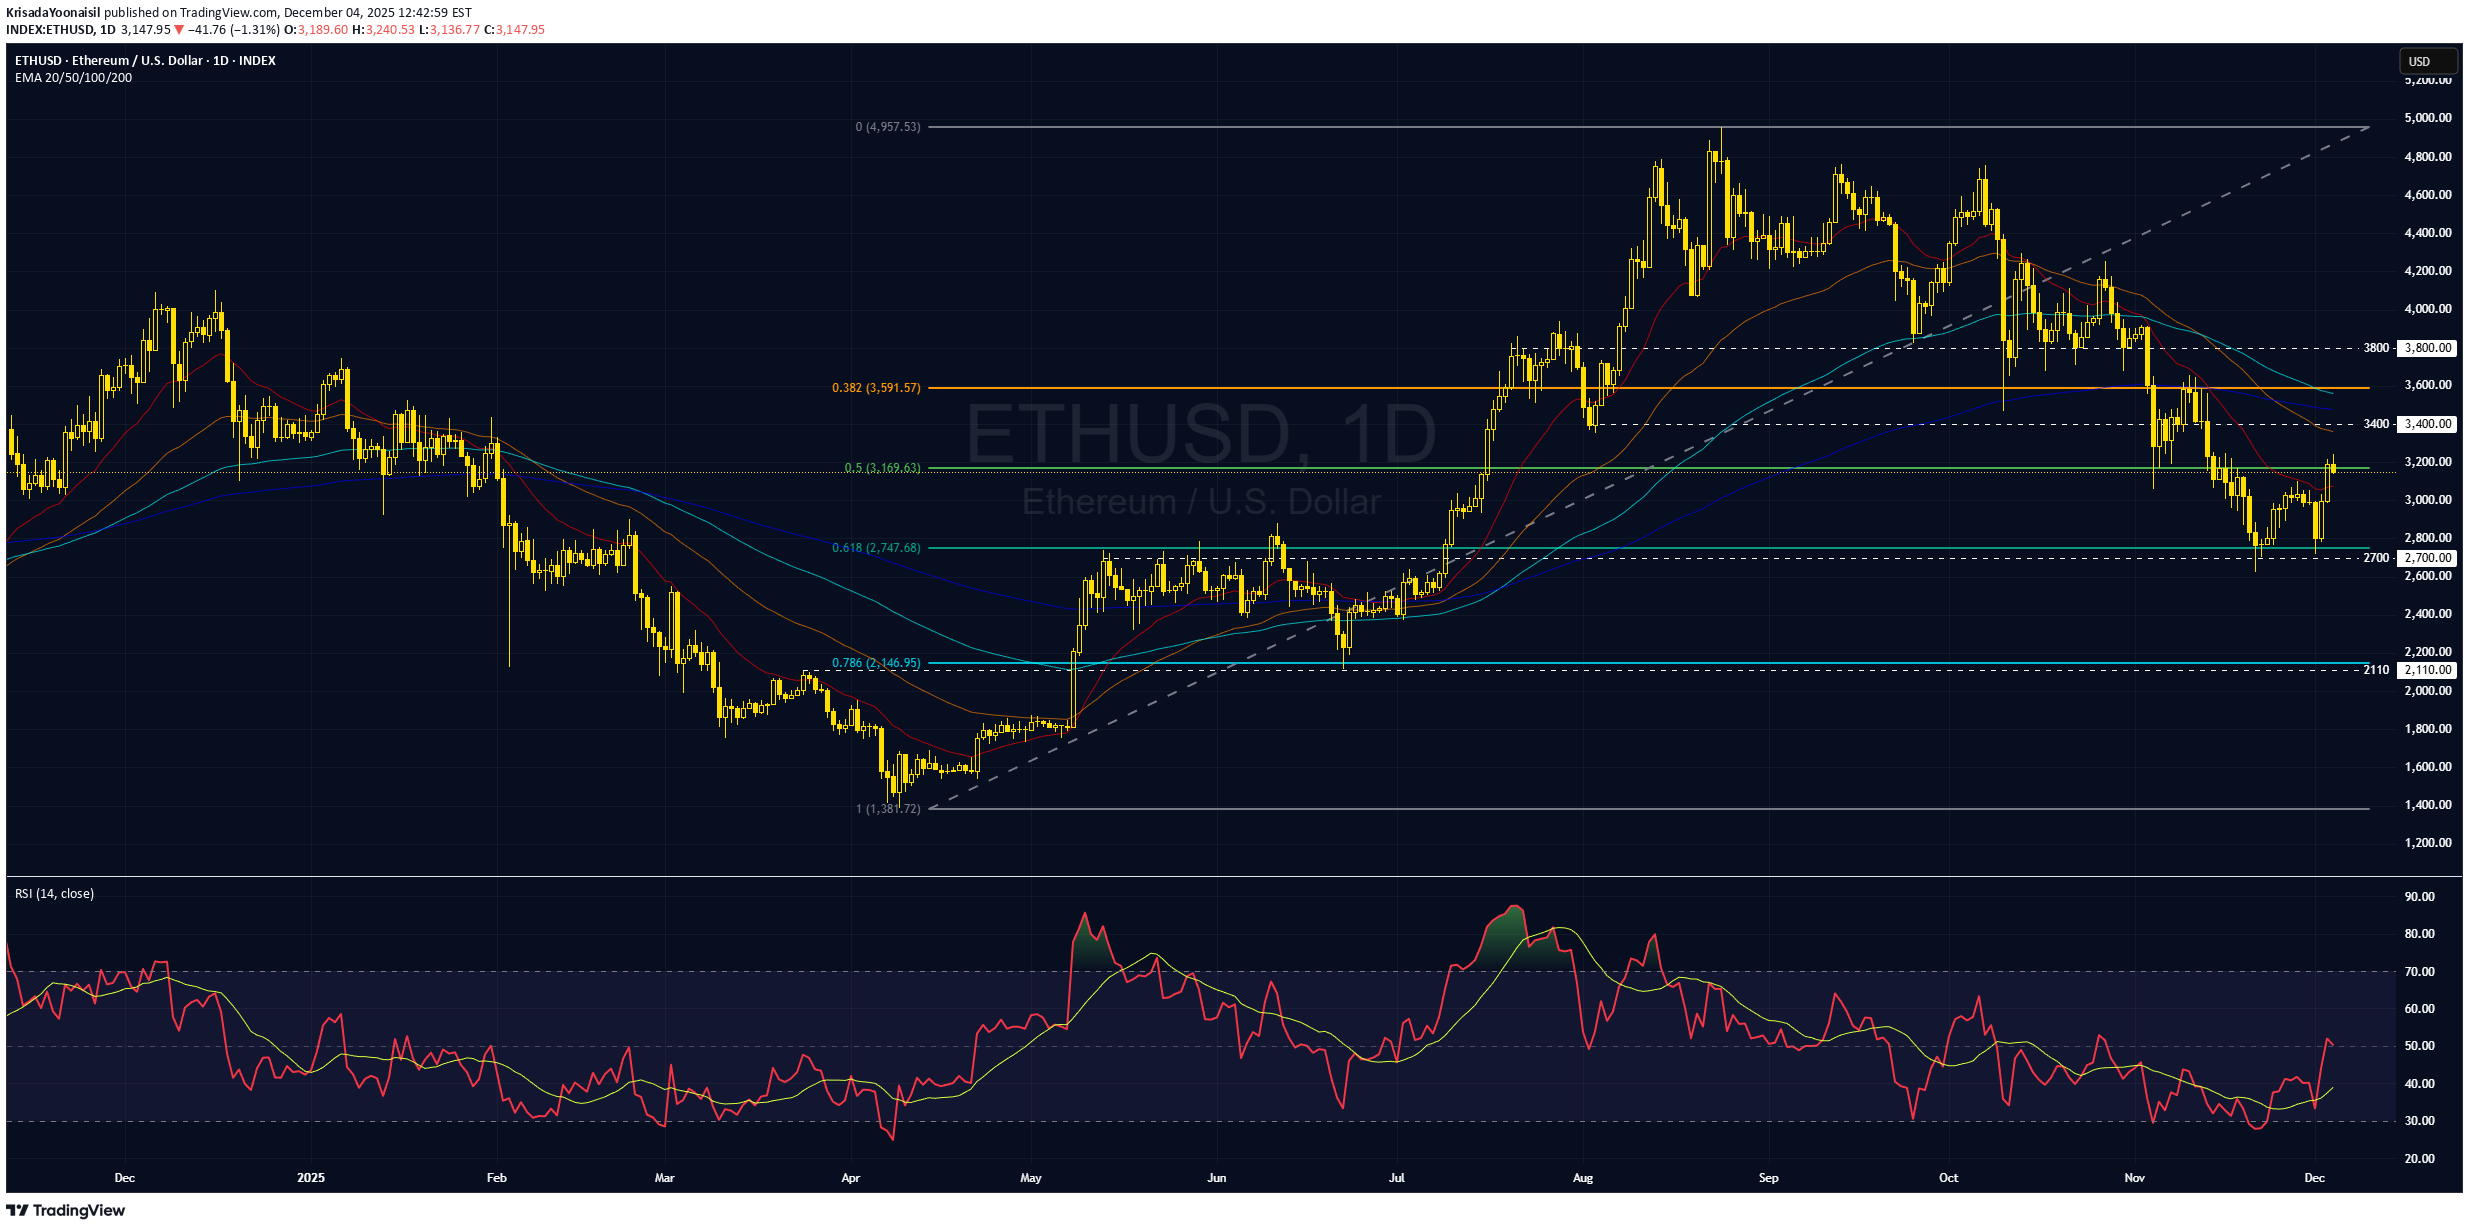
Sentiment-driven swings as Ethereum awaits Fusaka Technical Analysis 1. After a few months of downtrend, ETHUSD rebounded significantly after finding support around the 61.8% Fibonacci retracement level near 2700. 2. Although price has formed higher swings, it is still too early to call a bullish reversal, as the bearish EMA stack continues to signal a bearish momentum, and the price has been in a downtrend for an extended period. 3. Price still has chance to pull back, a break below the support at 2700 would open the way toward the next support around 2110, near the 78.6% Fibonacci retracement. 4. Alternatively, if the downtrend has already ended, ETHUSD may consolidate sideways for a while. Fundamental Analysis 5. High leverage in the market triggers cascading liquidations during sell-offs. Leverage conditions in the derivatives market amplify short-term volatility for ETH, rather than altering the long-term trend, although this has caused severe price swings at the moment. Consequently, the current price movement is due to market sentiment rather than fundamentals. 6. Currently, the market expects a Fed rate cut, driving fund flow into risky assets, including tech stocks and crypto, which also support the price. 7. Ethereum’s next major milestone is the Fusaka Upgrade, which aims to enhance network capabilities, increase the block gas limit, and lower costs for Layer 2 solutions. This marks the second major hard fork of the year, following Pectra. Several studies suggest that major upgrades are often followed by price appreciation in the subsequent period, after short-term volatility surrounding the upgrade date. 8. Therefore, amidst this lack of significant catalysts, prices may remain volatile for some time while awaiting the next crypto cycle to drive momentum. Analysis by: Krisada Yoonaisil, Financial Markets Strategist at Exness
KrisadaYoonaisil
تحلیل تکنیکال اتریوم: جهش موقت؛ آیا روند نزولی ادامه دارد؟
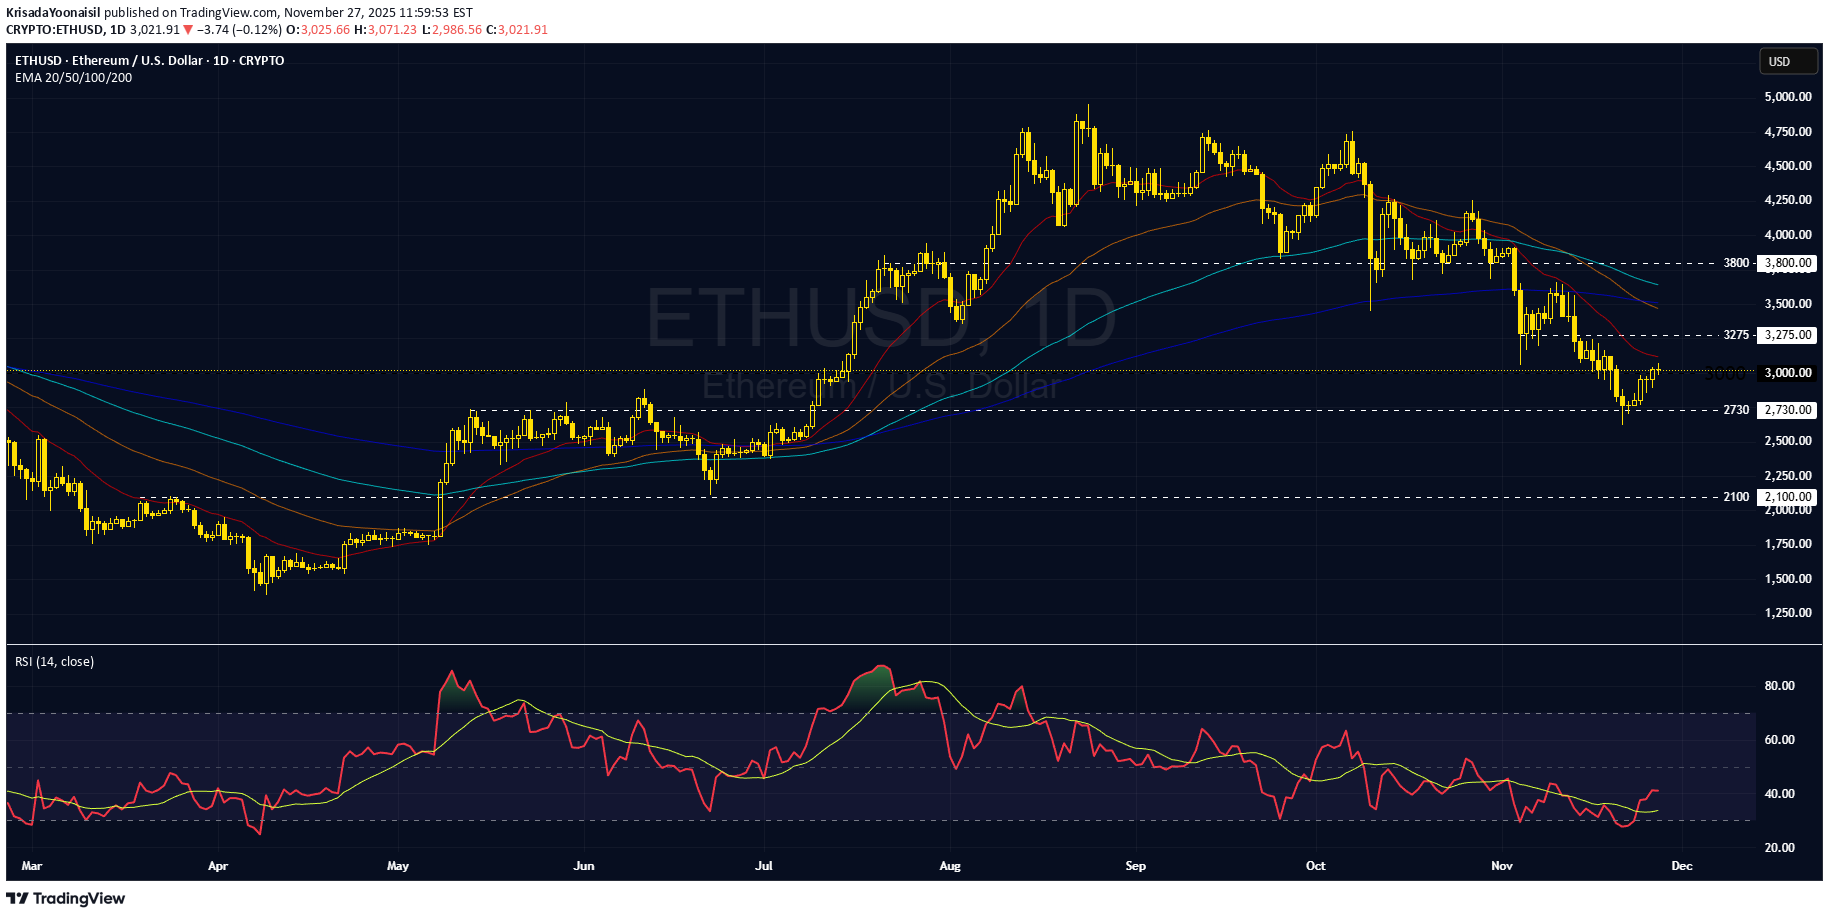
ETH Technical Analysis: Relief Bounce, But the Downtrend Remains Intact 1. ETHUSD has been forming lower swings continuously, reinforcing a dominant downtrend. Supported by a sign of bearish EMA stack to the 100 EMA, signalling a broader corrective phase with strong bearish momentum. 2. There are still no bullish reversal signals yet, suggesting that any rebound is likely to be a short-term relief rally, forming a lower high before the downtrend resumes. 3. Initial resistance is seen near 3,275, where former support and the EMA20 may act as a supply zone before another leg lower. 4. If ETHUSD breaks below support at 2,730, it could unlock further downside toward the next key support around 2,100. Analysis by: Krisada Yoonaisil, Financial Markets Strategist at Exness
KrisadaYoonaisil
احتمال جهش بیت کوین وجود دارد، اما منتظر صعود بزرگ نباشید!
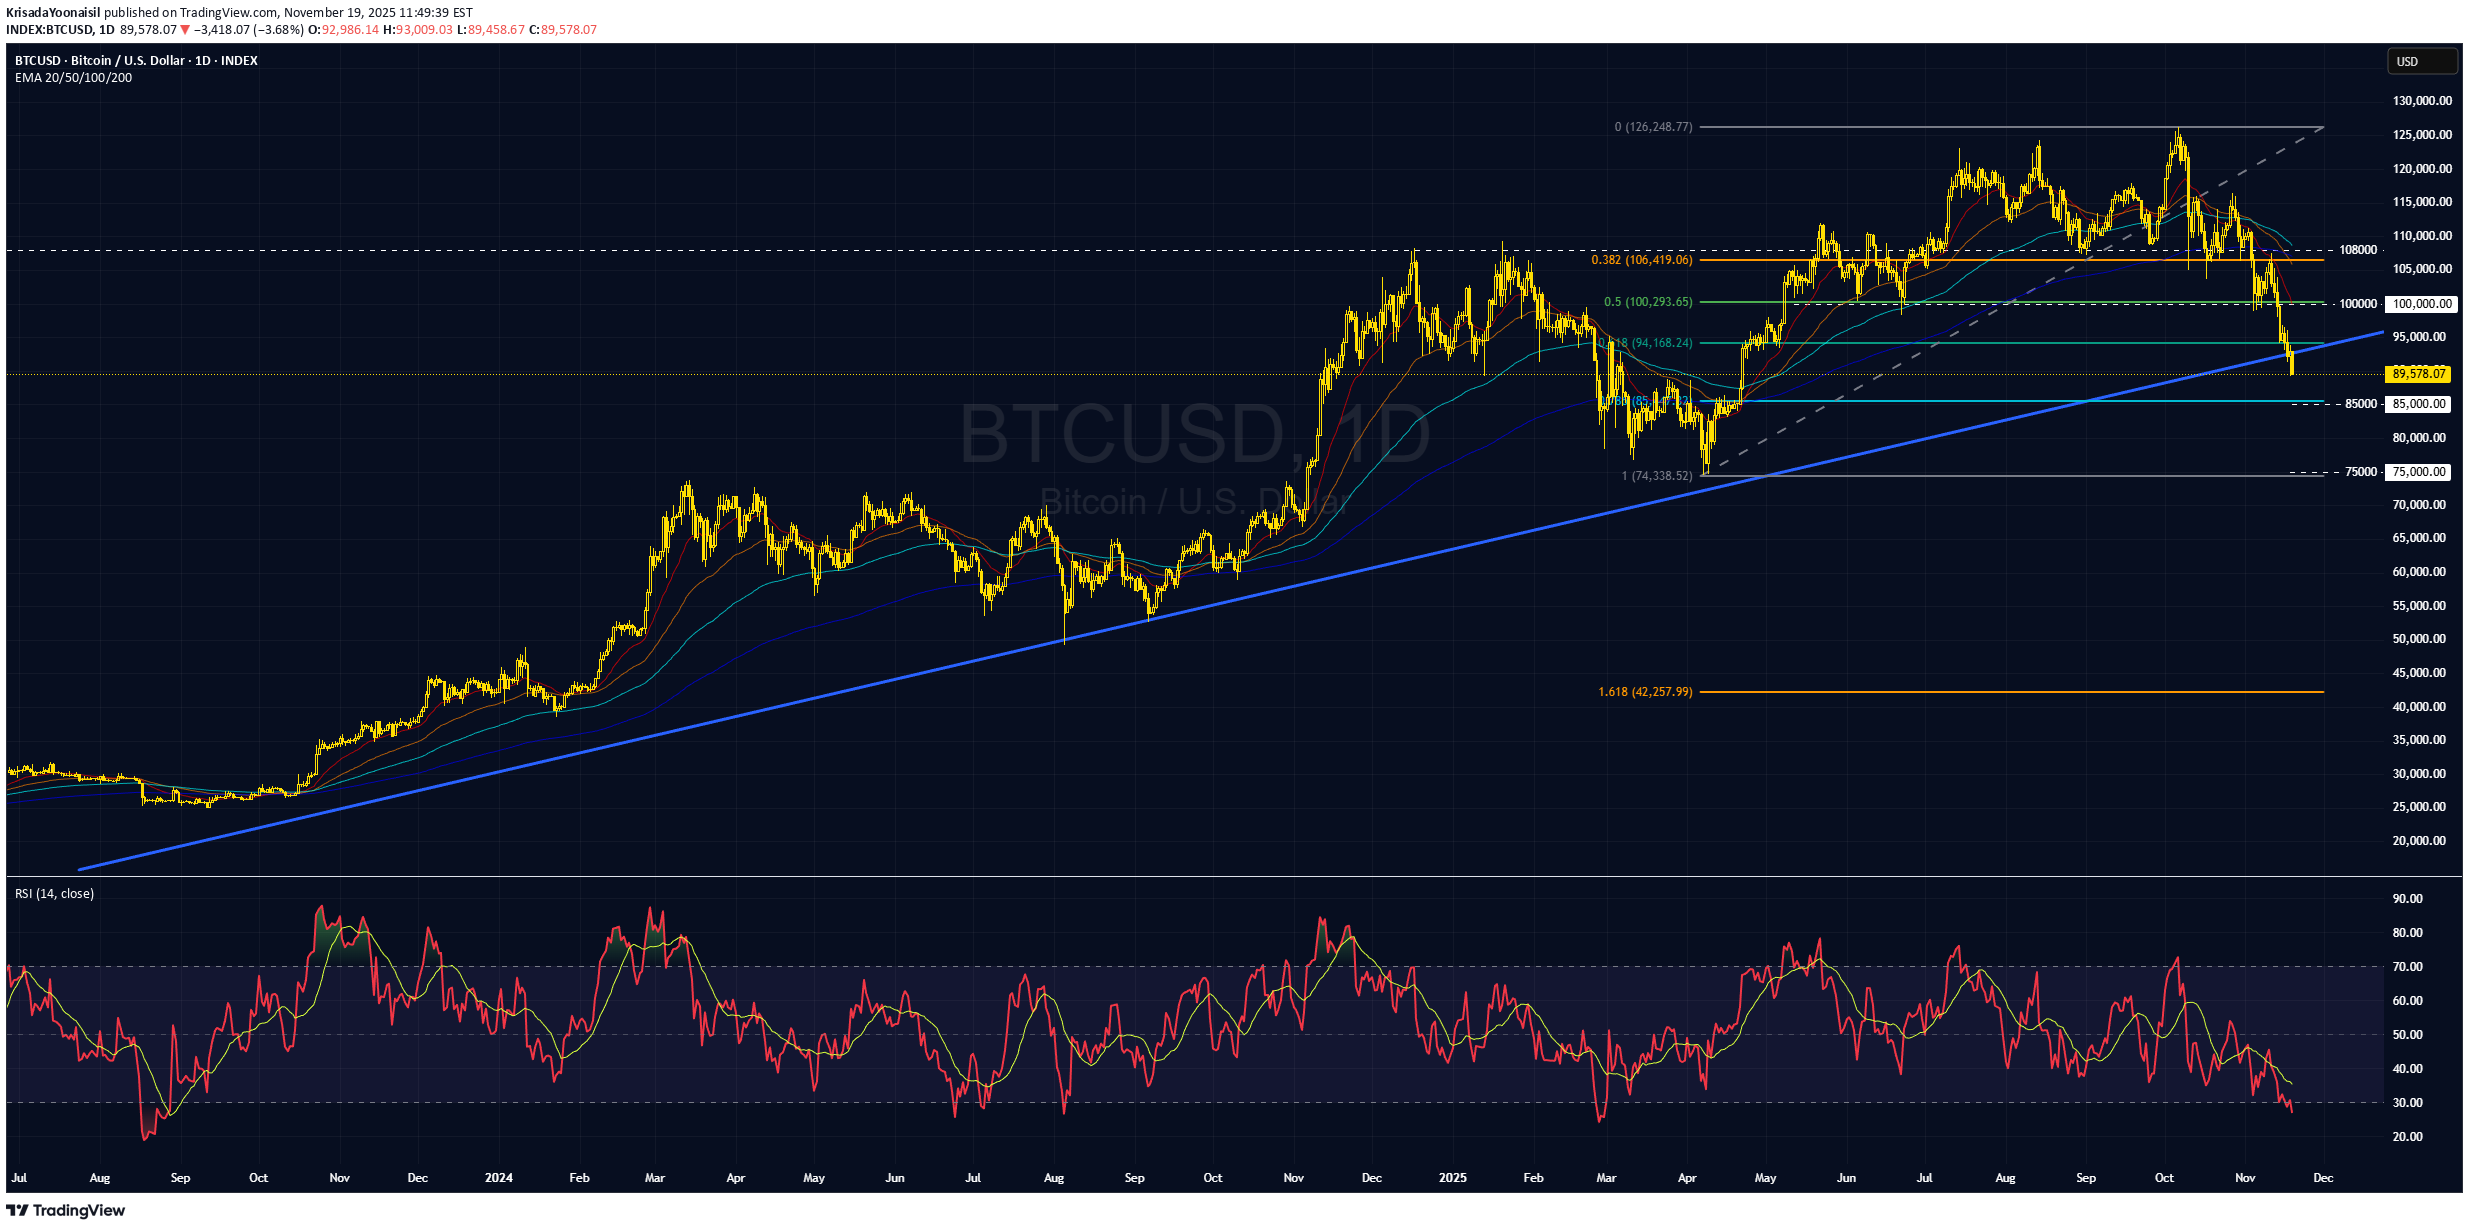
BTCUSD may rebound, but a bullish reversal is not expected yet. BTCUSD has broken below the two-year uptrend line support, signaling a major corrective phase that could last for several months. The current decline is steep and sharp, indicating strong bearish momentum, so we should not expect the downtrend to end anytime soon. However, because the price has fallen aggressively and is now distant from the EMAs, a mean reversion rebound toward the EMAs around the 100,000 level is possible, especially as RSI has entered the oversold zone. A potential support zone where a rebound could be triggered is around the 78.6% Fibonacci retracement, near the 85,000 ± 1,500 area. Even if a rebound occurs, it should not yet be a bullish reversal, as there are still no clear bullish reversal signals at this stage. Analysis by: Krisada Yoonaisil, Financial Markets Strategist at Exness
KrisadaYoonaisil
طلا (XAUUSD): آیا این فقط یک جهش است؟ مراقب بازگشت ناگهانی باشید!
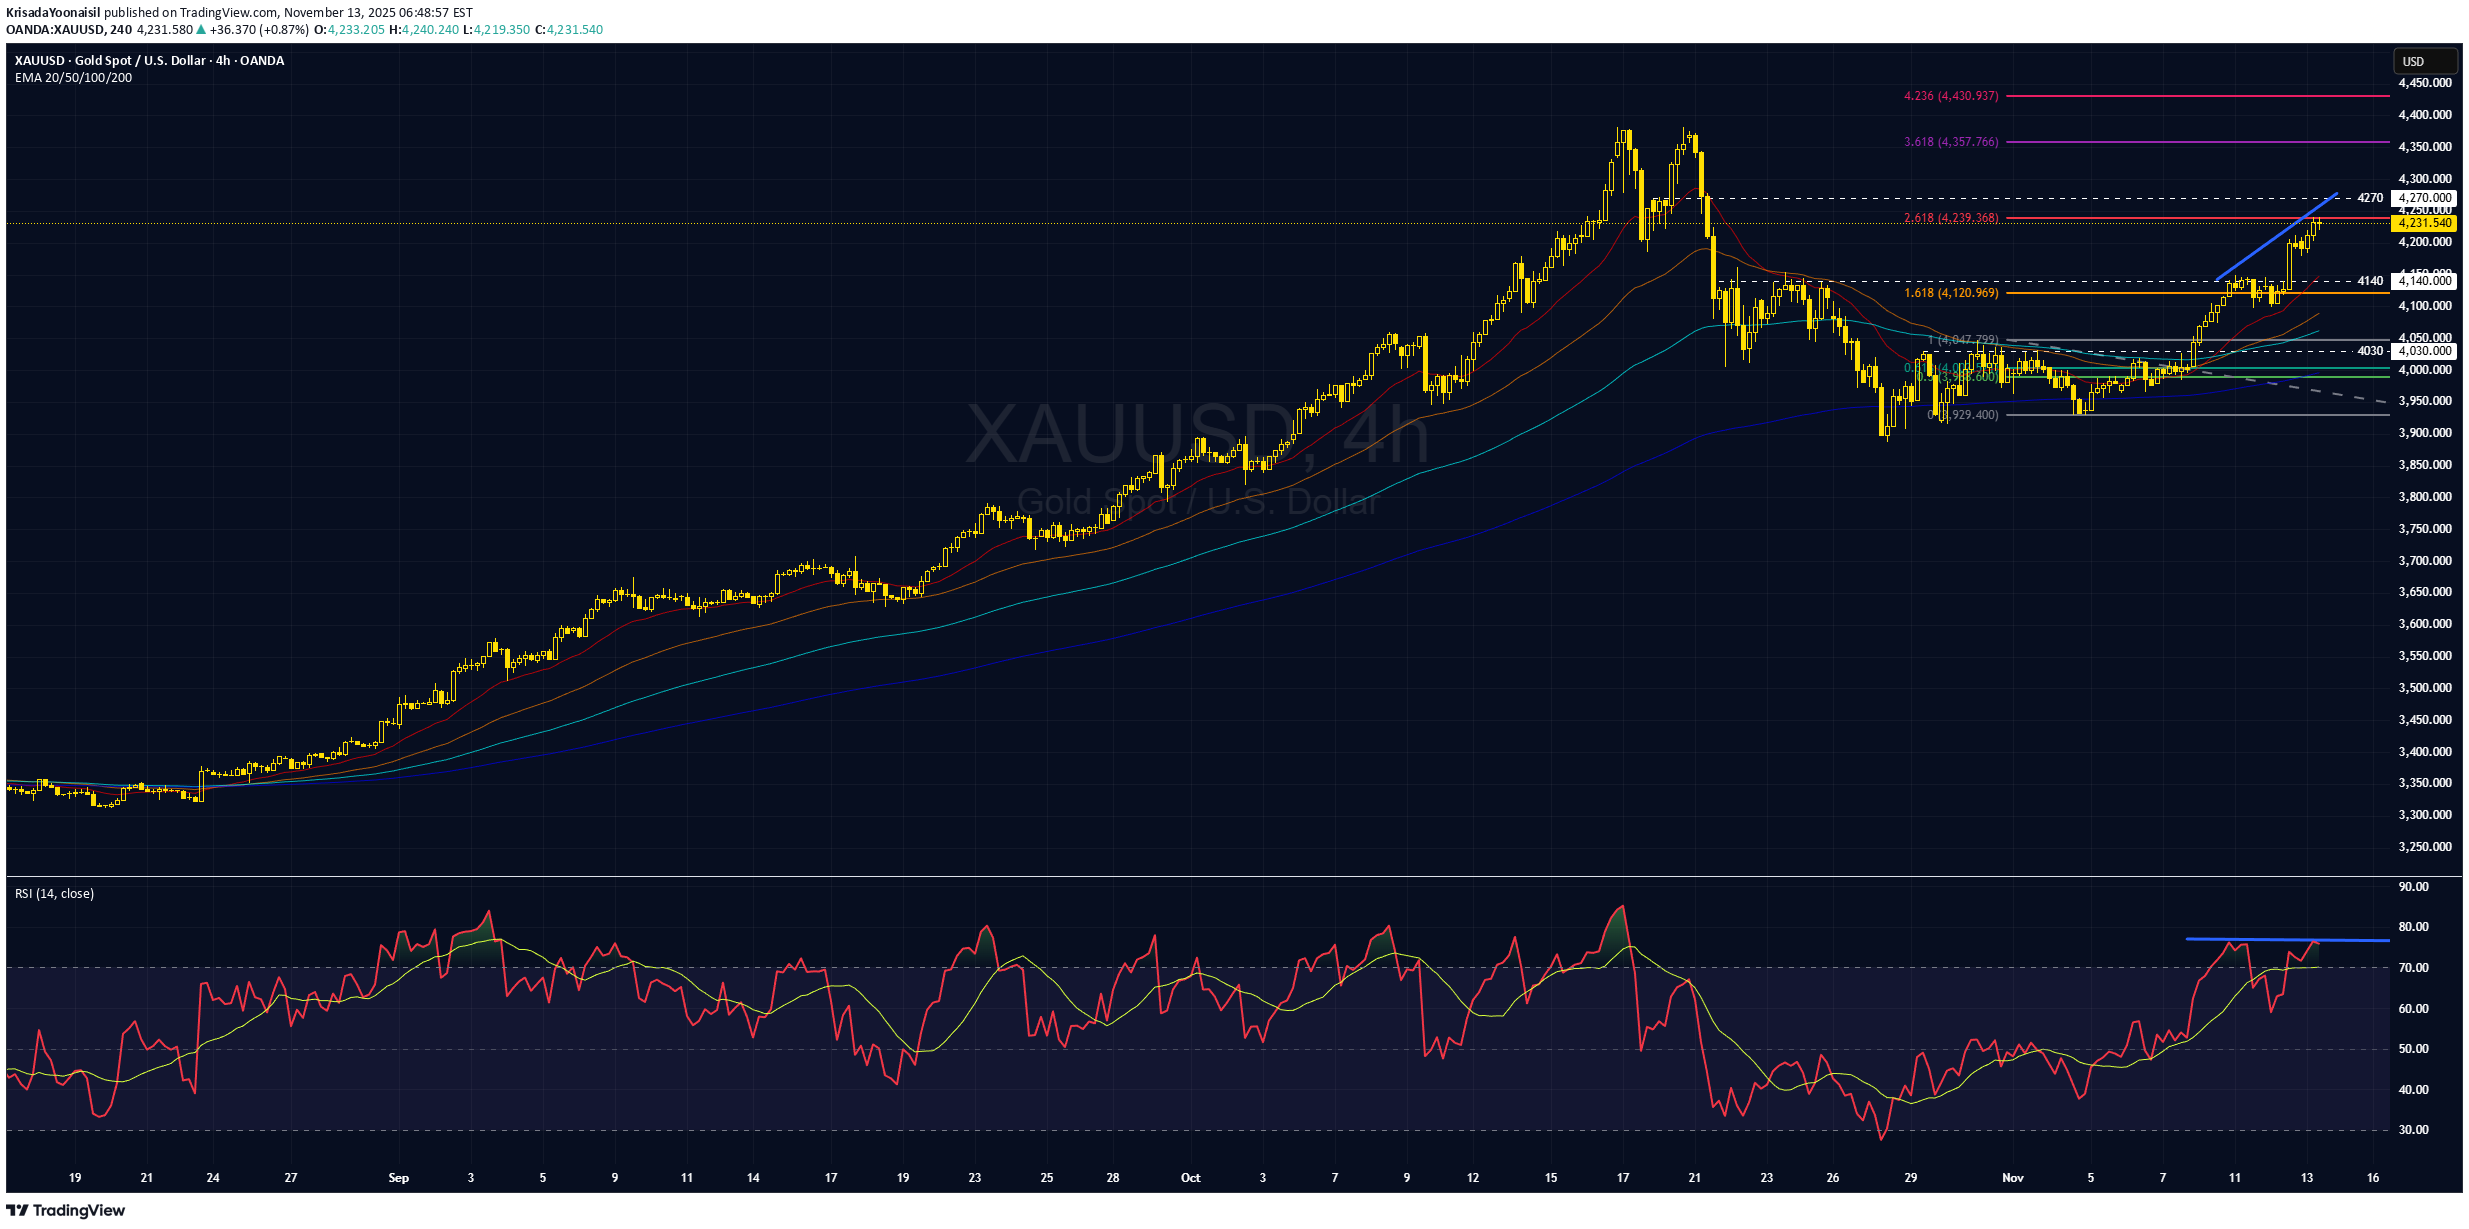
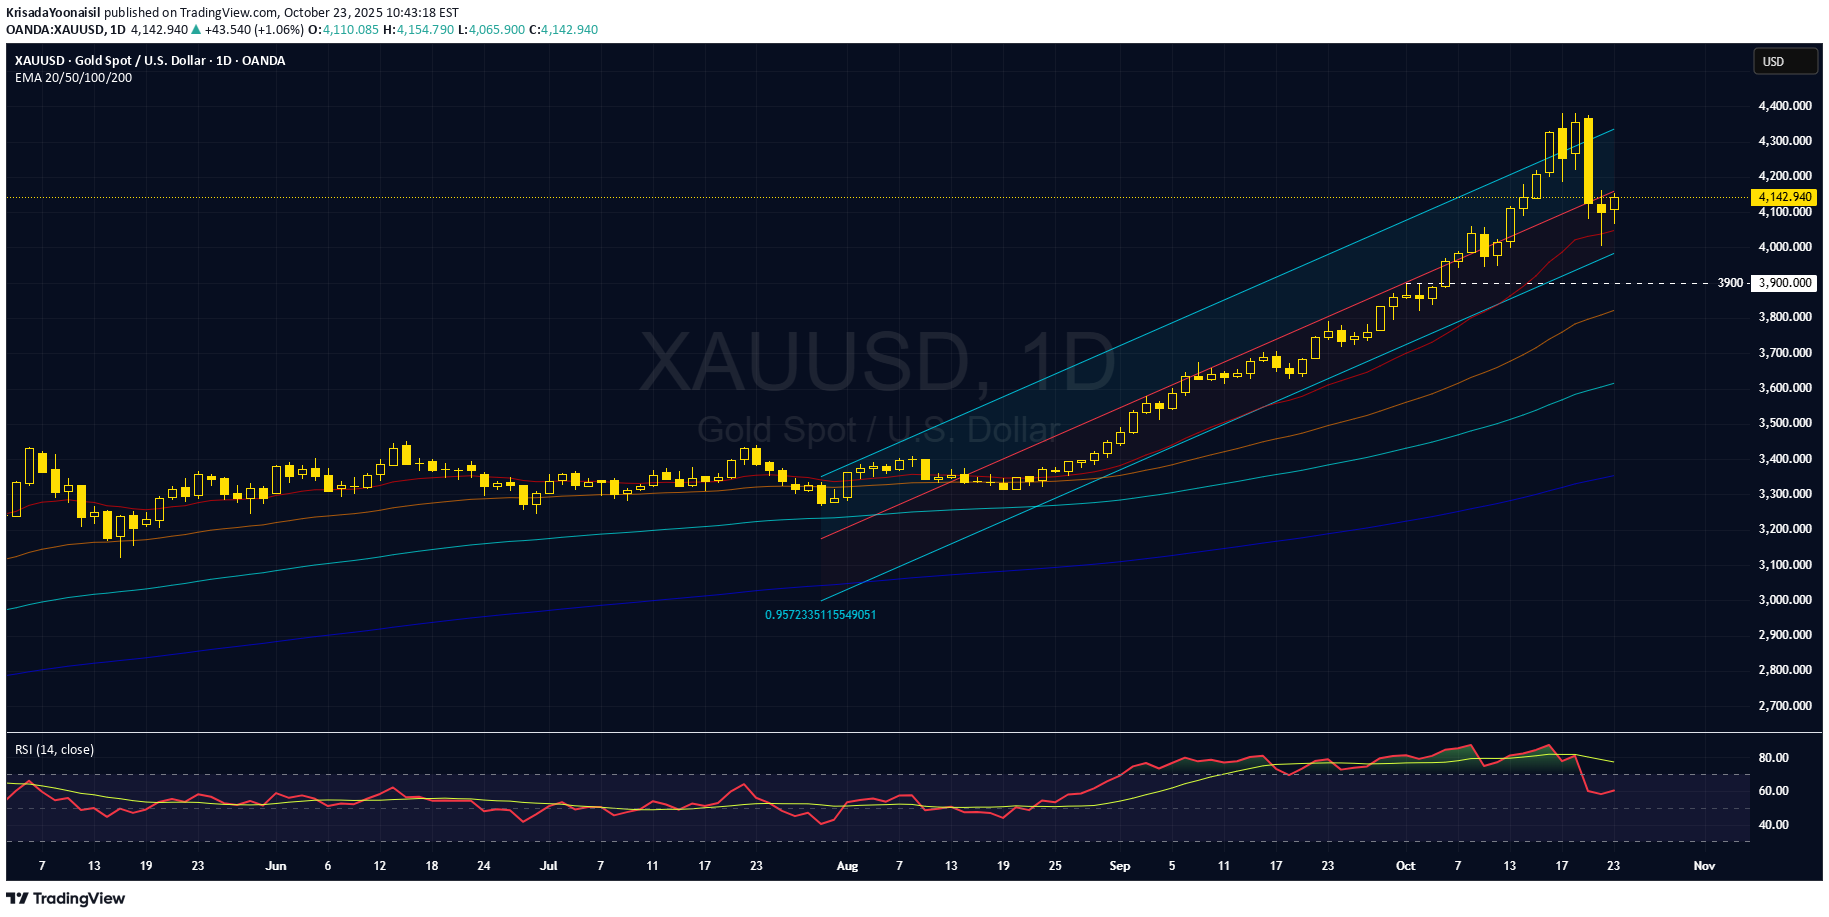
Not an uptrend yet for gold (XAUUSD)—just a rebound; be careful of a sharp reversal. Technical Analysis 1. XAUUSD rebounded to the 161.8% Fibonacci retracement around 4240, stalled, and has started to pull back. A bullish divergence between price and RSI has set, indicating the potential of a bearish reversal. 2. If XAUUSD falls below 4140, it would confirm the end of the rebound and could plunge lower to 4030, or even retest the prior low around 3900. 3. However, if the support at 4140 holds, the price may further spike to retest 4270 resistance before choosing the next direction. Fundamental Analysis 4. US government reopening allows economic data to be released, clarifying the economic outlook, and reduces uncertainty, which may diminish demand for safe-haven assets. 5. However, if upcoming data point to a weaker labor market, expectations for Fed rate cuts would increase and support gold. 6. Meanwhile, CME FedWatch shows the market has trimmed the probability of a 0.25% cut in December to 49.9%, down from 62.9% yesterday. For the first time, markets now assign a slightly higher probability to a hold (50.1%) , which will pressure the gold price once traders internalize this shift. Analysis by: Krisada Yoonaisil, Financial Markets Strategist at Exness
KrisadaYoonaisil
کف بیت کوین کجاست؟ آیا سقوط تمام شده یا منتظر ریزش بیشتر باشیم؟
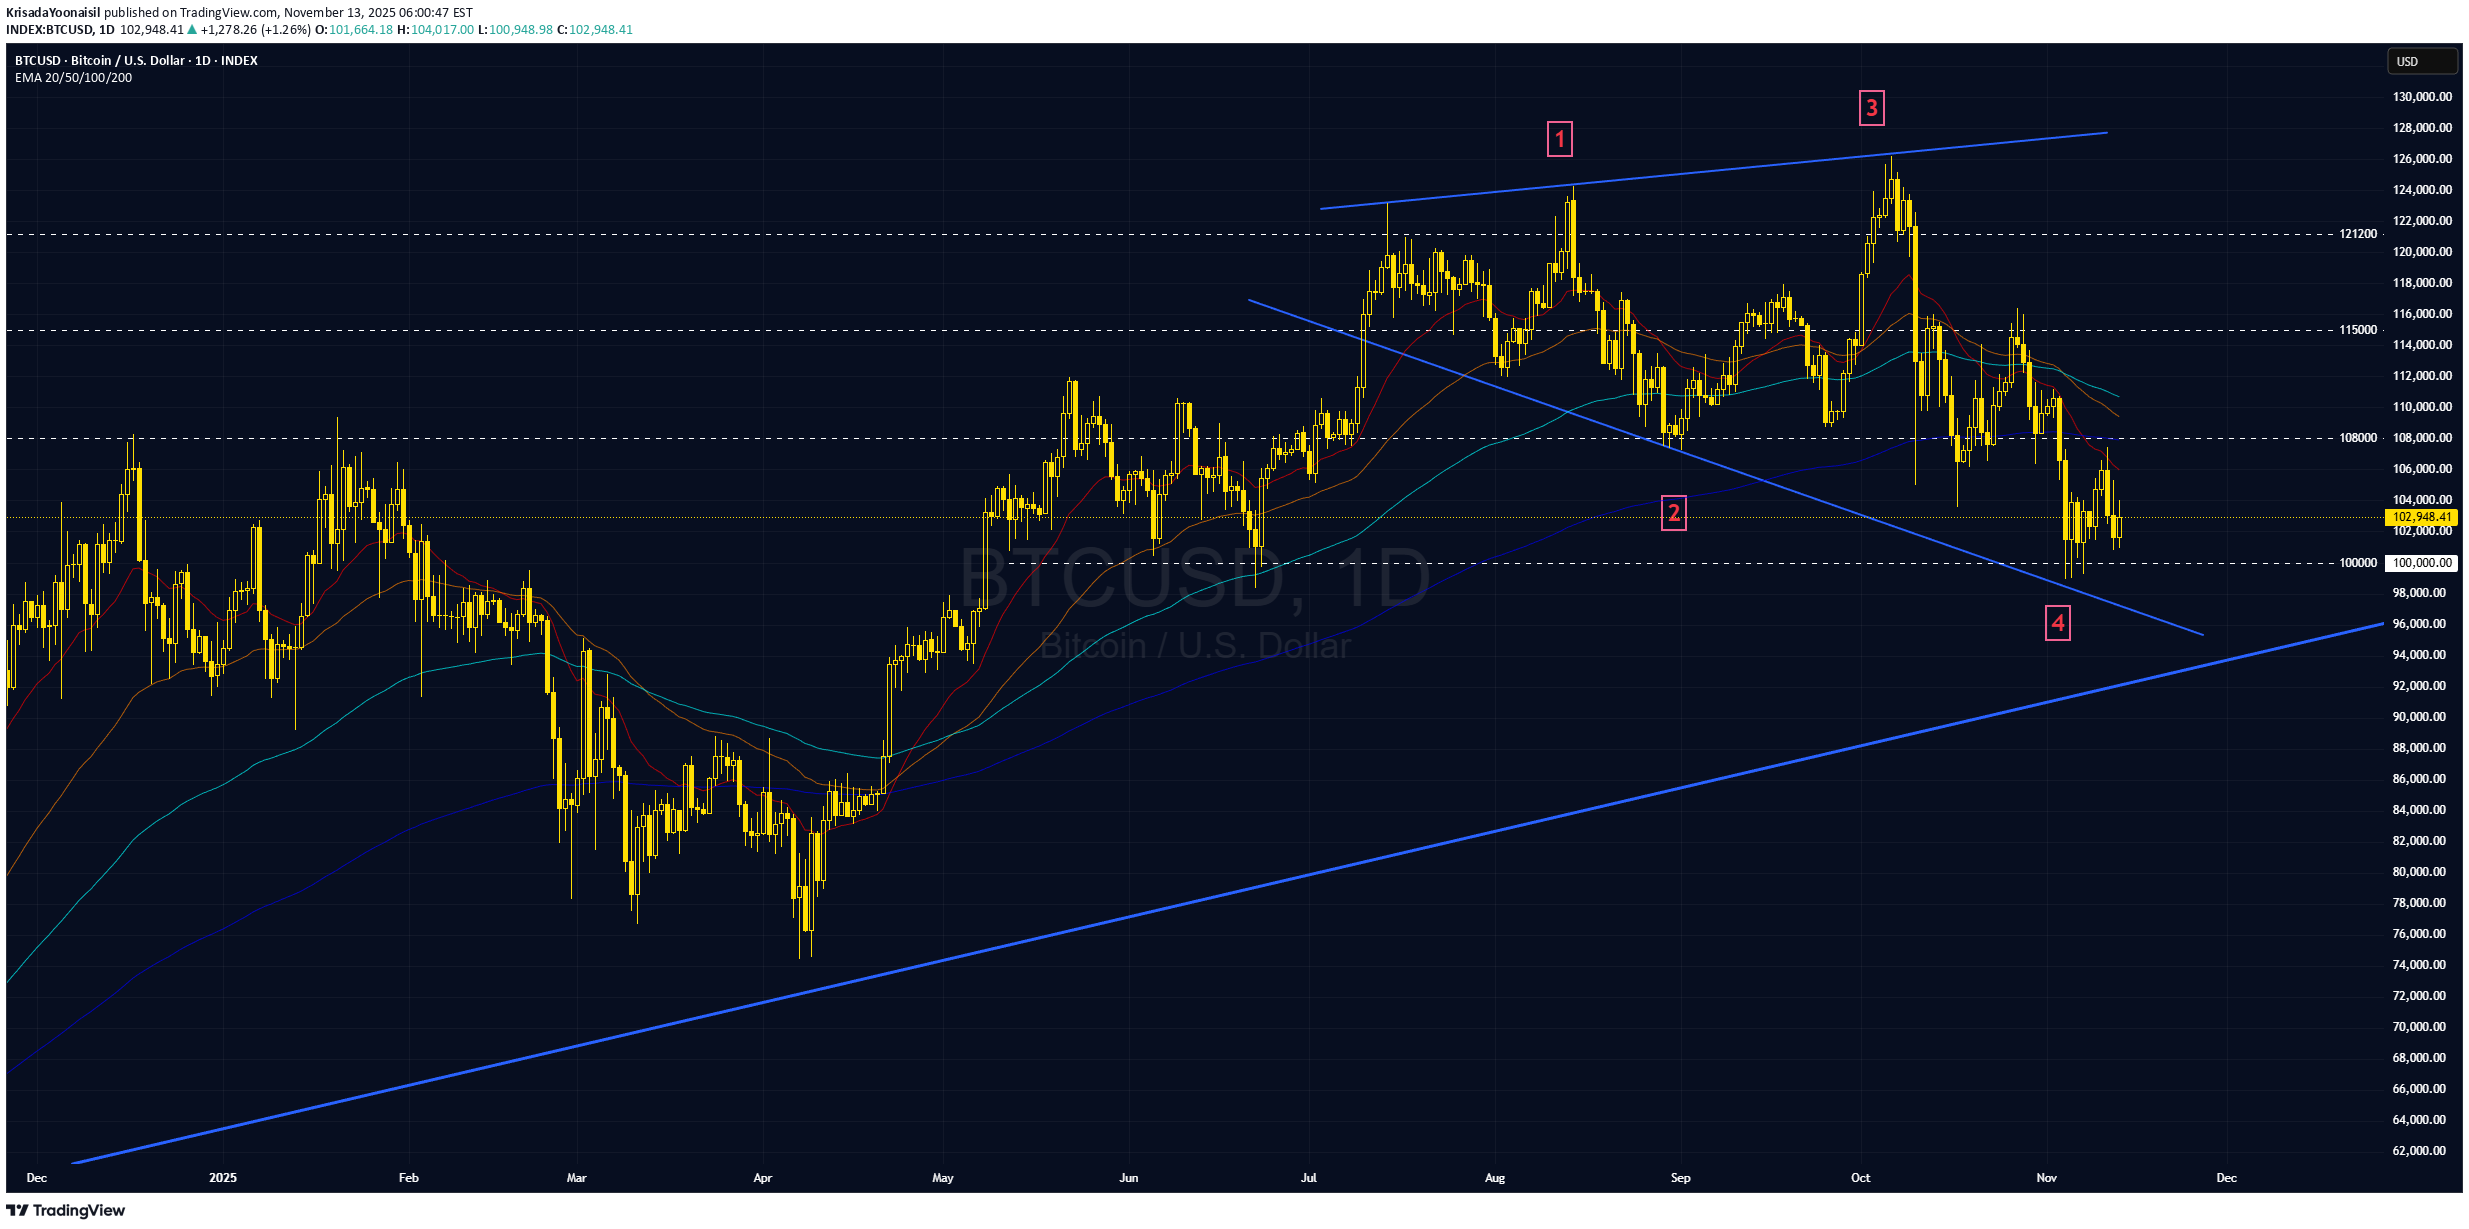
Has Bitcoin found a bottom? Is the selloff over? Technical Analysis 1. On the big picture, BTCUSD appears to be in a corrective wave forming a Broadening Triangle (Megaphone) —a continuation pattern. Thus, unless price decisively breaks below this structure, the longer-term uptrend can still resume. 2. In the near term, multi-period EMAs signal a downtrend and fanning out, indicating strengthening bearish momentum in the short term, so it may form lower low. 3. Given $100,000 is a key psychological support, even if price seems to hold above this level, a brief liquidity sweep below the zone could occur before an actual trend reversal. 4. If BTCUSD rises above the last swing high at 108000, it may confirm a trend reversal. Fundamental Analysis 5. On ETF flows data (Farside.com): two weeks ago showed net sell $799mn; last week net sell $1,208mn; so far this week (first three days) net buy $247mn —suggesting easing selling pressure. 6. On-chain data from Glassnode shows Balance on Exchanges at a six-year low, pointing to increased long-term holding. The Fear & Greed Index currently indicates Fear, a contrarian opinion signal that the market may be oversold. 7. A sharp plummet like in past cycles now seems less likely , as digital assets enjoy broader acceptance among traditional investors. This institutional participation and corporate treasuries’ crypto holdings help absorb panic selling, supporting the view that Bitcoin’s four-year cycle dynamics have faded—making a steep, crash-like drop less probable. Analysis by: Krisada Yoonaisil, Financial Markets Strategist at Exness
KrisadaYoonaisil
هشدار: آیا این جهش بازار فقط یک تله گاوی فریبنده است؟
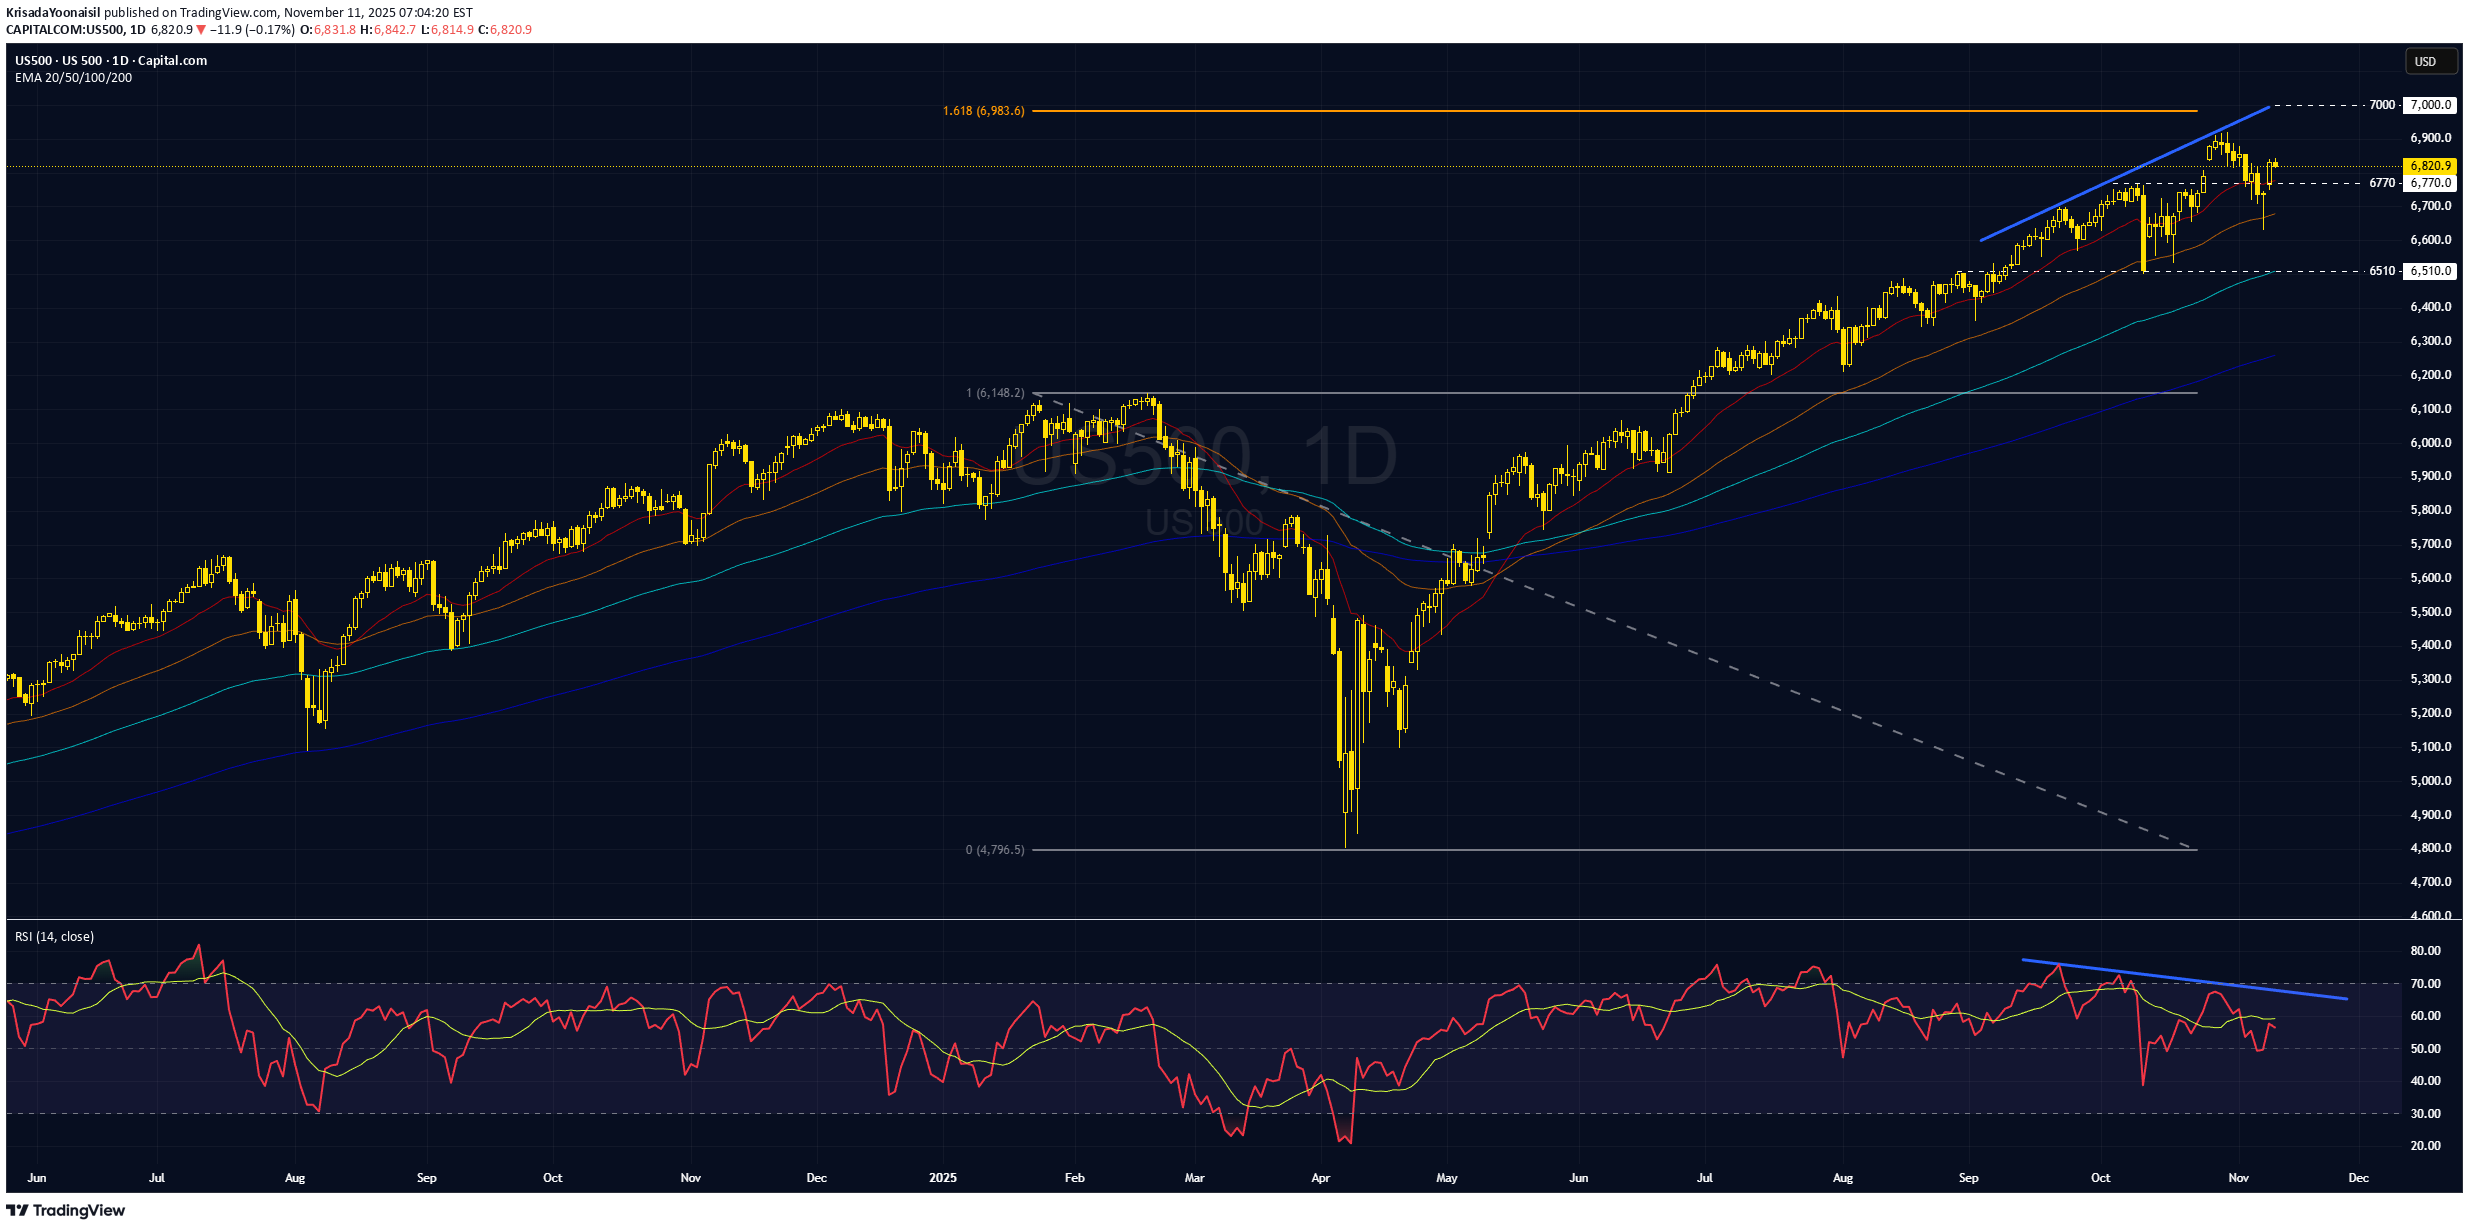
Watch out—the current rebound could be a bull trap. Technical analysis 1. US500 rebounded from the EMA50, with the price forming higher swings, and the multi-period EMAs signal an uptrend. 2. However, price has formed Bearish Divergence with RSI twice already (rarely does it occur more than three times), so this rebound may not be sustainable. 3. In terms of Elliott Wave, this rally might be the final sub-wave before a major correction—potentially an Ending Diagonal, which tends to be a ZigZag structure and often finishes with a throw-over before reversing. 4. If the index holds above 6770 and can make a new high, the upside may be limited, with resistance at the ascending trendline around 7000—near the 161.8% Fibonacci retracement—before a significant pullback begins. 5. Alternatively, if US500 fails to make a new high, it may correct toward 6510 as the first support. Fundamental Analysis 6. S&P 500 valuations look extended, trading around 28–30x P/E versus a 17–25x long-run average range, while P/S near ~3.3–3.4x sits close to record highs—both materially above historical norms. 7. Inflation remains above target as core CPI is ~3% and sticky, leading to expectations that the Fed may not cut interest rates that much, which might not support risk assets as initially anticipated. 8. Berkshire Hathaway's record cash holdings reflect Warren Buffett's increased caution. He views the current market as expensive or uncertain, thus pausing major investments. This stance aligns with the Buffett Indicator surging to 217%-223%, a level he previously warned was "playing with fire," implying the market is significantly overvalued relative to the economy. Analysis by: Krisada Yoonaisil, Financial Markets Strategist at Exness
KrisadaYoonaisil
سهام اپل (AAPL): آیا صعود ادامه دارد؟ ریسک ارزشگذاری بالا میارزد؟
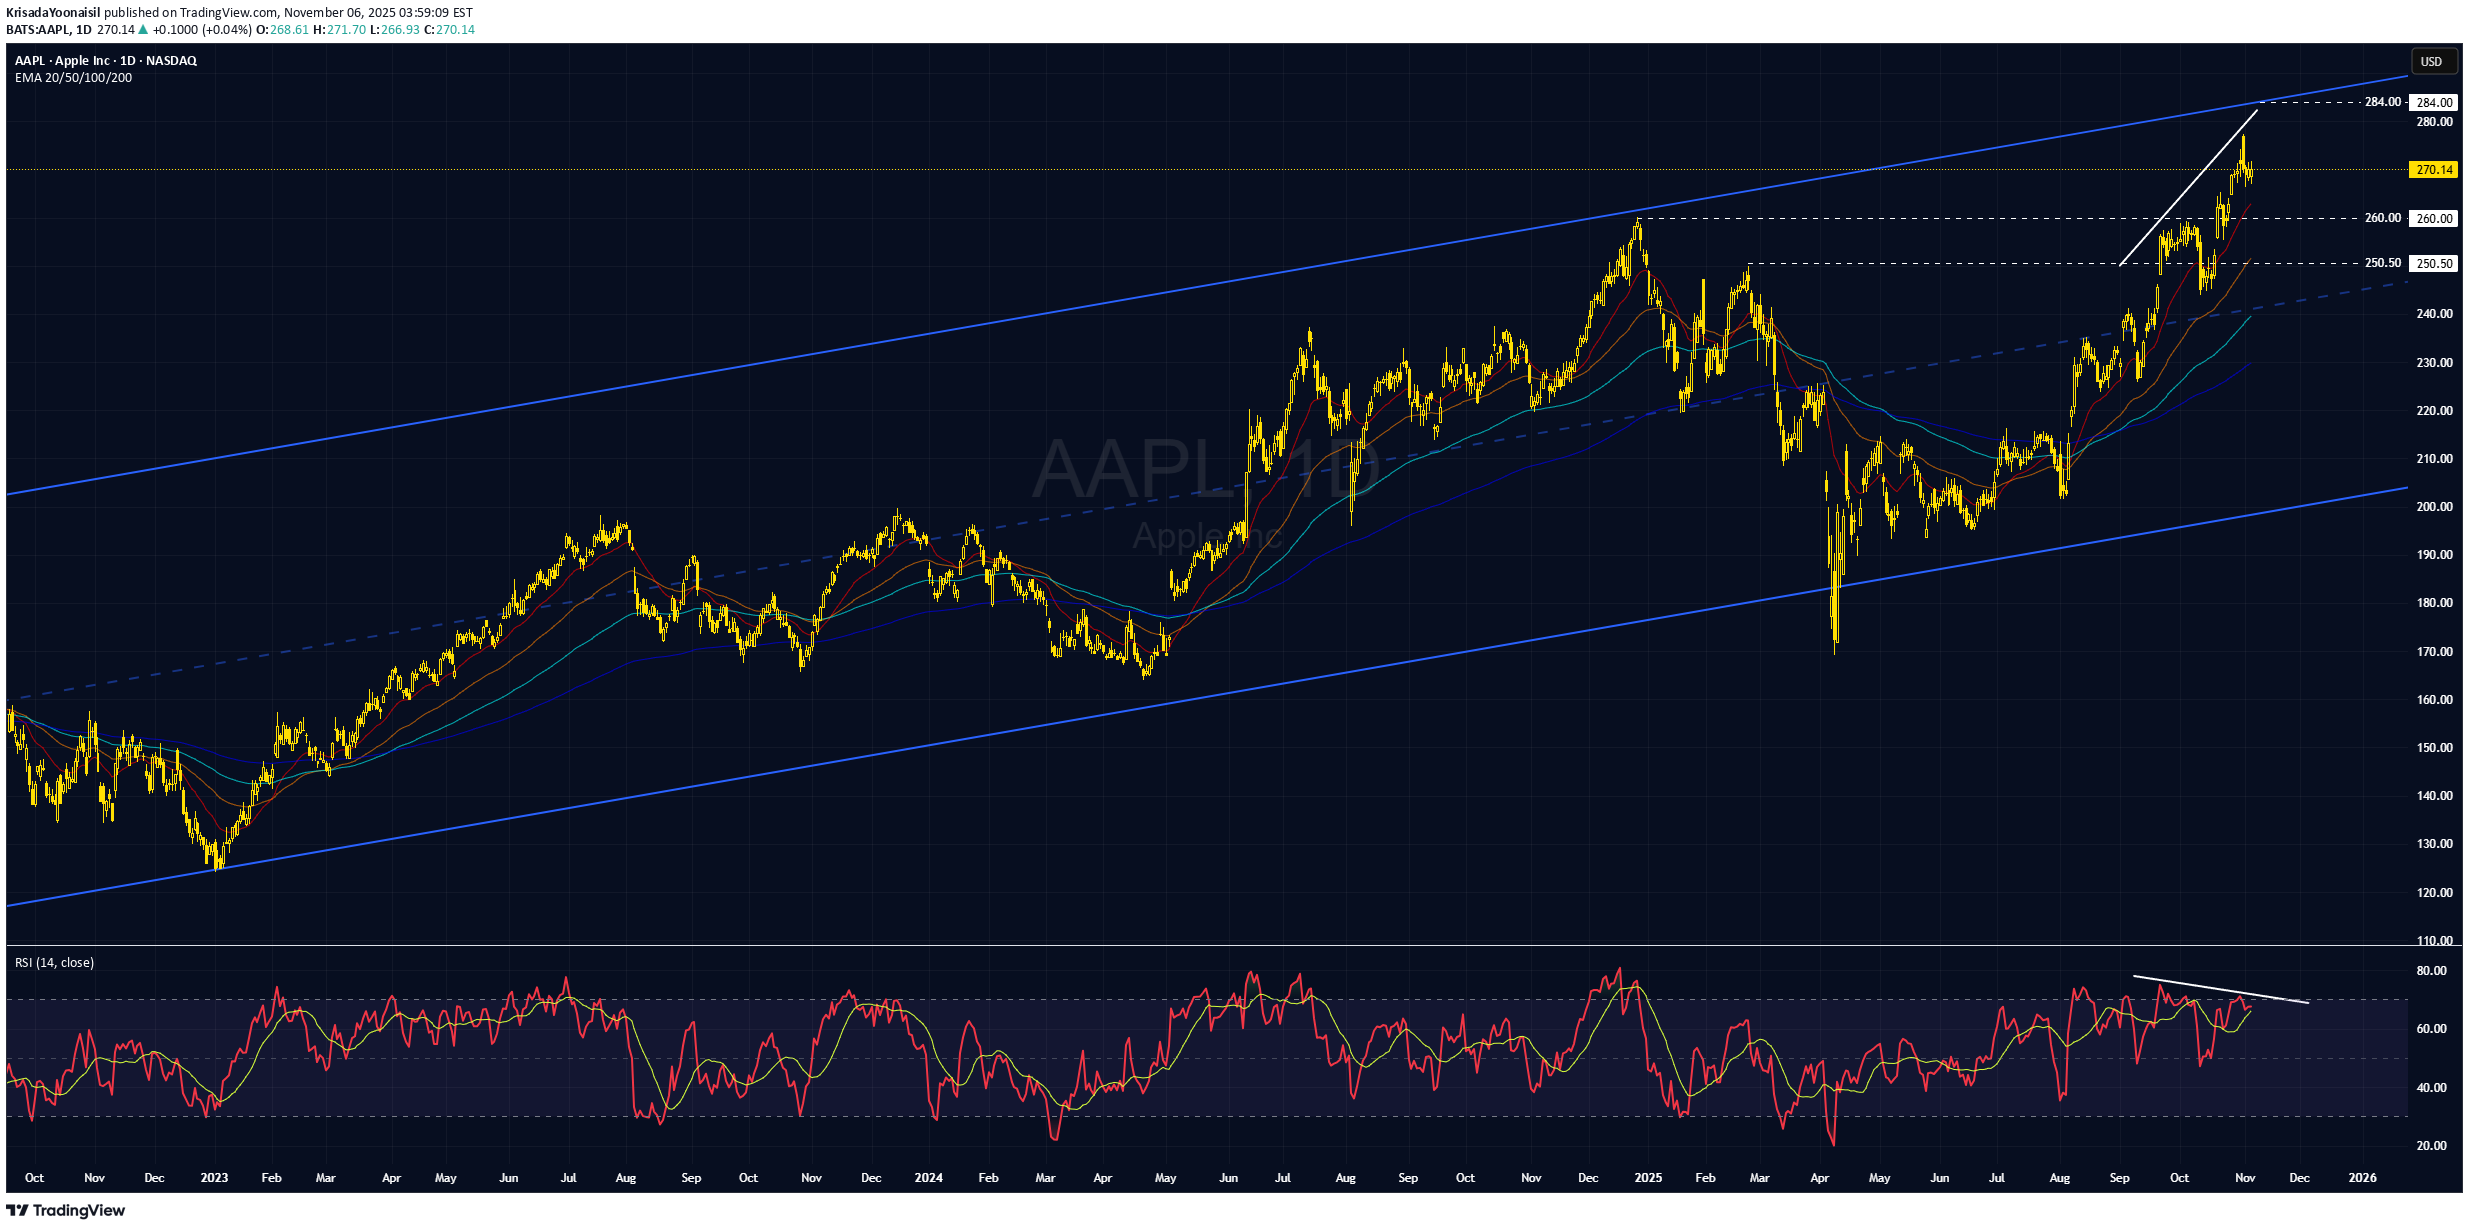
AAPL: Uptrend intact, but rich valuation—Is it worth the risk? Technical Analysis 1. AAPL is climbing within an ascending channel, forming series of higher swings with diverging multi-period EMAs, signaling a strong uptrend. 2. However, as price approaches the channel’s upper boundary, a pullback is possible, especially with a Bearish Divergence signal between the price and RSI. Any further upside may be limited in the near term. 3. If AAPL extends higher, resistance sits near 284.00 at the channel top. 4. If AAPL pulls back, the first key support is the previous resistance around 260.00 which will become support. A drop below the EMA200 would signal a bearish reversal. Fundamental Analysis Based on fundamentals following the Q3 performance release, Apple has several support factors, including: 5. Apple beat in Q3 FY25, with revenue of $102.47B (+8% y/y) and EPS of $1.85 (+13% y/y), beating analyst consensus, and diluted EPS came in at $1.85 (up 13% year-over-year, and above expectations). 6. Record services revenue and a 6% YoY rise in iPhone sales powered the quarter. Guidance was upbeat, pointing to December-quarter sales of about 137.97 bln USD (+11% y/y), signaling firm demand for iPhone 17 and other products. 7. Shifting production beyond China, strong brand loyalty, and a growing services ecosystem are core long-term growth drivers, bolstering resilience against regulatory and supply-chain risks. 8. However, some analysts flagged the stock as “expensive” relative to historical valuation multiples (P/E ~36) Analysis by: Krisada Yoonaisil, Financial Markets Strategist at Exness
KrisadaYoonaisil
طلا تحت فشار: آیا کاهش نرخ بهره در دسامبر منتفی شد؟
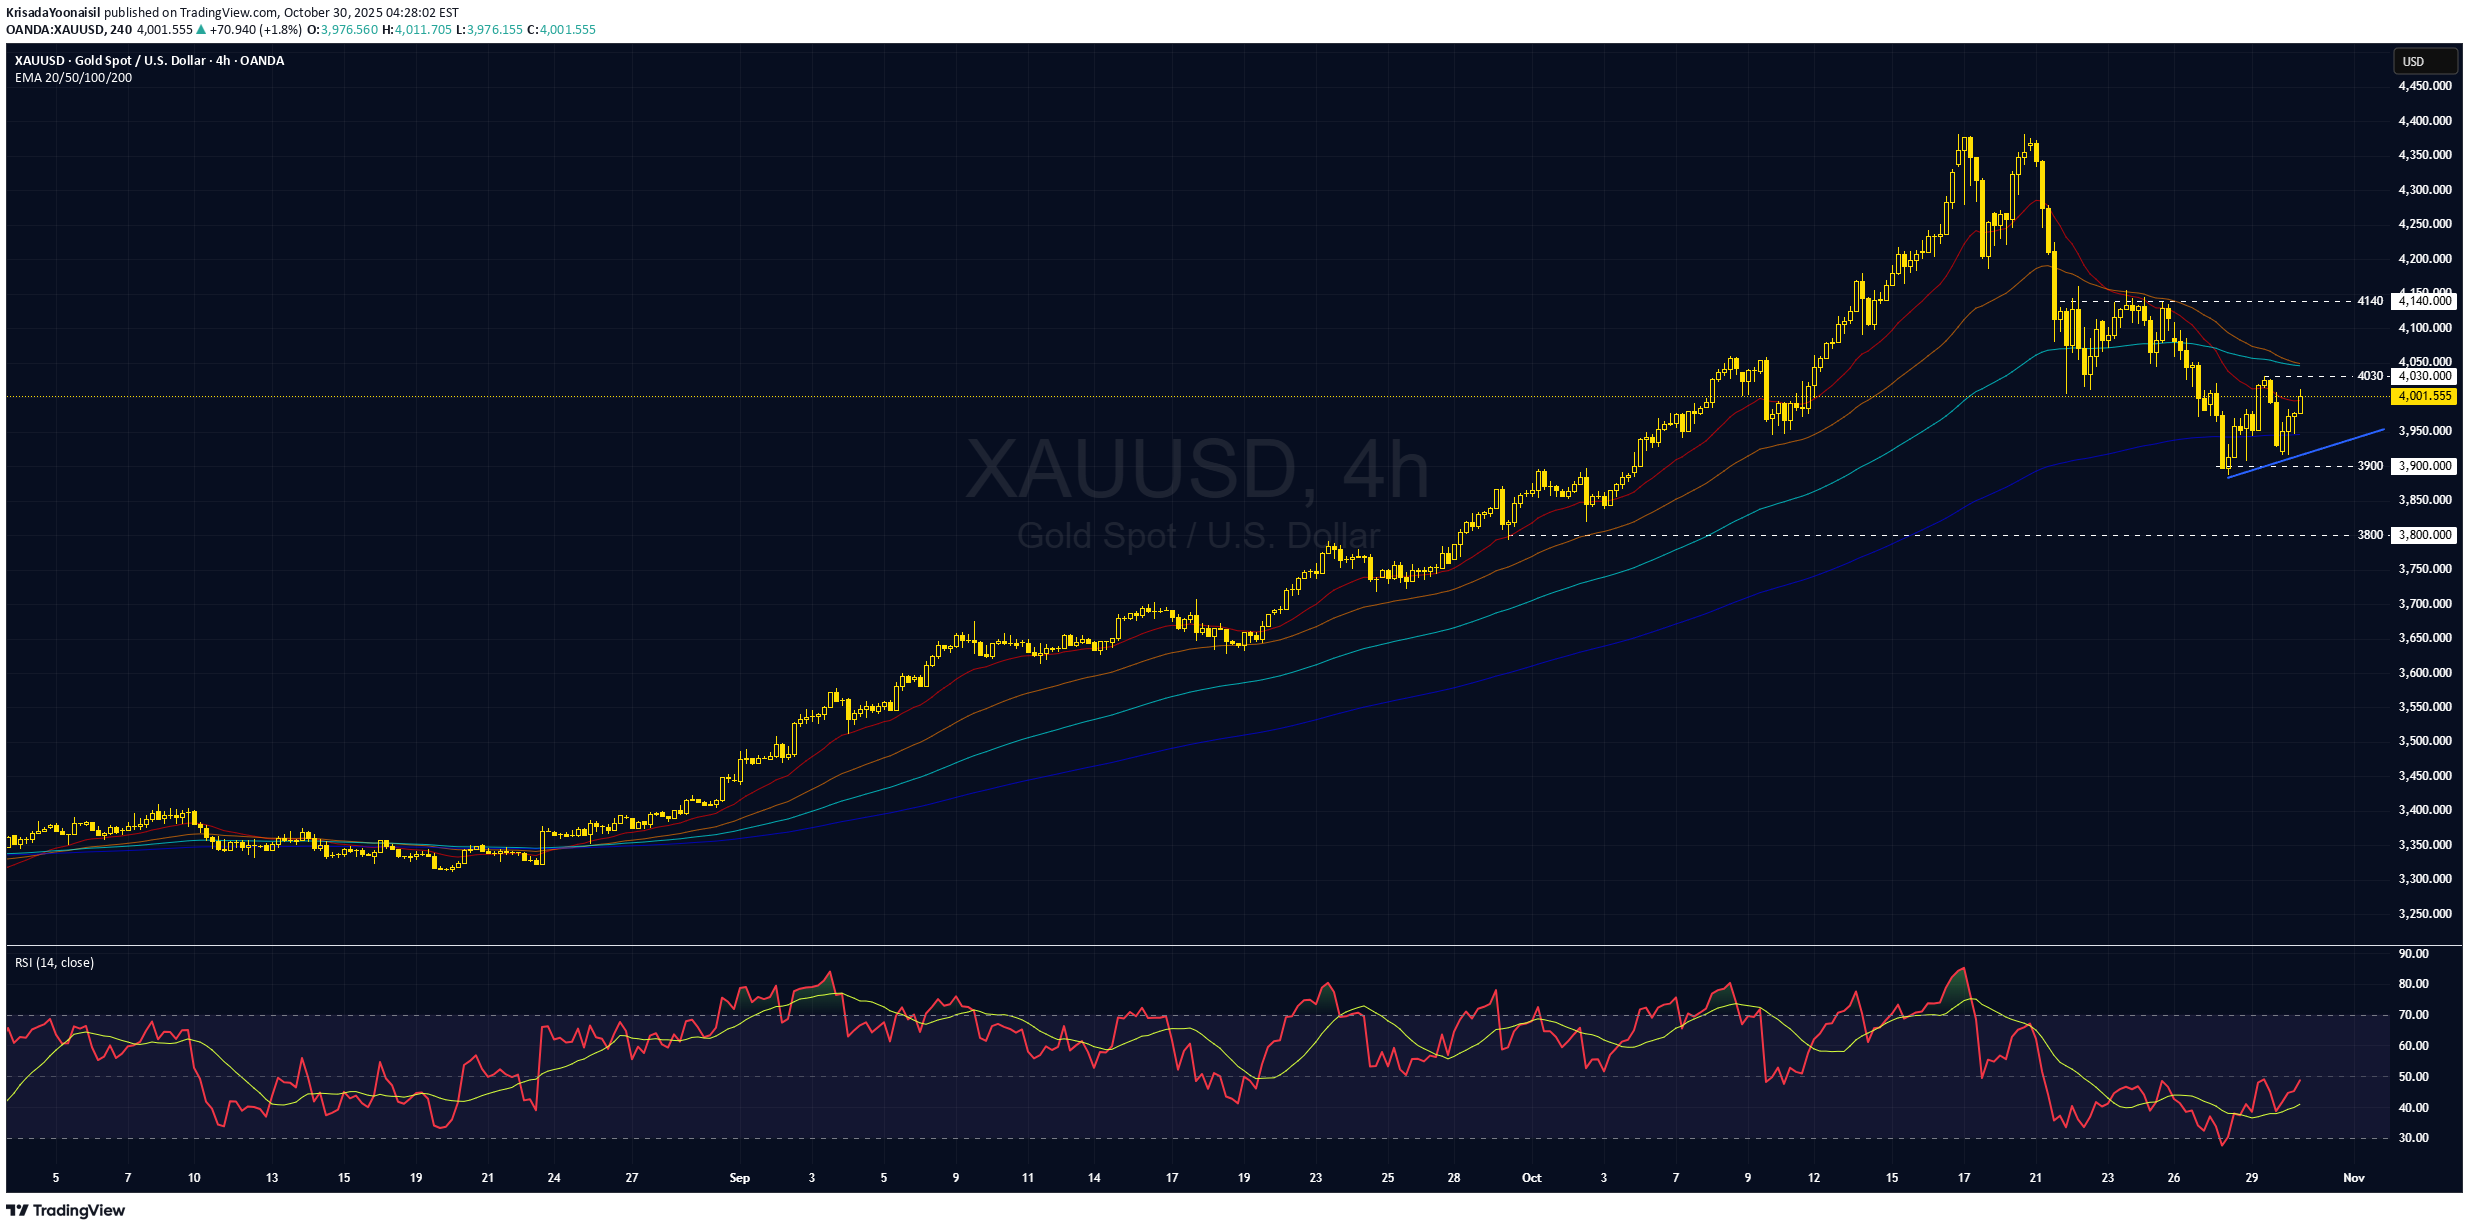
Gold struggles as Powell downplays odds of a December cut, tempering easing hopes. Technical factors 1. After last week's sharp selloff, gold has begun to consolidate and is rebounding, forming a higher swing low. This suggests the beginning of an upswing in the short-term within a broader corrective wave, which is confirmed by converging multi-period EMAs. This indicates a sideways trend and range-bound trading for a while. 2. If XAUUSD can hold above the ascending trendline, it may break the latest swing high at 4030 and advance toward 4140. 3. However, if the price fails to hold above the key support at 3900, it could signal a return to the downtrend. Fundamental factors 4. The Fed's signal of a less dovish stance may imply slower rate cuts, which would strengthen the U.S. dollar and pressure gold. 5. Meanwhile, the lack of details on trade progress after the Donald Trump–Xi Jinping meeting offered some support. 6. Over the longer term, structural problems with U.S. debt remain a supportive factor, but the Fed's tempered rate cut expectations weigh on gold in the near term, leaving the overall direction unclear. Analysis by: Krisada Yoonaisil, Financial Markets Strategist at Exness
KrisadaYoonaisil
کاهش سود تسلا: آیا عوامل کلان اقتصادی هنوز سهام تسلا را نجات میدهند؟
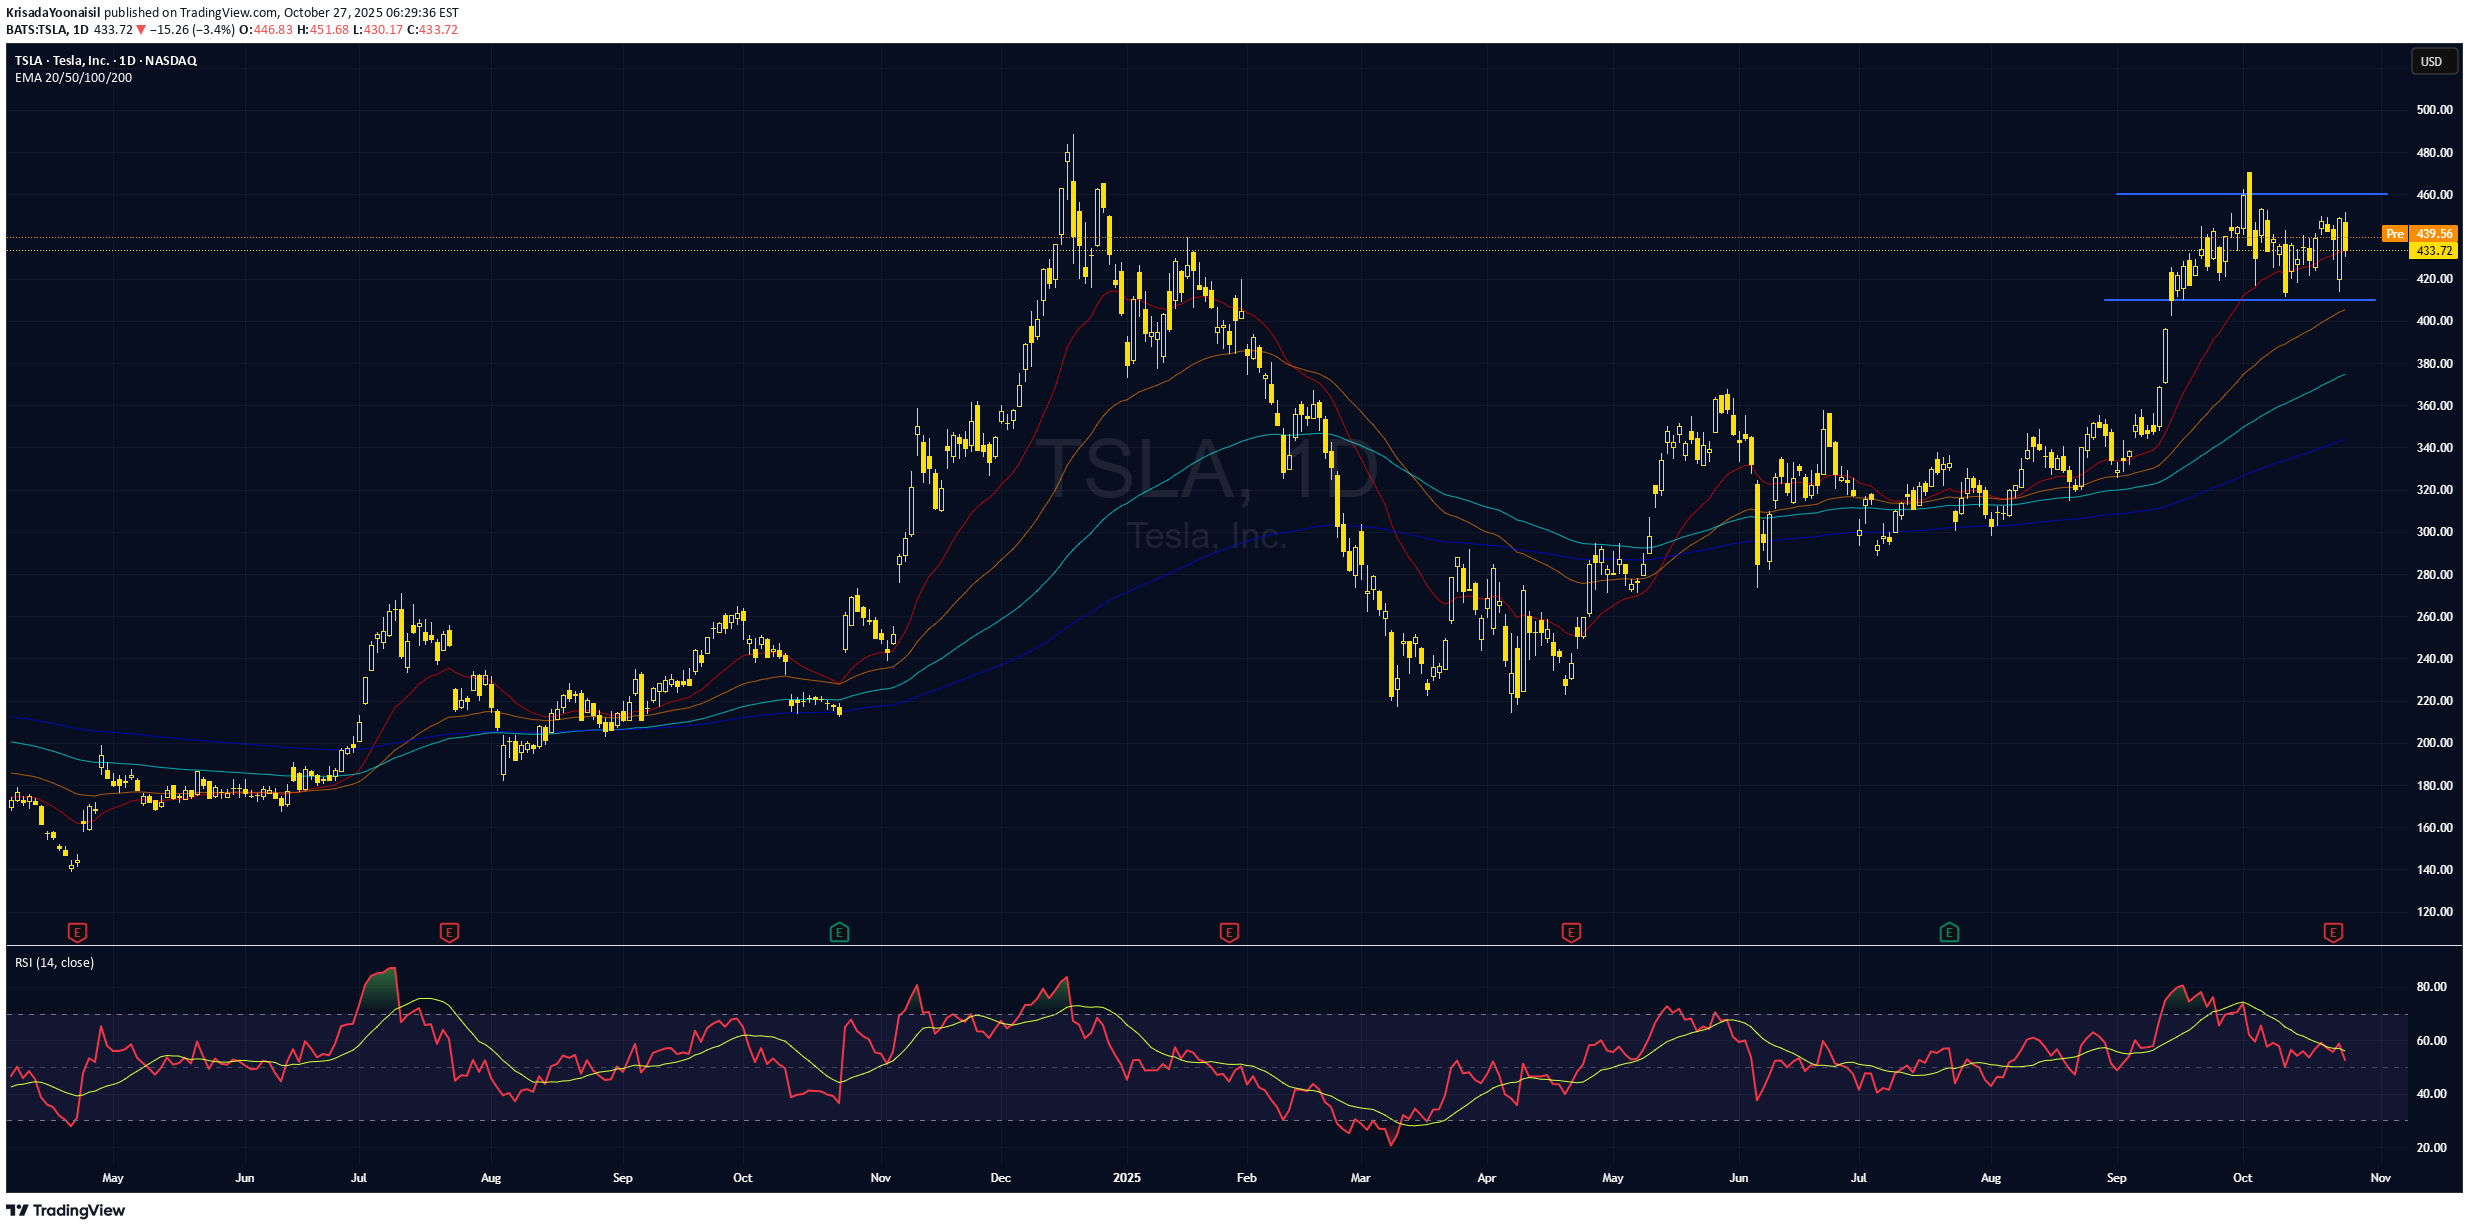
TESLA (TSLA): Profit growth is shrinking, but macro tailwinds still support the stock. Fundamental Analysis 1. TESLA, Inc. leveled-off due to a mix factors. The decline came after a disappointing Q3 earnings report on Oct 22 that revealed tighter margins and slowing profits despite record quarterly revenue. However, sentiment began to stabilize late in the week as investors anticipated a Federal Reserve rate cut and progress in US–China trade talks. 2. Tesla’s Q3-2025 was a margin-compression story that capped price gains, despite record revenue of 28.1bln USD (+12% YoY), lower ASPs from global price cuts and a ~50% surge in R&D/AI infrastructure spend (Dojo, robotics) squeezed profitability. 3. An AI-led tech rally continued to provide support, and broader U.S. market strength limited Tesla’s downside as major indexes notched record highs ahead of an expected 25 bps Fed cut on Wednesday (Oct 29). Optimism around the Oct 31 Trump–Xi summit in South Korea also helped steady cyclicals and autos into week’s end. Technical Analysis 4. TSLA has moved sideways for more than a month after rallying out of the previous range. The bullish EMA stack still signals a broader uptrend, suggesting potential continuation once the consolidation phase ends. 5. TSLA may trade between 410–460 until a directional breakout in either direction. 6. However, a drop below the EMA200 would signal a bearish reversal toward the prior sideways zone near the 300 support area. Analysis by: Krisada Yoonaisil, Financial Markets Strategist at Exness
KrisadaYoonaisil
صعود طلا تمام نشده؛ گاو نر فقط نفسی تازه میکند!
It's not the end of the uptrend yet for gold; the bull is just taking a break. Technical Analysis 1. XAUUSD remains trading within an ascending channel that has been emerged since early August 2025. Although the price briefly tested the lower boundary, it quickly rebounded. 2. The recent sharp drop occurred after gold broke above the ascending channel’s upper boundary while momentum indicators were overbought which mean the price was extremely bullish and subjected to correct back. This suggests merely a short-term consolidation after an excessively rise, rather than a bearish reversal. 3. The pullback may also reflect mean reversion, as price had been distance above the EMAs. Even so, XAUUSD is still holding above the short EMA (EMA21), and the multi-period EMAs maintaining uptrend structure. 4. On the candlestick interpretation, there was only one long bearish candlestick, followed by a pin bar that briefly dipped near 4000 before bouncing—implying the sell-off was absorbed by significant demand which mean the bearish momentum is fading. 5. A 400 USD decline from peak may look massive, but relative to a prior rally of over 1,000 USD in one leg, it is more likely a corrective move within a minor wave than a totally reversal. 6. From here, if XAUUSD can holds above the support at 3900, price is likely to move sideways in range for a while ( around 1–2 months), before resuming the uptrend. 7. In a more bullish scenario, if the price remains in within the ascending channel, we could see a new all-time high again soon, even with stronger bullish momentum that we haven't seen before. 8. However, if the price falls below 3900, that may signal a transition to a longer-term downtrend and would warrant a reassessment of this outlook. Fundamental Analysis 9. The underlying fundamentals that have recently driven gold bullish has no sign of changing, meaning they should continue to support, including: 10. Central bank buying: Many central banks have been adding gold, creating steady, non-speculative demand and no sign of pause. 11. Geopolitics & fiscal stress: Ongoing conflicts, U.S.–China frictions, and debt/shutdown risks keep safe-haven demand for gold elevated. 12. US debt: This might be the actual most significant reason why the gold price has come this far and could drive the price beyond 4400. The demand for safe havens to avoid fiat currency. 13. Investment/ETF inflows: While equity prices may be overvalued, with increasing concern, gold becomes the most reliable investment vehicle. Gold ETFs have large YTD inflows (near record holdings), reinforcing momentum and demand. 14. Supply constraints: Few new mines and rising costs keep supply growth tight, supporting higher prices amid strong demand. Analysis by: Krisada Yoonaisil, Financial Markets Strategist at Exness
Disclaimer
Any content and materials included in Sahmeto's website and official communication channels are a compilation of personal opinions and analyses and are not binding. They do not constitute any recommendation for buying, selling, entering or exiting the stock market and cryptocurrency market. Also, all news and analyses included in the website and channels are merely republished information from official and unofficial domestic and foreign sources, and it is obvious that users of the said content are responsible for following up and ensuring the authenticity and accuracy of the materials. Therefore, while disclaiming responsibility, it is declared that the responsibility for any decision-making, action, and potential profit and loss in the capital market and cryptocurrency market lies with the trader.