Technical analysis by KrisadaYoonaisil about Symbol BTC on 11/13/2025
کف بیت کوین کجاست؟ آیا سقوط تمام شده یا منتظر ریزش بیشتر باشیم؟

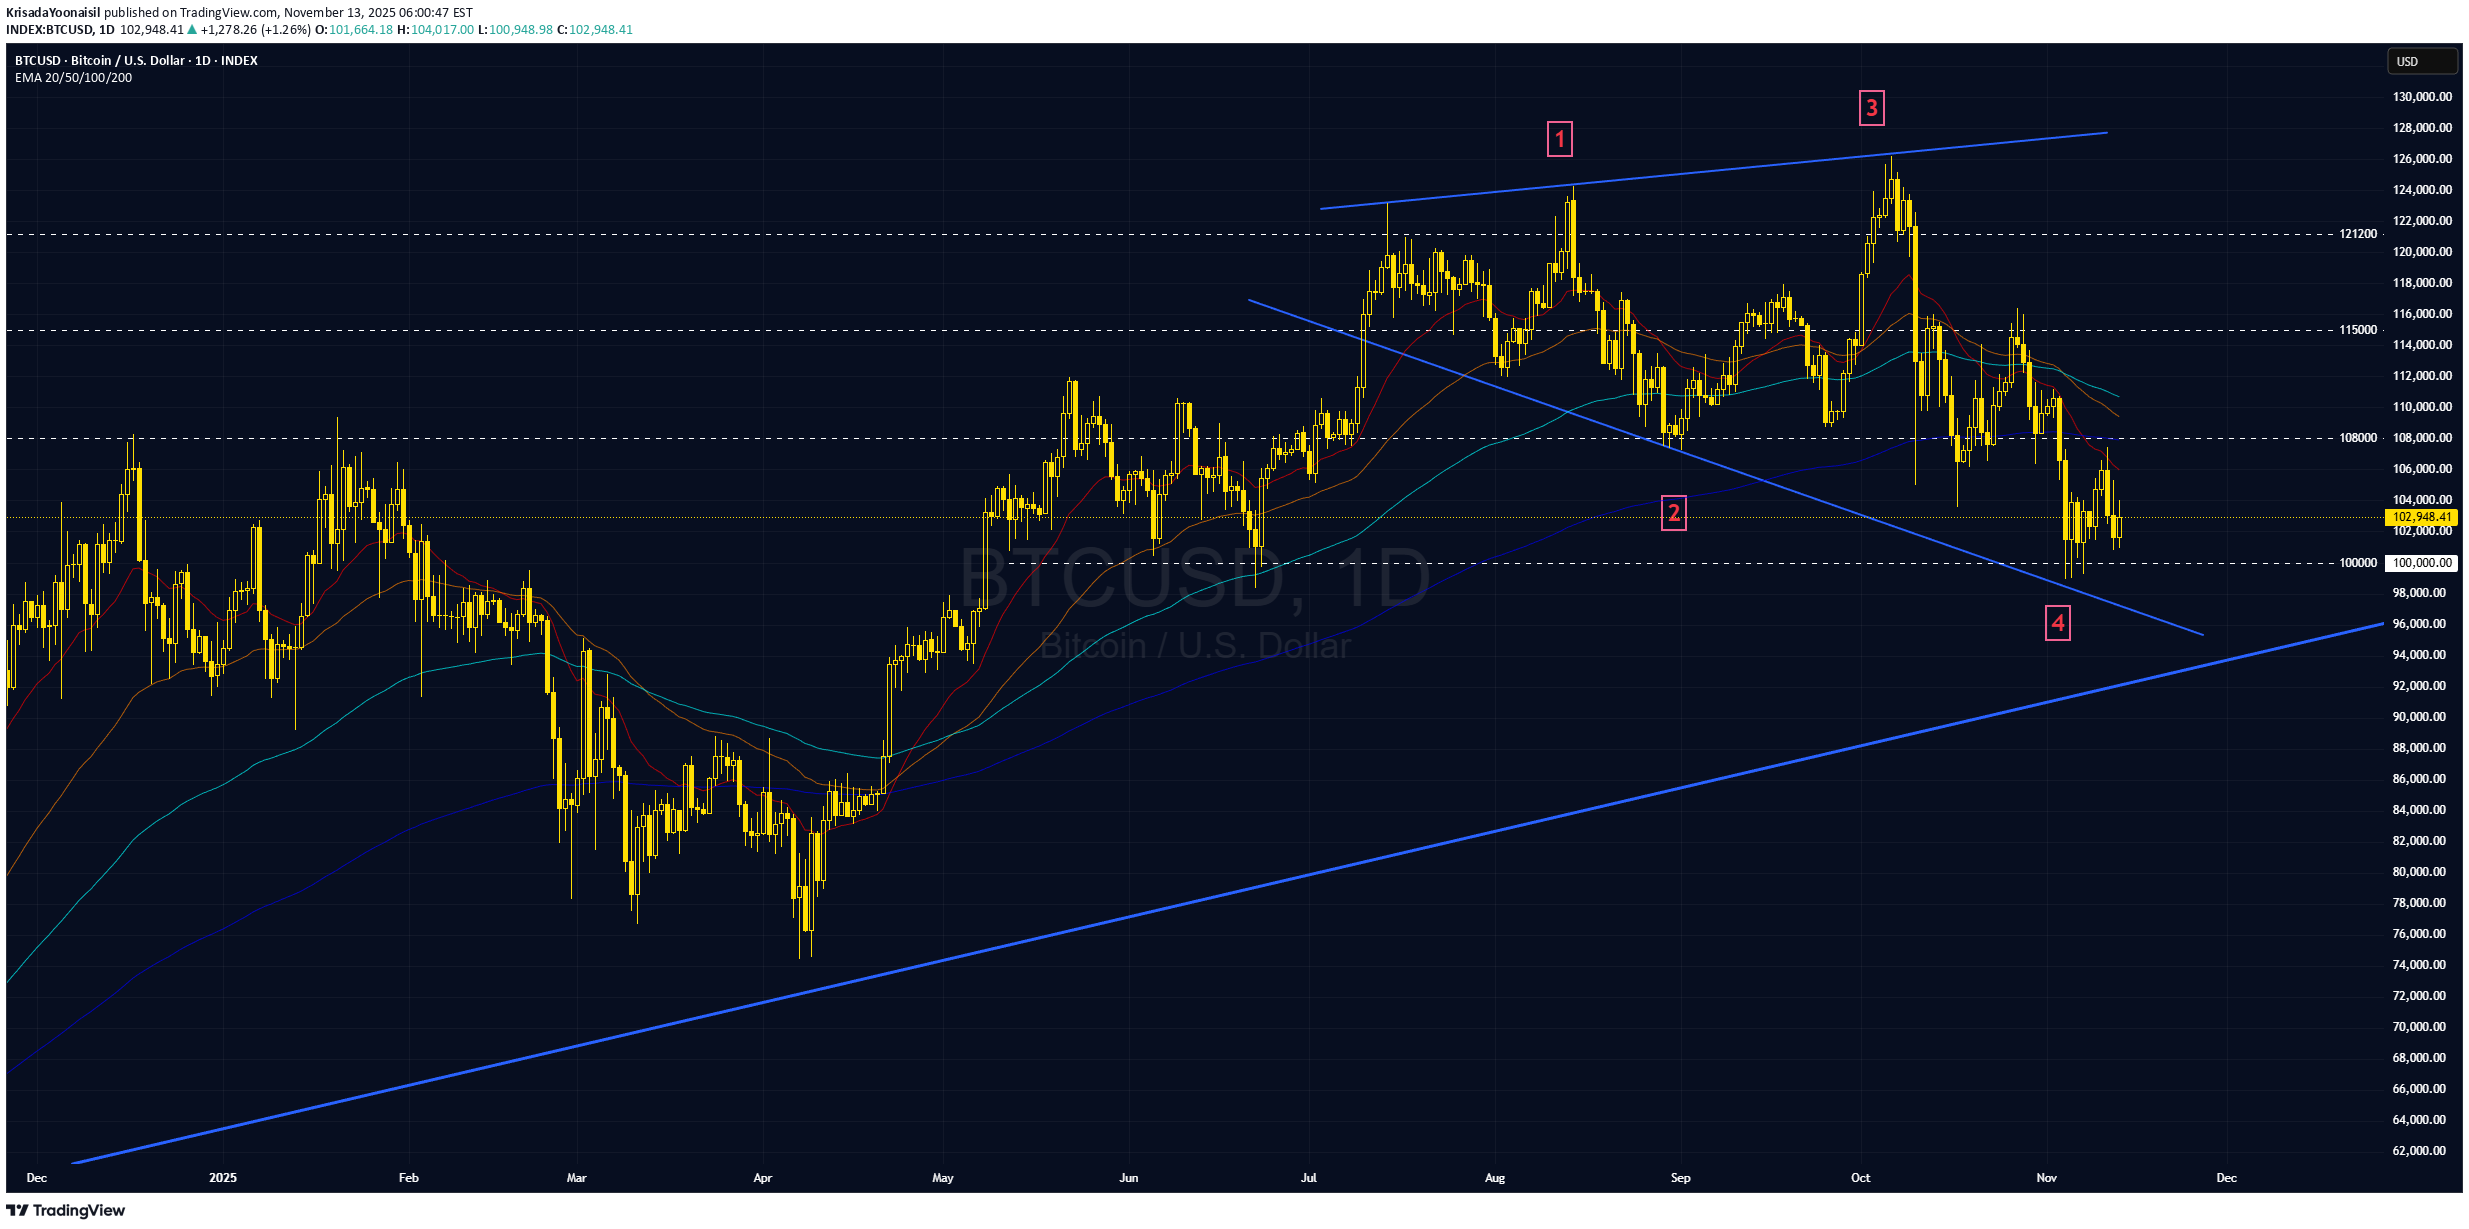
Has Bitcoin found a bottom? Is the selloff over? Technical Analysis 1. On the big picture, BTCUSD appears to be in a corrective wave forming a Broadening Triangle (Megaphone) —a continuation pattern. Thus, unless price decisively breaks below this structure, the longer-term uptrend can still resume. 2. In the near term, multi-period EMAs signal a downtrend and fanning out, indicating strengthening bearish momentum in the short term, so it may form lower low. 3. Given $100,000 is a key psychological support, even if price seems to hold above this level, a brief liquidity sweep below the zone could occur before an actual trend reversal. 4. If BTCUSD rises above the last swing high at 108000, it may confirm a trend reversal. Fundamental Analysis 5. On ETF flows data (Farside.com): two weeks ago showed net sell $799mn; last week net sell $1,208mn; so far this week (first three days) net buy $247mn —suggesting easing selling pressure. 6. On-chain data from Glassnode shows Balance on Exchanges at a six-year low, pointing to increased long-term holding. The Fear & Greed Index currently indicates Fear, a contrarian opinion signal that the market may be oversold. 7. A sharp plummet like in past cycles now seems less likely , as digital assets enjoy broader acceptance among traditional investors. This institutional participation and corporate treasuries’ crypto holdings help absorb panic selling, supporting the view that Bitcoin’s four-year cycle dynamics have faded—making a steep, crash-like drop less probable. Analysis by: Krisada Yoonaisil, Financial Markets Strategist at Exness
