Technical analysis by isahebdadi about Symbol AAPLX: Buy recommendation (11/6/2025)

سهام اپل در نقطه عطف حیاتی: آیا مقاومت ۲۶۰ دلاری میشکند؟
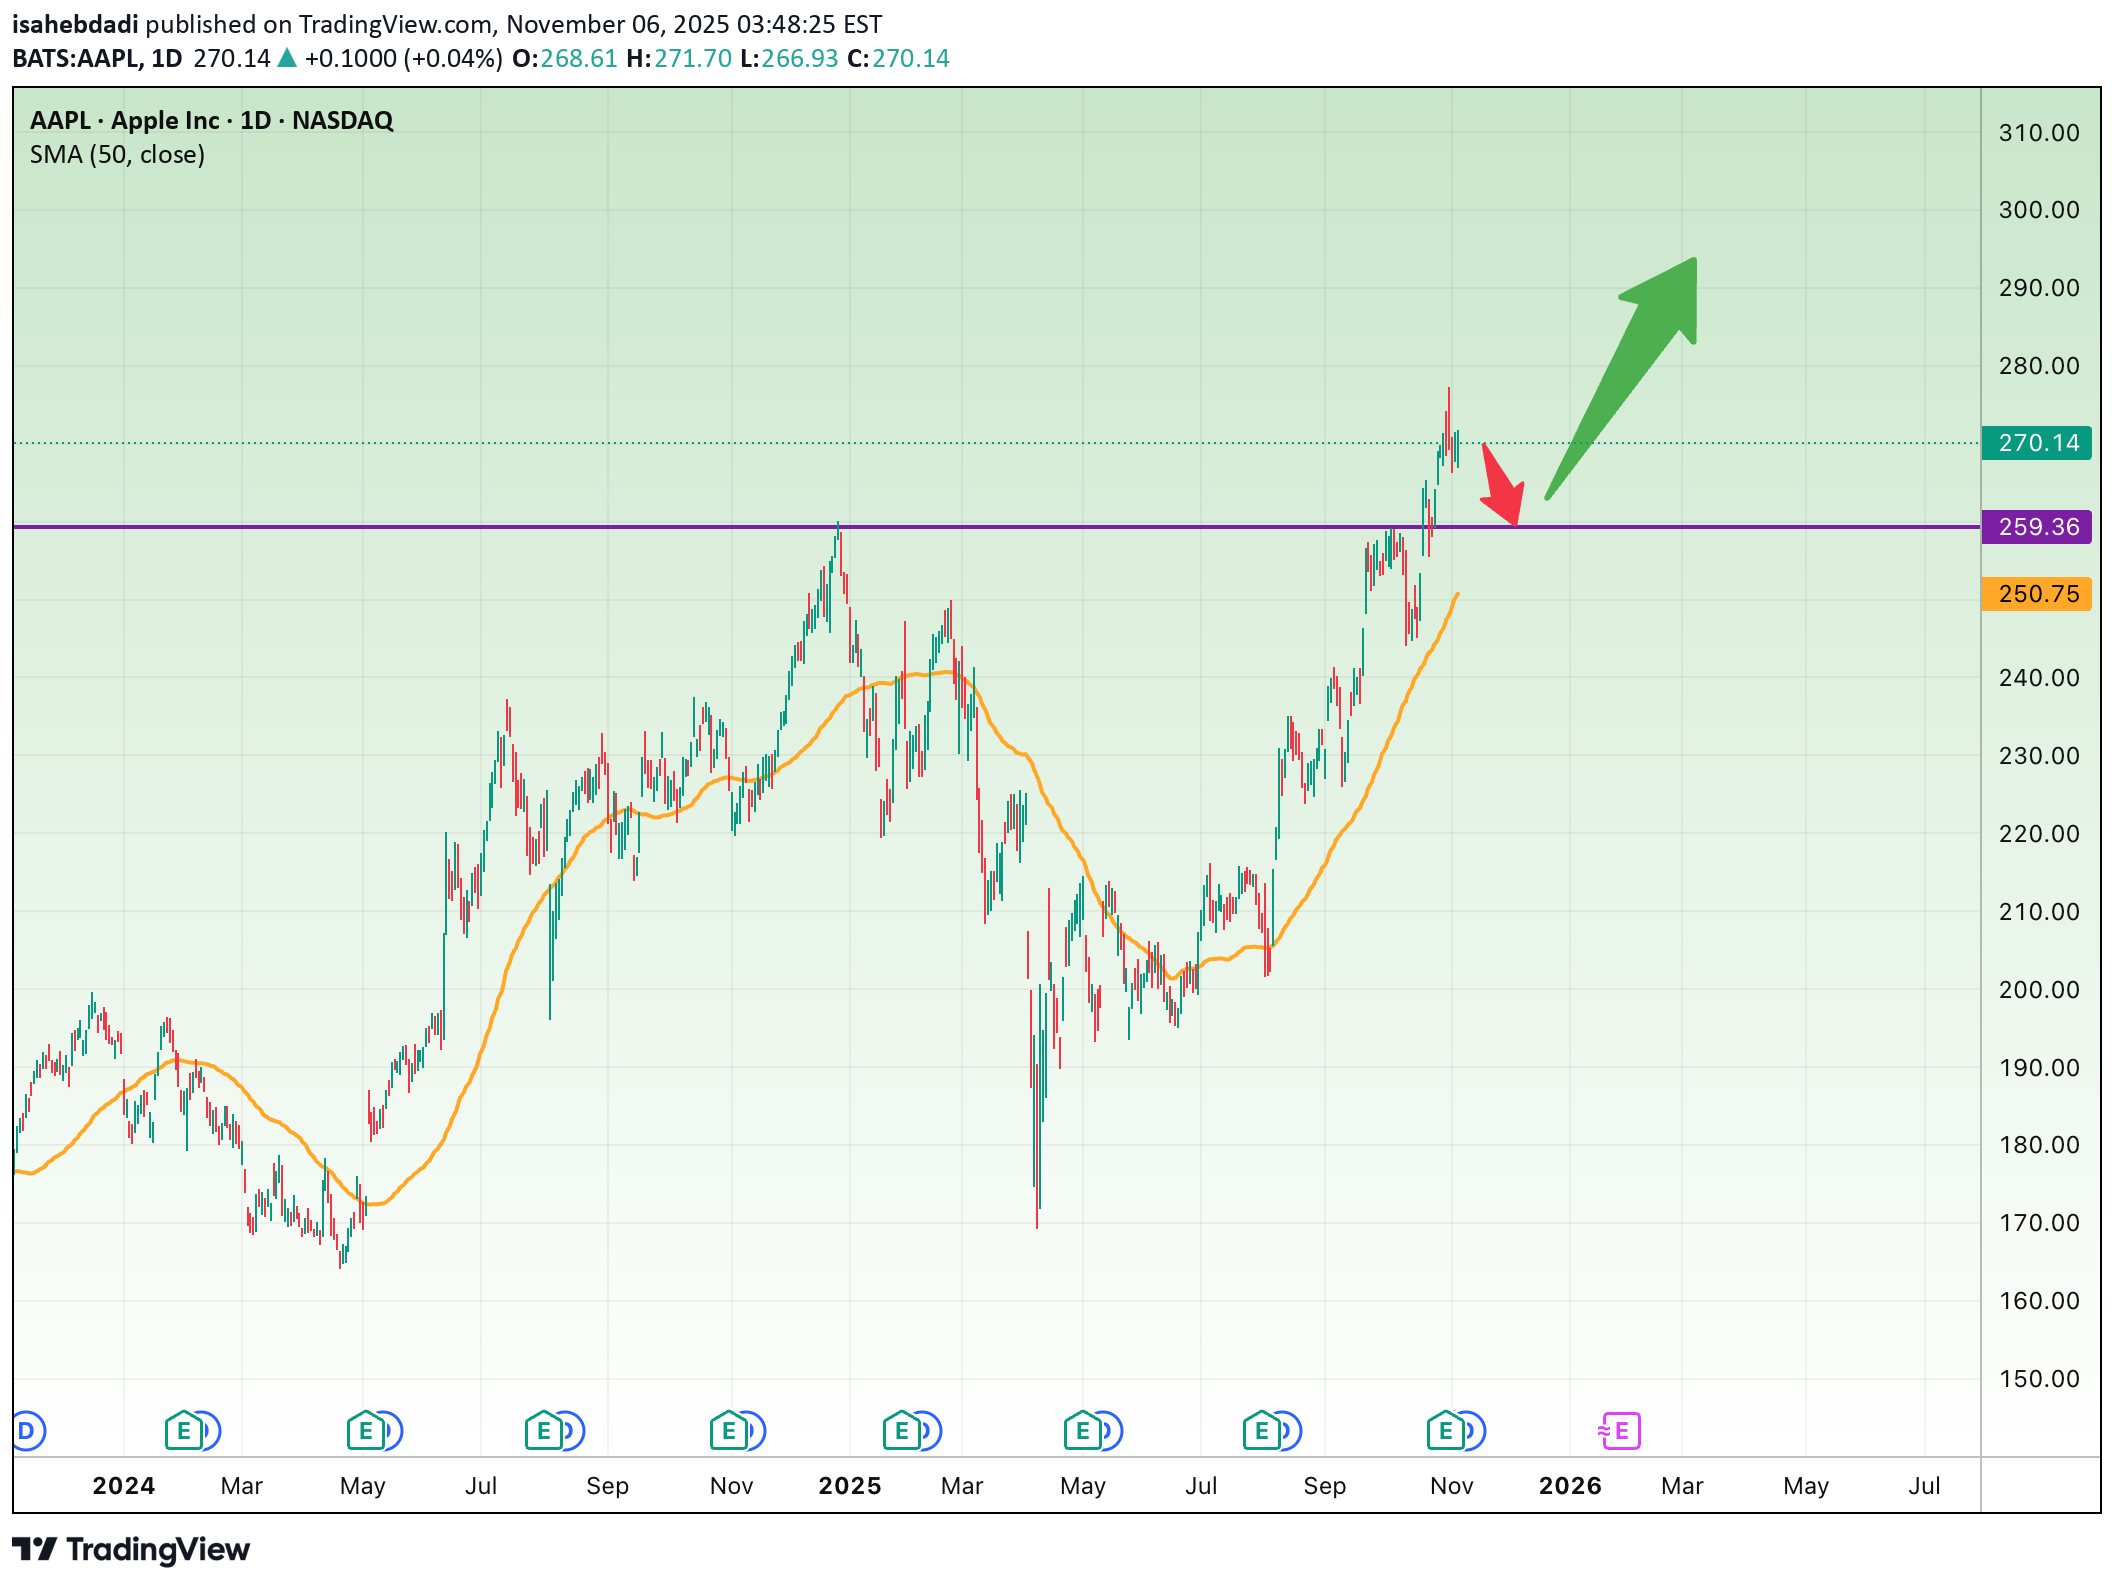
The Apple (AAPL) daily chart shows that after a strong rally from around $220, the stock has now reached a major resistance zone near $260, where heavy selling pressure has appeared. How the price reacts to this level will likely determine the next medium-term trend. Short-Term Outlook (next few days to weeks): In the short term, the $259–$260 zone is a key support/resistance area. If the price manages to hold and close above it, a continuation toward $280–$290 is likely. However, if it fails to sustain this level and breaks below $259, a short-term correction toward $250–$245 (around the 50-day SMA) could follow. •Bullish short-term target: $280–$290 •Bullish stop loss: Below $258 •Bearish short-term target: $250–$245 •Bearish stop loss: Above $265 Long-Term Outlook (1–3 months): The broader trend remains bullish, supported by an upward-sloping 50-day moving average and consistent higher highs. A confirmed breakout and close above $260 would likely fuel a new leg higher toward $300–$310. On the downside, if the stock loses support around $245, a deeper pullback toward $230 could occur. •Bullish long-term target: $300–$310 •Long-term stop loss: Below $245 In summary, Apple is at a critical decision point — sustained strength above $260 could launch a new rally phase, while a breakdown below it might trigger a healthy short-term correction toward the 50-day moving average.