
ProjectSyndicate
@t_ProjectSyndicate

Ne tavsiye etmek istersiniz?
önceki makale
پیام های تریدر
filtre
ProjectSyndicate
AAPL: The 30% Rule — Why Apple’s Next True Low Likely at 200 USD

🍎 AAPL HAFTALIK ANLIK GÖRÜNTÜ - YÖNETİCİ ÖZETİ ✨ Apple Inc. çok yıllı bir düzeltme döngüsünün son aşamasına giriyor 📉 Birincil tez: Önceki Apple makro dezavantajlarıyla tutarlı olarak ~%30'luk bir düzeltme hala devam ediyor 🏛️ Makro zemin: Dow Jones Endüstriyel Ortalaması psikolojik 50.000'e yaklaştı → son dönem riski yükseldi ⏳ Zamanlama odağı: 2025 dağılımı → 2026 düzeltici düşük 🎯 Öngörülen olumsuz hedef: 200$ ±10 makro destek + değerleme sıfırlaması ________________________________________ 🔍 %30 Düzeltme Neden Önemlidir? Tarihsel Fraktal Mantık Apple, seküler boğa piyasalarında ~%30'luk düşüşlere defalarca saygı gösterdi; çökmelere değil, ancak kontrollü yeniden derecelendirmelere: •📌 2021 → 2022: • Yüksek → Düşük ≈ -%30 • Tetikleyici: sıkma döngüsü + çoklu sıkıştırmayı artırma • Sonuç: çok çeyreklik güçlü toparlanma •📌 2024 → 2025: • Yüksek → Düşük ≈ -%30 • Tetikleyici: AI liderliğindeki aşırı genişleme + endeks yoğunlaşma riski • Sonuç: trendin yeniden başlaması değil, aralık onarımı •📍 Mevcut Döngü (2025 → 2026): • Yapı başka bir orantılı ayağı öneriyor • Yükseklerdeki dağılım → giderek düşen en yüksekler → trendin tükenmesi • 286'dan move ölçülmüştür ⇒ ~200 tarihsel simetriye uygundur 📐Piyasa mantığı: Apple genellikle çökmez – sıkıştırır. ________________________________________ 🧱 Önemli Teknik Bölgeler Haftalık / Aylık •🔺 286–280: Makro tavan / döngü yüksek (dağıtım tamamlandı) •⚖️ 245–235: Orta düzey tıkanıklık (geçici reaksiyonlar mümkündür) •🟨 215–200: Yüksek olasılıklı terminal destek bölgesi •🚨 Geçersiz kalma (ayı tezi): 286'nın üzerinde sürekli kabul ________________________________________ 🧠 Makro Kesişme 2026 Neden Önemlidir •📊 DJIA tarihi genişlemeye yakın → geri dönüş riskinin arttığı anlamına geliyor •💰 Pasif akışlar mega büyük harflerle dolu (AAPL = core tutma) •🧮 Döngü zirvelerindeki değerleme hassasiyeti tarihsel olarak zamanla değil fiyatla çözümlenir •🕰️ Apple'ın düzeltmeleri genellikle endeksin zirvelerinden geride kalıyor, daha geniş duyarlılık kırılmalarından sonra ise dip noktasına ulaşıyor ________________________________________ 🎯 Stratejik Ticaret Çerçevesi •❌ Yükseklerde uzun pozlamayı takip etmekten kaçının •🧘♂️ Netlikten önce volatilite + aralık genişlemesi bekleyin •🛒 En iyi uzun vadeli birikim: yalnızca 200 bölgesine yakın, daha erken değil •🧭 Taktik yatırımcılar sıkı riskle 280 seviyesinin altındaki rallileri kısa pozisyona alabilirler •🏦 2026 Sonrası: Yüksek kaliteli sıfırlama muhtemelen bir sonraki uzun vadeli ilerlemeyi hazırlayacak ________________________________________ 🗳️ AAPL Haftalık Senaryolar - Seviye Testi Bundan sonra hangi yolu görüyorsunuz? 🅰️ Son kırılmadan önce 245'in üzerinde tutun → genişletilmiş aralık 🅱️ 235'i kırın → 215–200 makro desteğine doğru hızlanma 🅲 2026'da ~200'e çıkacak → nesilsel birikim penceresi 🅳 Seviyeniz: önyargınızı değiştirecek tek fiyatı yoruma yazın
ProjectSyndicate
BTCUSD Institutional Levels: Sell Premium 97 500–102 000

🔱 BTCUSD HAFTALIK ANLIK GÖRÜNTÜ - YÖNETİCİ ÖZETİ ✨ Bitcoin boğa tuzağı riskinin yüksek olduğu geç dönem dağıtım yapısında konumlanıyor 🔴 Satış tarafı likidite mıknatısının 97.500'de geri kazanılması satıcı ilgisini teyit ediyor 🔄 Mevcut fiyat hareketi, sürekli kabul olmaksızın yukarı yönlü probları gösteriyor 🧱 Piyasanın üzerinde yığılmış kurumsal satış bölgeleri • 100.000 psikolojik mıknatıs • 102.000 teknik aşma ve boğa tuzağı genişletmesi 🟡 97 500'de reaksiyon direnç bölgesi 📉 Ayı-nötr eğilimi 102 000 seviyesinin altında geçerli olmaya devam ediyor 🎯 Olumsuz likidite hedefleri • 85.000'lik ilk alıcı tarafı likidite cebi • Major birikim ve maksimum ağrı bölgesi 80 000'de ⬇️ Piyasa yapısı, devam etmeden genişlemeyi ve ardından hızlı reddedilme riskini gösteriyor ⏳ Olumlu girişimlerin kabul edilmek yerine satılmasını bekleyin ⚠️ Geçersiz kılma, 102 000'in üzerinde sürekli kabul ve konsolidasyon gerektirir 🎯 Strateji Premium bölgelere güç satın Yalnızca likidite indirimlere girdikten sonra satın alın 🏦 Daha büyük birikim ancak alıcı taraftaki likidite 85.000 ile 80.000 arasında dengelendikten sonra tercih edilir 🧠 BTC PAZAR MANTIĞI — KURUMSAL OKUMA • Psikolojik ve teknik tur sayılarında aktif olan satıcılar • Envanteri dağıtmak için kullanılan olumlu uzantılar • 97 500, dağıtım ve hızlanma arasında bir pivot görevi görür • Önyargıyı tersine çevirmek için 100.000'in üzerinde kabul gereklidir • Yüksek seviyelere yakın başarısızlık, likidite havuzlarına hızla çekilme olasılığını artırır • Aşağı yönlü hedefler momentum ticaretlerini değil değer bölgelerini temsil eder 🗳️ BTC HAFTALIK SENARYOLAR — OYUNUNUZ NE? BTC için bundan sonra hangi yolu bekliyorsunuz? 🅰️ 97 500'den 100 000'e ret → 85 000'e doğru döküm Satış tarafı likiditesine klasik dağıtım 🅱️ 100 000'den 102 000'e yükseliş → keskin ret → 80 000'e hızlı düşüş Ders kitabı boğa tuzağı ve likidite taraması 🅲 Aralık 97 500'ün altında → sıkıştırma → 85 000'e genişleme Hızlanmadan önce yavaş oluşturma 🅳 Bu hafta en çok izlediğiniz seviyeniz BİR BTC fiyatı düştü 👇
ProjectSyndicate
GOLD Weekly Levels: Buy/Hold 4270/4300 Target 4500/4633

🔱 ALTIN HAFTALIK ANLIK GÖRÜNTÜ - YÖNETİCİ ÖZETİ ✨ Uzatılmış bir darbenin ardından dalga-4 birikiminde altın 🟡 Birincil dürtü tamamlandı: 3910 → 4500 (H2/H4) 🔄 Mevcut geri çekilme: 4500 → 4268 = düzeltici, tersine çevirme değil 🧱 Birikme bölgesi: 4300–4268 (yalnızca alım düşüşleri) 📈 Trend 4210'un üzerindeyken yükseliş eğilimini sürdürüyor 🚀 Wave-5 hedefi: 4630–4650 fiyat keşif bölgesi ⏳ Genişlemeden önce konsolidasyonu bekleyin ⚠️ Geçersiz kılma: 4210'un altında kabul 🎯 Strateji: düşüşleri satın alın ve tutun, yüksekleri takip etmeyin 🏦 Final ayağını muhtemelen daha büyük bir konsolidasyon takip edecek 🗳️ Altın Haftalık Senaryolar — Sizin Oyununuz Ne? Gelecek hafta XAUUSD için hangi yola sahipsiniz? 🅰️ 4,27x–4,30x tutun → 4,500+ / dalga-5 uzantısına doğru devam 🅱️ 4,25x–4,26x'e dalın, ardından daha yükseğe dönün (kırılma öncesi birikim) 🅲 Kabul > 4.380 → sıkışma yukarı yönlü devamı teyit ediyor 🅳 Seviyeniz: Gelecek hafta en çok izlediğiniz fiyatlardan birini düşürün 🔥 ALTIN HAFTALIK ANLIK GÖRÜNTÜ — PROJECTSYNDICATE TARAFINDAN 🏆 Yüksek Salla / Alçak Sallan 4.500 Dolar → 4.268 Dolar — uzun süreli bir ivmenin ardından dalga-3 zirvesinden kontrollü geri çekilme. 4,26$ alanına doğru düşüş, trendin tersine dönmesinden ziyade dalga-4 düzeltme aşamasıyla tutarlı olarak örtüşmeyi, sıkışmayı ve azalan momentumu gösteriyor. Haftalık yapı yapıcı olmaya devam ederken fiyat önemli geçersizliğin üzerinde seyrediyor. 📈 Trend Daha yüksek zaman aralığı: Birincil trend, H2/H4'te tamamlanmış 5 dalgalık bir ivmenin ardından yükseliş eğilimini sürdürüyor ve 3. dalganın 4.000 $ → 4.500 $'dan uzaması, güçlü trend katılımını doğruluyor. Taktik: Mevcut fiyat hareketi 4. dalga birikim / konsolidasyon aşamasına uyuyor: Dalga-3'e göre sığ geri çekilme Çakışan aralıklar Önceki koparma yapısının üzerinde sıkıştırma Fiyat 4.210 doların üzerinde kaldığı sürece, bant daha derin bir düzeltme yerine 5. dalgaya devam etmeyi destekliyor. 🛡 Destekler – Biriktirme / Satın Alma Tarafı Bölgeleri 4.300$–4.270$ 🟢Birikim bölgesi Birincil dalga-4 temel alanı. Bu bölge şunları temsil eder: Önceki küçük koparma yapısı Çakışan düzeltici fiyat eylemi Dip alım ilgisinin en güçlü olduğu alan Agresif kovalamaca için değil, dipten satın alma pozisyonu için tercih edilen bölge. 4.250$–4.230$: İkincil destek rafı ve gün içi savunma bölgesi. Bu alanın altında bir kabul, düzeltme riskini artıracaktır ancak yükseliş yapısını henüz geçersiz kılmaz. 4.210$ 🔑 Yapısal geçersizlik 4.210 doların altındaki kayıp ve kabul, 5. dalganın devamı tezini geçersiz kılıyor ve trendin anında uzaması yerine daha derin bir düzeltme aşamasına işaret ediyor. 🚧 Dirençler – Olumlu Hedefler / Genişleme Hedefleri 4.380$–4.400$: İlk yukarı yönlü direnç ve kısa vadeli likidite mıknatısı. Bu bölgenin üzerinde temiz bir geri alma ve tutma, dalga 4'ün tamamlandığını doğrulayacaktır. 4.500$: Önceki yüksek ve kırılma tetikleyicisi. 4.500 doların üzerindeki kabul, dalga 5 fiyat keşfinin kapısını açıyor. 4.630$ – 4.650$ 🎯 Wave-5 hedef bölgesi Önceki etki oranlarına dayalı olarak öngörülen dalga-5 genişleme hedefi. Bu bölge, daha büyük dereceli bir konsolidasyon olasılığı ortaya çıkmadan önce mevcut ivme dizisinin son yukarı yönlü ayağını temsil ediyor. 🧭 Bias Gelecek Hafta Birincil önyargı: birikim bölgesi içindeki düşüşleri satın alın, yüksekleri takip etmeyin. Piyasa yapısı şunları destekler: Hafta başında konsolidasyon devam etti 4.250$ – 4.210$’ın üzerinde tutmak Haftanın ilerleyen saatlerinde önceki yüksek seviyelere doğru kırılma girişimi Fiyat 4.210 doların üzerinde kaldığı sürece yükselişin devamı hakim senaryo olmaya devam ediyor. ⚖️ Temel Durum Senaryosu Hafta başı: Fiyat 4.270$ ile 4.330$ aralığında değişmeye devam ederek sıkışmayı sürdürüyor ve geç uzun pozisyonlardan gelen arzı absorbe ediyor. Hafta ortası: Birikim bölgesinin üzerinde sürdürülen tutunma, 4.380-4.400 dolara doğru yenilenen yukarı yönlü ivmeyi davet ediyor. Genişleme aşaması: 4.500 doların üzerindeki kabul, ivme odaklı fiyat keşfiyle birlikte 5. dalganın 4.630 dolara doğru devamını tetikliyor. 🚀 Koparma / Geçersiz Kılma Tetikleyicileri Yükseliş onayı: 4.500 doların üzerindeki günlük kabul, dalga 5'in devam ettiğini doğruluyor ve odağı daha yüksek genişleme hedeflerine kaydırıyor. Boğa geçersizliği: Temiz bir kırılma ve 4.210 doların altında bir kabul, 5. dalga tezini geçersiz kılıyor ve devam etmek yerine daha derin bir düzeltici yapıya işaret ediyor. 🔓 Boğa / Ayı Yapısal Çizgiler Boğa yapı hattı: 4.210 doların üzerinde – dürtü yapısı sağlam, düşüşler düzeltici ve satın alınabilir. Ayı genişleme hattı: 4.210 doların altında — yükselişin devamı ertelendi; herhangi bir yeni yükseliş öncesinde daha düşük talep bölgelerine doğru daha derin bir geri çekilme için alan açıyor. 🧭 Önerilen Strateji - Düşüşleri Al ve Tut (Birikim Aşaması) ⚠️ Açıklayıcı çerçeve, finansal tavsiye değil. Riski kendi kurallarınıza göre yönetin. 1️⃣ Birincil Strateji — Geri Çekmeleri Biriktirin Aşamalı uzun pozlama için 4.300 ila 4.270 ABD Doları'na odaklanın Yükseklere yakın güç peşinde koşmaktan kaçının Girişler için kabul ve yapı onayını kullanın Risk yönetimi / geçersiz kılma: Taktik geçersiz kılma: 4.210 doların altında sürekli kabul Olumlu hedefler: İlk hedef: 4.380$ – 4.400$ Çıkış hedefi: 4.500$ Genişleme hedefi: 4.630 $ – 4.650 $ (dalga-5 projeksiyonu)
ProjectSyndicate
YTD 2025 Market Performance Overview by ProjectSyndicate

🟡 1. YTD 2025 Piyasa Performans Özeti Aşağıda 2025 YTD'ye kadar major varlık sınıfı getirilerinin anlık görüntüsü yer almaktadır: 📊 Performans İnfografik – YTD Geri Dönüşleri (2025) • Kıymetli Madenler ◦ 🥈 Gümüş: +%150 ◦ 🥇 Platin: +%147 ◦ 🪙 Paladyum: +%92 ◦ 🟡 Altın: +%64 • Hisse Senedi Piyasaları ◦ 📈 Nikkei: +%27 ◦ 📈 DAX: +%22 ◦ 📈 QQQ: +%22 • Kripto para birimleri (Riskli Varlıklar) ◦ 🪙 Bitcoin (BTC): –4% ◦ 🪙 Ethereum (ETH): –%10 İçgörü: Klasik safe, değerli metallerin 2025 yılına kadar hisse senetlerinden ve dijital varlıklardan çok daha iyi performans gösterdiğini gösteriyor; bu da hem makro belirsizliği hem de gerçek varlıklara yönelik süregelen talebi yansıtıyor. 🌟 2. 2025 Yılının Temel Yatırım Temaları 🔶 A. Kıymetli Madenler Rallisi Performans Sürücüleri: • Yüksek enflasyon beklentileri ve faiz indirimi beklentileri, yatırımcıları hard varlıklarına yönlendirdi. • Gümüşün endüstriyel talebi (EV'ler, güneş enerjisi, elektrifikasyon), altın karşısında kazancını artırdı. • Platin ve paladyum, arz kısıtlamalarından ve araç emisyon teknolojisi talebinden yararlandı. • Güvenli liman talebi altını son yılların en yüksek seviyelerine çıkardı. 🤖 B. AI Teknoloji Sektörü Bu raporda AI teknoloji hisse senetleri için kesin endeks getirileri olmasa da, AI'un geniş çapta benimsenmesi, özellikle yarı iletken ve AI platform liderleri arasında önemli bir hisse senedi performansı sağladı: • NVDA Nvidia — AI bilgi işlem alanında liderliğini sürdürdü. • AMD — veri merkezi ve AI müşteri talebinden güçlü kazançlar. 🧬 C. Biyoteknoloji ve İnovasyon Biyoteknoloji aşağıdaki nedenlerden dolayı yapısal olarak büyüyen bir sektör olmayı sürdürüyor: • Yaşlanan demografi ve sağlık hizmetleri talebi. • Yeni ilaç yöntemleri ve yapay zeka destekli keşif. • Yeni terapötik sınıfların düzenleyici onaylarına devam edilmesi. Biyoteknoloji performansı alt sektörlere göre değişmekle birlikte, çeşitlendirilmiş büyüme portföylerindeki rolü güçlü olmaya devam ediyor. ⚠️ D. Kripto Piyasaları — Red'e Düz • BTC ve ETH, metaller ve hisse senetleriyle keskin bir tezat oluşturarak YTD'de hafif düşüşler kaydetti. • Kripto para birimleri 2025'te "dijital altın" olarak act olamadı; bu da hard varlıklara kıyasla değerini koruyamadı. Sonuç: Risk açma/kapama dinamikleri bu yıl geleneksel safe cennetlerini dijital varlıklara tercih etti. 📅 3. 2026 Altın Fiyatı Tahminleri — Kurumsal Konsensüs Altın 2025 yılını rekor yüksek seviyelerde kapattı ve analistler geniş yelpazedeki tahmin senaryolarıyla 2026'da da güçlenmeye devam edeceğini öngörüyor: 📈 2026 Altın Fiyat Tahminleri Tahmin Kaynağı2026 Hedef Notları J.P. Morgan Global Research~5.055$/oz (4. Çeyrek)Güçlü talep ve çeşitlilik etkenleri. JP Morgan Private Bank / Argonaut~5.200$–5.300$/ozArtan kurumsal talep senaryoları. Goldman Sachs~4.900$/ons Merkez bankası talebi ve faiz indirimleriyle desteklendi. Bank of America~5.000$/oz Geniş kurumsal görünüm. UBS~4.500$ (yıl ortası) Orta derecede yükseliş. Dünya Altın Konseyi (Ayı Senaryosu)~3.360$ – 3.990$/oz Reflasyonun güvenli liman talebini azaltması halinde düşüş eğilimi. Makro Konsensus / Teknik Modeller~4.000$–5.300$/oz. Anketlere ve modellere dayalı konsensüs aralığı. Uzun Vadeli ve Yüksek Tahminler 6.000$+Daha spekülatif uzun tahmin. 🧠 4. Strateji ve Portföy Sonuçları 📌 Safe Liman Tahsisi Güçlü 2025 performansı ve devam eden talep etkenleri göz önüne alındığında, aşağıdakilere tahsisleri sürdürmeyi değerlendirin: • Fiziksel altın ve ETF'ler • Gümüş ve endüstriyel metallere maruz kalma • Madencilik hisseleri ve imtiyaz şirketleri 📌 Büyüme ve İnovasyona Maruz Kalma Metalleri ve savunma konumlandırmasını büyümeyle dengeleyin: • AI ve yarı iletkenler • Biyoteknoloji temaları • Döngüsel piyasalarda hisse senetlerini seçin 📌 Kripto Konumlandırma 2025'teki sabit/kırmızı performans göz önüne alındığında: • Kripto tahsislerini risk toleransına göre yeniden değerlendirin. • Maruziyet devam ediyorsa, uzun vadeli yapısal benimseme katalizörlerine odaklanın. 🏁 5. Sonuç 2025, varlık sınıfları arasında çeşitlendirme konusunu güçlendirdi. • Değerli metaller, safe liman talebi, arz kısıtlamaları ve parasal dinamiklerin etkisiyle olağanüstü getiriler sağladı. • AI teknoloji ve biyoteknoloji, hisse senedi portföylerinde yükseliş sunan sürekli büyüme temaları olmaya devam ediyor. • Kripto varlıkları geleneksel riskten korunma önlemlerinin gerisinde kaldı ve bu da risk varlıklarında devam eden pazar bölümlendirmesinin altını çizdi. • 2026 altın fiyatı tahminleri, muhafazakar tahminlerden son derece agresif kurumsal tahminlere kadar çok çeşitli senaryolara rağmen genel olarak yükseliş yönünde.🟡 Değerli metaller 2025'te hakim oldu — Gümüş (+%150), Platin (+%147), Paladyum (+%92), Altın (+%64) 🥈 Gümüş, endüstriyel talep ve güvenli liman akışlarının etkisiyle en iyi performans gösteren oyuncu oldu 🥇 Altın, risk varlıklarından çok daha iyi performans göstererek gerçek para rolünü yeniden teyit etti 📈 Hisse senetleri sağlam ama mütevazı kazançlar sağladı — Nikkei (+%27), DAX (+%22), QQQ (+%22) 🤖 AI, küresel AI benimsenmesinden yararlanan NVDA ve AMD liderliğinde bir core büyüme teması olmaya devam ediyor 🧬 Biyoteknoloji sağlık hizmetlerine bağlı uzun vadeli bir inovasyon oyunu olarak devam ediyor & AI 🪙 Kripto 2025'te hayal kırıklığına uğradı — BTC (-%4), ETH (-%10) "dijital altın" olarak başarısız oldu ⚠️ Sermaye spekülatif riskten uzak, gerçek varlıklara yöneldi 🏦 Büyük bankalar 2026'da altının 4.500$ – 5.300$+ olacağını tahmin ediyor, bazı yukarı yönlü senaryolar ise daha yüksek 📊 2025'te çeşitlendirme güçlendirildi: gerçek varlıklar + AI daha iyi performans gösterdi hype 🔥 Sonuç olarak: Hard varlıklar ve gerçek inovasyon anlatıların üstesinden gelir.
ProjectSyndicate
فروپاشی بزرگ بیت کوین در ۲۰۲۶: آیا BTC تا ۳۰,۰۰۰ دلار سقوط میکند؟
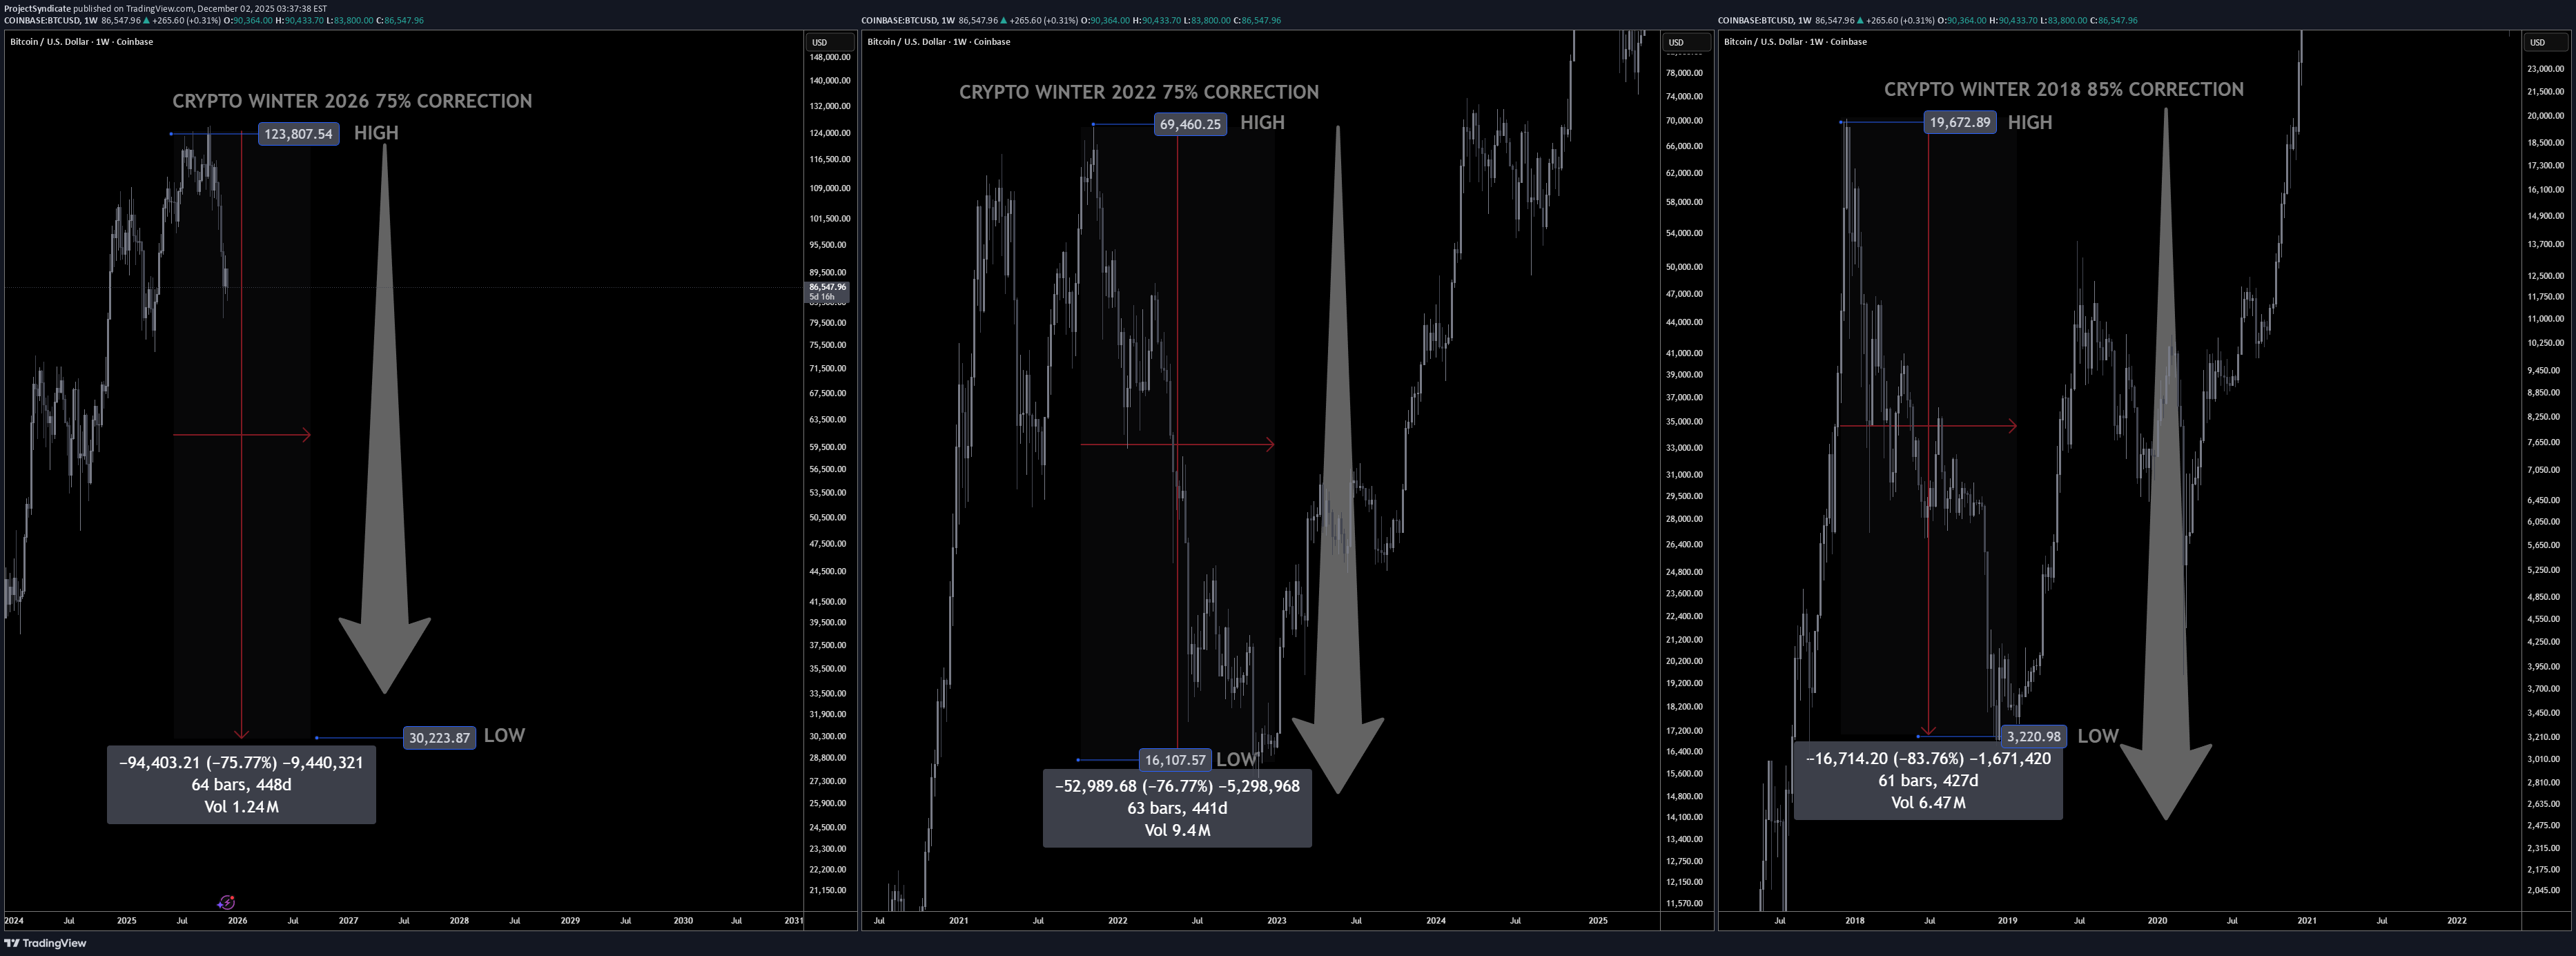
Investment Memo: Anticipating a 2026 Bitcoin Crypto Winter By ProjectSyndicate ________________________________________ 1. Executive Summary ❄️ Summary view: This memo treats 2026 as the high-probability crypto winter year for Bitcoin following the 2024 halving, with a working top around 123,000 USD and an expected cycle low near 30,000 USD, implying roughly a 75–76% drawdown from the peak. This is fully consistent with historical Bitcoin bear markets, which have typically seen 75–85% corrections from all-time highs. ❄️ Contrarian hook: While mainstream narratives still focus on ETFs, institutional adoption, and “crypto as macro asset,” the explosion of leverage (Aster DEX up to 1001x), CZ-backed perps, and BNB-chain meme-coin mania are treated here as late-cycle excess—classic topping signals rather than sustainable foundations. ________________________________________ 2. Thesis & Target Range 📊 Cycle top assumption: cycle high of ~123,000 USD per BTC. That is well within the band implied by recent ATH prints ~125–126k in mid-2025 and aligns with a typical “blow-off” overshoot above the prior psychological milestone at 100k. 📊 Cycle low assumption: 30,000 USD downside target represents a drawdown of ~75.6% from 123,000 USD—slightly shallower than the 2018 crash (~84%) and broadly in line with the 2021–22 bear (~77% from 69k to ~15–16k). That keeps this winter brutal but not apocalyptic, consistent with a maturing asset still capable of deep mean reversion. 🧮 Math check on prior winters •2017–18: 19k → 3k ≈ 84% drawdown •2021–22: 69k → 16k ≈ 77% drawdown •2025–26 (your base case): 123k → 30k ≈ 76% drawdown This places scenario squarely inside the historical corridor of 75–85% post-peak corrections. ________________________________________ 3. Historical Pattern: Why Large Drawdowns Are the Base Case 📉 Structural volatility: Bitcoin’s entire price history is punctuated by massive post-parabolic drawdowns—early cycles saw 86–93% collapses, later ones 75–80%. Each halving-to-peak run has ended in a violent crash once marginal buyers are exhausted and leverage saturates. 📉 Time dimension: Historically, the “winter” phase has lasted 9–18 months from peak to capitulation and then a long grinding accumulation. The 2017 peak to 2018–19 bottom spanned roughly a year; the 2021 peak to 2022–23 nadir similarly took about a year, with a further period of sideways chop. 📉 Drawdown normalization: Traditional asset allocators increasingly frame Bitcoin as an alternative macro asset, but the statistical reality is unchanged: drawdowns of 70%+ are not outliers—they are typical. An assumption of only shallow corrections is the non-consensus view; a 75% winter is actually the boringly normal scenario from a historical distribution standpoint. ________________________________________ 4. Where We Are in the Current Cycle ⏳ Post-halving positioning: The fourth Bitcoin halving occurred in April 2024, cutting block rewards to 3.125 BTC and effectively tightening supply. Historically, the major blow-off tops occur 12–18 months after halving, as reduced supply + narrative momentum pulls in late-stage retail and leverage. ⏳ Evidence of late-cycle behavior: By mid-2025, Bitcoin had already pushed to new ATHs above 100k and then into the ~120–126k region, with growing signs of ETF saturation, institutional FOMO, and leverage-driven upside. From a purely cyclical lens, we are more likely in the “euphoria / distribution” band than in early bull territory. ________________________________________ 5. Aster DEX & Meme-Coin Mania as Contrarian Top Signals 🚨 Aster DEX as the “Hyperliquid of BNB Chain”: Aster DEX, emerging from APX Finance and Astherus and explicitly leveraging Binance’s network, is marketed as a high-performance perp DEX with MEV-resistant trading and leverage up to 1001x, backed by CZ/affiliate ventures. From a contrarian perspective, this is textbook late-cycle: maximum leverage offered to the broadest possible audience at or near cycle highs. 🚨 BNB meme-coin carnival: Simultaneously, BNB-chain meme coins and speculative listings (Maxi Doge, PEPENODE, various new BNB meme projects) are being pushed as high-beta “next 100x” plays. Historically, similar episodes—2017 ICOs, 2021 dog-coin and NFT mania—have coincided with or slightly lagged Bitcoin’s macro top rather than signal early-cycle value. 🎭 Narrative pattern recognition: In prior cycles, the market’s center of gravity shifted from Bitcoin to highly speculative edges (ICOs, NFTs, obscure DeFi, meme coins) at the very end of the bull. Late-cycle liquidity rotates into lottery tickets while BTC quietly transitions from “must own” to “source of funds.” The current Aster + BNB meme complex rhymes strongly with that historical script. ________________________________________ 6. Why a 75% Drawdown to 30,000 USD is Plausible 🧊 From 123k to 30k mechanically: A move from 123k to 30k doesn’t require structural failure; it merely requires a reversion to historical drawdown. That kind of move can be achieved by: •ETF inflows slowing or turning to mild outflows •Derivatives funding turning negative as carry trades unwind •A moderate macro risk-off (equities correction, higher real yields) 🧊 Maturing, not invincible: As adoption broadens—spot ETFs, institutional mandates, integration into macro portfolios—Bitcoin’s upside may gradually compress, but liquidity cycles and leverage cycles haven’t vanished. Even if each cycle’s drawdown edges slightly lower from ~85% to ~77%, there’s no reason to assume sub-50% drawdowns are the new regime. A respectable winter at 30k is almost conservative relative to earlier -80%+ events. ________________________________________ 7. Why the Floor Might Hold Above Prior Lows 🛡️ On-chain + macro floor logic: Without pinning to proprietary on-chain models, two simple supports for a 30k floor are: •Institutional cost basis: A growing chunk of supply is held via ETFs and treasuries accumulated in the 40–70k band. Many of these players may defend positions with hedging or incremental buying in the high-20k / low-30k region rather than panic-sell at -70–80%. •Realized price ratcheting higher: Across cycles, Bitcoin’s long-term realized price average on-chain cost basis tends to step up structurally. Past winters have bottomed not far below that long-term average; as the realized base rises, so does the likely bear-market floor. 🛡️ Regime shift vs. previous cycles: In 2018 and 2022, Bitcoin was still climbing the wall of institutional skepticism. By the mid-2020s, you have: •Spot ETFs •Corporate treasuries •Sovereign/FI experimentation These players typically do not capitulate to zero; they reduce risk, but they also accumulate in stress. That supports the idea of a shallower floor (30k) instead of a full 85–90% purge. ________________________________________ 8. Timing the 2026 Winter 🧭 Halving + 18-month lag template: Using the standard halving cycle template, major tops often occur 12–18 months post-halving, and winters then dominate the following year. With the fourth halving in April 2024, a 2025 ATH and a 2026 winter are exactly what the simple cycle model would project. 🧭 Scenario sketch •2025: Distribution at elevated levels (80–120k+), persistent Bitcoin as digital gold narrative, alt & meme blow-off, over-issuance of high-leverage products (Aster, other perps). •2026: Liquidity withdrawal + ETF fatigue + regulatory flare-ups → a stair-step decline through 80k, 60k, 45k, culminating in capitulation wicks into the 30–35k zone before a multi-month bottoming process. ________________________________________ 9. Market Structure Stress Points in a Winter Scenario 🧱 Leverage cascade risk: Perp DEXs offering hundreds to 1000x leverage attract the most price-insensitive flow at the worst time. When BTC breaks key levels (e.g., 80k → 60k → 50k), auto-deleveraging and forced liquidations can accelerate downside far beyond spot selling. Aster-style platforms, while innovative, mechanically create risk of cascading liquidations in a volatility spike. 🧱 Alt & meme vaporization: BNB meme coins and other speculative assets that rode the late-cycle pump will likely see 90–99% drawdowns, as in previous winters where smaller alts dramatically underperformed BTC. In your framework, BTC at 30k is actually the “high-quality survivor” outcome; the majority of late-cycle tokens may never reclaim their peaks. 🧱 Mining and infrastructure: With halved rewards and a much lower BTC price, marginal miners will be forced offline, just as in prior winters. That tends to deepen the short-term pain but ultimately improves the cost curve (strong miners consolidate, inefficient ones exit), laying groundwork for the next cycle. ________________________________________🎁Please hit the like button and 🎁Leave a comment to support our team!let me know your thoughts on the above in the comments section 🔥🏧🚀🚨🚨🚨 2026 CRYPTO WINTER PLAYBOOK – CONTRARIAN BTC OUTLOOK 🥶 Bitcoin cycle top penciled in around $123K, with a projected winter low near $30K (≈-75%). ❄️ Previous winters: 2018 -84%, 2022 -77% – a -75% drawdown is actually “normal” for BTC. 🌨️ 2024 halving → 2025 blow-off → 2026 winter fits the classic 12–18 month post-halving boom-and-bust pattern. 🧊 Aster DEX 1000x leverage + BNB meme coin mania = classic late-cycle euphoria, not the start of a new bull. 🌬️ Spot ETF + institutional FOMO can’t delete BTC’s historical 70–80% crash DNA – they just shift where the floor is. 🌨️ $30K acts as a plausible new floor, supported by higher institutional cost basis and long-term realized price. 🧊 Expect alt & meme coins to nuke 90–99%, while BTC “only” does -75% and survives to lead the next cycle. ❄️ Smart money sells euphoria near 6-figure BTC, builds dry powder, and targets gradual entries 40–35–30K. 🥶 Leverage is the enemy: perps and 1000x casinos likely accelerate the crash via liquidation cascades. 🌨️ Not financial advice – it’s a cycle-based contrarian framework for a statistically “normal” 2026 Bitcoin winter.final DEATH BOUNCE incoming shortly in December/January. then lights out.
ProjectSyndicate
طلا هفته آینده: سطوح حیاتی حمایت و مقاومت و پیشبینی تریدرها
🔥 ALTIN HAFTALIK ANLIK GÖRÜNTÜ — PROJECTSYNDICATE TARAFINDAN 🏆 Yüksek/Kapanış: ~4,244$ → ~4,085$ — alıcılar 4,20 bin doları aştı ancak satıcılar 4.220-4.250 dolar bandını savundu; Haftalık kapanış yumuşak ancak yine de rahat bir şekilde 4 bin doların üzerinde ve orta aralığın üzerinde. 📈 Trend: Yükseliyor ancak düzeltici / iki yönlü modda ; Mevcut bandı 4.350–4.375$ ATH arz bloğunun altındayken aralık ticareti olarak ele alıyoruz. 🛡 Destekler: 3.925–3.935 $ taze yükseliş likiditesi → 3.800–3.825$ daha derin talep cebi — dip alımların beklendiği kilit raflar. 🚧 Dirençler: 4.220–4.230 $ kısa vadeli zayıflama bölgesi → 4.350–4.375 Dolar (ATH ağır direnç bloğu). 🧭 Önümüzdeki hafta önyargı: Gücün soldurulması tercihi 4.220-4.230 dolara, 3.925-3.935 dolara dönüş hedefleniyor. Alternatif, 3.925-3.935 dolara düşüşler satın almak ve aralığı 4.220-4.230 dolara doğru sürmek. 4.350-4.375 ABD dolarının üzerinde sürekli kabul durumunda geçersiz kılma; 3.800-3.825 $'lık kayıp, ortalamanın daha derin bir şekilde tersine dönmesi riskini taşıyor. ________________________________________ ________________________________________ 🔝 Anahtar Direnç Bölgeleri •4.220–4.230$ — haftalık tavan; ilk testlerde kısa devreleri başlatmak için cazip bir alan olan, belirttiğiniz direnç bloğunuzla aynı hizadadır. •4.350–4.375$ — önceki ATH / “ağır direnç bloğu”; Fiyat, güçlü hacimde bunun üzerine çıkmayı kabul etmediği sürece, buradaki herhangi bir yükseliş solmaya adaydır. 🛡 Destek Bölgeleri •3,925–3,935$ — taze yükseliş likiditesi; Kısa pozisyonlar için ilk kar alma bölgesini ve birincil dip alım bölgesini tercih etti. •3.800–3.825$ — daha derin taze likidite; Buradaki başarısızlık, yalnızca yükseliş trendindeki bir geri çekilmenin değil, daha anlamlı bir düzeltmenin sinyalini verecektir. ________________________________________ ⚖️ Temel Durum Senaryosu Yaklaşık 3.800 ila 4.230 ABD Doları arasındaki aralık/konsolidasyon: •4.220-4.230 $'a ilk itişler, 3.925-3.935 $'a doğru rotasyonlar için satılabilir. •Haftalık kapanışlar ATH bloğu 4.350-4.375$'ı reddetmeye devam ettiği sürece önyargı "satış gücü, temiz likidite düşüşleri satın alın" olarak kalmaya devam edecek. 🚀 Koparma / Arıza Tetikleyicileri • Boğa tetikleyicisi: Birden fazla seansta 4.350-4.375 Dolar üzerinde sürekli kabul görülmesi ve bu band'ün destek olarak kullanılması, tonu tekrar tam trende kaydıracak ve önceki uç noktalara (~ 4.400 Dolar +) doğru ve ötesine giden yolu yeniden açacaktır. •Ayı tetikleyicisi: 3.800 doların altında kesin bir günlük kapanış, mevcut "sağlıklı geri çekilmeyi" daha derin bir düzeltmeye dönüştürerek, daha önce 3.750 doların altındaki alt raflara ve muhtemelen volatilite artışına doğru yer açıyor. ________________________________________ 💡 İzlenecek Pazar Yönlendiricileri •Fed ve reel getiriler: Aralık ayında faiz indirimi ihtimali yeniden arttı; herhangi bir şahin geri itme veya daha sıcak data, dirence yakın yükselişleri sınırlayabilir. •U.S. mali/politik risk: Kapanma ve mali riskler hâlâ arka planda; Karar manşetleri altını kısa süreliğine baskı altına alabilirken, yenilenen istikrarsızlık da yükselişi destekliyor. •Akışlar ve konumlandırma: ETF ve merkez bankası talebi destekleyici olmaya devam ediyor, ancak %60'lık YTD koşusunun ardından hızlı para, kârları hızla güçlendiriyor. • Çapraz varlıklar davranışı: Öz sermaye-altın korelasyonunu izleyin; Riskten kaçış gerçekleşirse ve altın hala hisse senetleriyle birlikte satılıyorsa, stratejik alıcılar devreye girmeden önce düşüşler daha da artabilir. ________________________________________ 🔓 Boğa / Ayı Tetik Hatları •Yukarıdaki yükseliş: 4.350$ – 4.375$ (sürekli kabul; ATH blok destek olarak geri alındı). •Aşağıdaki düşüş: 3.800$ (mevcut likidite raflarının altında daha derin bir tasfiye riski açar). ________________________________________ 🧭 Bu haftanın stratejisi Birincil plan – direnişten kısa (sizin core fikriniz): •Giriş bölgesi: Direnç bloğunun 4.220–4.230$ front kenarı civarında kısa pozisyonlara doğru ölçeklendirin. •TP #1: 3,925–3,935$ taze yükseliş likiditesi; Çoğu boyutu burada kapatmayı düşünün. • Koşucu / uzatma: Momentum daha da düşerse, nihai kar alımı için 3.800-3.825 doları izleyin; burada profil daha derin düzeltme moduna geçer. •Risk: Hard fiyatın 4.350-4.375$'ın üzerini kabul etmesi halinde geçersizlik, üzerinde kalınarak günlük kapanışlar ve başarılı yeniden testler. Alternatif plan – likiditedeki düşüşü satın alın: •Giriş bölgesi: Teklifleri 3.925–3.935 $ civarında ve daha agresif konumlandırma için 3.800–3.825 $'a kademeli olarak ayarlayın. •Çıkış bölgesi: İlk hedef 4.220-4.230$'a geri döner; Bu dirence yaklaşırken riskten kurtulmayı büyük ölçüde düşünün band. •Risk: Fiyatın günlük kapanış bazında 3.800$'ın üzerinde tutunamaması veya bu rafta satışların yüksek hacimle hızlanması durumunda kesinti yapın veya azaltın.
ProjectSyndicate
پیشبینی تسلا ۲۰۲۶: رتبهبندی کاتالیزورها و هدف قیمتی ۶۰۰ دلاری
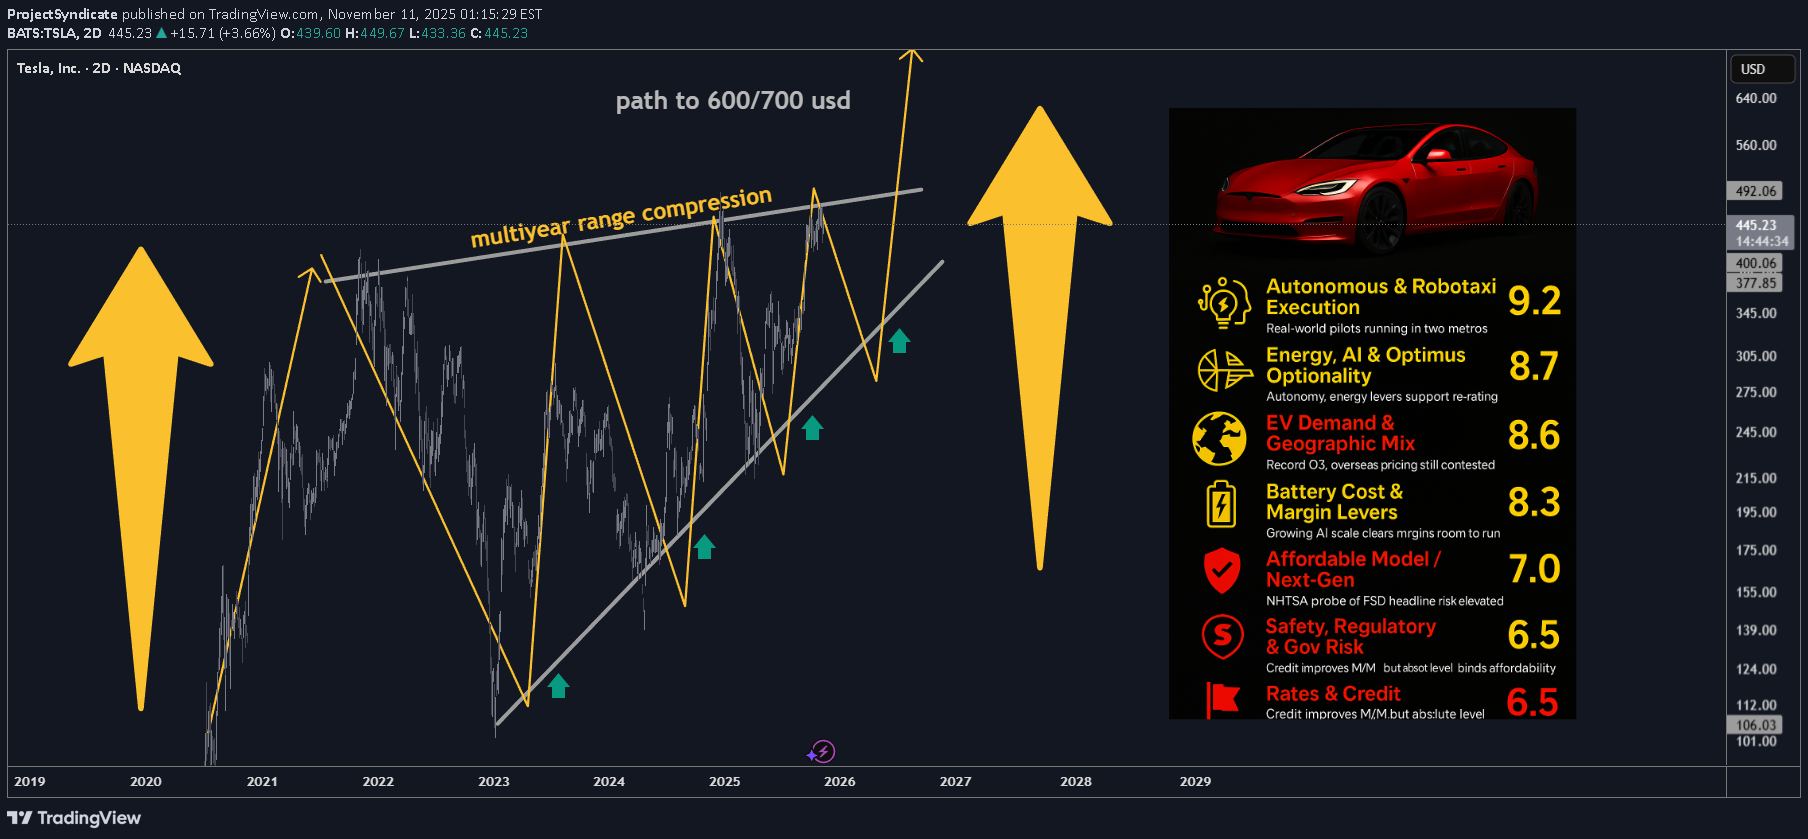
________________________________________ TSLA: Updated Outlook (Nov-2025) Here's an updated/revised outlook for TSLA including all the primary catalyst ranking and analyst ratings and overview of latest developments this was updated for Q1 2026 with all the viable market data. ________________________________________ 🤖 1) Autonomous & Robotaxi Execution — 9.2/10 (↑) •What changed: Tesla’s invite-only Austin robotaxi pilot kept running through the summer; Tesla also says it launched a Bay Area ride-hailing service using Robotaxi tech (Q3 deck). FSD v14 (Supervised) began rolling out in Oct with broader model upgrades; Tesla claims billions of supervised miles and AI training capacity lifted to ~81k H100-equivalents. •Offsetting risk: NHTSA opened a fresh probe (Oct-2025) into ~2.9M Teslas over traffic-safety violations when using FSD; investigation cites 58 reports incl. crashes/injuries. •Why the bump: Real pilots in two metros + visible AI scale-up keep autonomy the center of the bull case—even with elevated regulatory risk. ________________________________________ 🌍 2) EV Demand & Geographic Mix — 8.6/10 (↘ ) •What changed: Q3-25 delivered record vehicles and record energy storage deployments, with record revenue and near-record free cash flow. Still, we’re past the U.S. tax-credit pull-forward and China/Europe pricing remains competitive. •Read-through: Momentum into Q4 looks better than 1H-25, but regional price discipline and mix will matter. ________________________________________ 💸 3) U.S. EV Tax Credits & Incentives — 6.0/10 (↘) •What changed: Federal new/used EV credits ended for vehicles acquired after Sept 30, 2025 under OBBB. Buyers can still qualify if a binding contract + payment was made by 9/30 and the car is placed in service later (“time-of-sale” reporting). This creates a limited after-deadline tail into late ’25/early ’26 but the program has sunset for new acquisitions. •Implication: Pull-forward demand helped Q3; near-term becomes tougher without the credit. ________________________________________ 📉 4) Rates & Credit Conditions — 6.5/10 (↔) •Rate-cut expectations have eased financing costs M/M, but absolute affordability still binds EV uptake. (Macro-sensitive; no single decisive print.) ________________________________________ 🎯 5) Affordable Model / Next-Gen Platform — 8.0/10 (↔) •Q3 deck emphasized Model 3/Y “Standard” variants to expand entry price points; true next-gen remains staged, with execution risk. ________________________________________ 🔋 6) Battery Cost & Margin Levers — 8.3/10 (↑) •What changed: Q3 total GAAP GM improved vs 1H; energy revenue +44% YoY; free cash flow ~$4.0B. Scale/learning and supply-chain localization called out. ________________________________________ ⚡ 7) Energy, AI & Optimus Optionality — 8.7/10 (↑) •Record storage deployments, Megapack 3 / Megablock unveiled; expanding AI inference/training and a U.S. semi-conductor deal noted. This is the clearest re-rating vector beyond autos. ________________________________________ 🛡️ 8) Safety, Regulatory & Governance Risk — 7.5/10 (risk) (↑ risk) •New NHTSA probe into FSD reporting/behavior escalates headline risk; audit scrutiny persists. Interpret higher score here as more material risk to multiple. ________________________________________ 🚩 9) Competition & Global Share — 6.2/10 (↔) •Competitive intensity in China/EU remains high; Q3 execution improved but pricing power still contested. ________________________________________ 🌐 10) Macro & Trade/Policy — 6.5/10 (↑) •Policy shifts (e.g., OBBB tax-credit sunset; tariff/trade uncertainty) remain a swing factor for cost & demand corridors. ________________________________________ ✅ 11) Commodities/Inputs — 5.5/10 (↔) •Mixed moves across lithium/nickel; no single driver eclipses execution/AI narrative near term. ________________________________________ Updated Catalyst Scorecard (ranked by impact) 1.Autonomous & Robotaxi Execution — 9.2 2.Energy, AI & Optimus Optionality — 8.7 3.EV Demand & Geographic Mix — 8.6 4.Battery Cost & Margin Levers — 8.3 5.Affordable Model / Next-Gen — 8.0 6.U.S. EV Incentives — 6.0 7.Rates & Credit — 6.5 8.Macro/Trade — 6.5 9.Competition/Share — 6.2 10.Safety/Reg/Gov Risk — 7.5 (risk flag) 11.Commodities — 5.5 (Key Q3 facts from Tesla’s deck; probe/tax-credit items from NHTSA/IRS reporting.) ________________________________________ 📊 Analyst Rankings & Price Targets •Street consensus (near-term 12-mo): ~$391 average target; consensus rating: Hold across ~46 firms. •Bull camp: Wedbush (Dan Ives) $600 PT (reiterated Nov-5; Street-high; thesis = embodied-AI/robotics optionality + robotaxi). Benchmark $475 Buy (post-Q3). •Cautious/negative: UBS $247 Sell (raised from $215 but still bearish on deliveries/margins). •Tape-check from Tesla: Q3-25 revenue $28.1B, non-GAAP EPS $0.50, record FCF, record deliveries & storage. (EPS miss vs some expectations; revenue beat.) ________________________________________ 🔍 Headlines that moved the needle •NHTSA opens new FSD probe (scope ~2.9M vehicles). •FSD v14 (Supervised) broad rollout; AI capacity to ~81k H100-eq; Bay Area robotaxi ride-hailing noted (Q3 deck). •OBBB EV tax credits sunset 9/30/25; binding-contract/time-of-sale guidance enables limited post-deadline claims. •Q3 print: record deliveries, record energy storage, record FCF; EPS light vs some models but narrative shifts to AI/energy. ________________________________________ 🧭 Technicals: Levels & Structure (weekly focus) Primary structure: since late-2022, TSLA’s traded inside a contracting wedge, with noteworthy compression into 2H-2025—typical of late-stage accumulation before a decisive break. Momentum divergences are improving on weekly frames even as price consolidates. ________________________________________ Key levels (spot-agnostic): •Support: $360–$370 (prior breakdown area/weekly shelf); $330–$345 (multi-touch base/pivot); $310–$320 (cycle risk zone). •Resistance: $405–$420 (range top & supply), $450–$475 (post-robotaxi pop zone / analyst PT cluster), $500 (psych), then $600–$650 (LT measured target band). •Roadmap Expect one more downside probe into $310–$320 in Q1-2026 to complete the wedge, then trend break and resume bull leg toward $600/$650 over the subsequent cycle (≈ ~100% off the projected low). •Risk markers: sustained weekly closes < $305 would postpone the “final low” timing and force a re-mark to the 200-week MA cluster; weekly closes > $475 accelerate the upside timing toward the $500/$600 handles. ________________________________________ Cases unchanged framework •Bull: Robotaxi expands to more metros, regulators settle into a supervised-AV regime, energy/AI scale continues; market re-rates to $475–$600 (Benchmark/Wedbush anchors). •Base: Solid execution across autos + energy, FCF stays healthy, autonomy rolls out cautiously under oversight; stock tracks Street $350–$400 band. •Bear: Delivery softness post-credit-sunset, tougher pricing in China/EU, or adverse NHTSA actions; retest of $300–$330 zone before trend resolution. ________________________________________ What to watch next (60–90 days) 1.NHTSA probe path and any software/recall remedies. 2.Robotaxi geographic expansion cadence and any shift from safety-monitor to remote-assist ops. 3.Energy bookings & Megapack 3/Megablock ramp against utility RFP calendars. 4.Delivery run-rate post-credit sunset and mix of Standard trims. ________________________________________🚗 TSLA Catalysts Ranking: Q1 2026 Outlook PT 600 USD 🤖 Autonomy Surge: Robotaxi pilots live in Austin & Bay Area; FSD v14 expanding fast. ⚡ Energy & AI Lift: Record storage deployments + AI training scale hitting 80k H100 eq. 🌍 EV Demand: Q3 deliveries & FCF at record highs, though EU/China pricing still tight. 🔋 Margins Recovering: Cost cuts & energy growth push GM ↑, strong cash generation. 💰 Tax Credit Fade: U.S. EV credits ended 9/30; only pre-deadline contracts still qualify. 📉 Rates & Macro: Fed easing helps affordability, but demand gap post-credits to watch. 🦾 Optimus & AI Story: Embodied-AI optionality now key to long-term re-rating. 🚨 Reg Risk: NHTSA probes ~2.9 M FSD cars—headline volatility risk persists. 🏁 Tech Map: Wedge compression since ’22 = accumulation; possible final low $310–$320 Q1-26. 🚀 LT Target: Bull cycle toward $600–$650, ≈ +100% from projected base.🎁Please hit the like button and 🎁Leave a comment to support our team!let me know your thoughts on the above in the comments section 🔥🏧🚀Ferrari (RACE) Catalyst Scorecard AND 2026 Outlook
ProjectSyndicate
تحلیل طلای هفته آینده: سطوح حیاتی حمایت و مقاومت برای معاملهگران
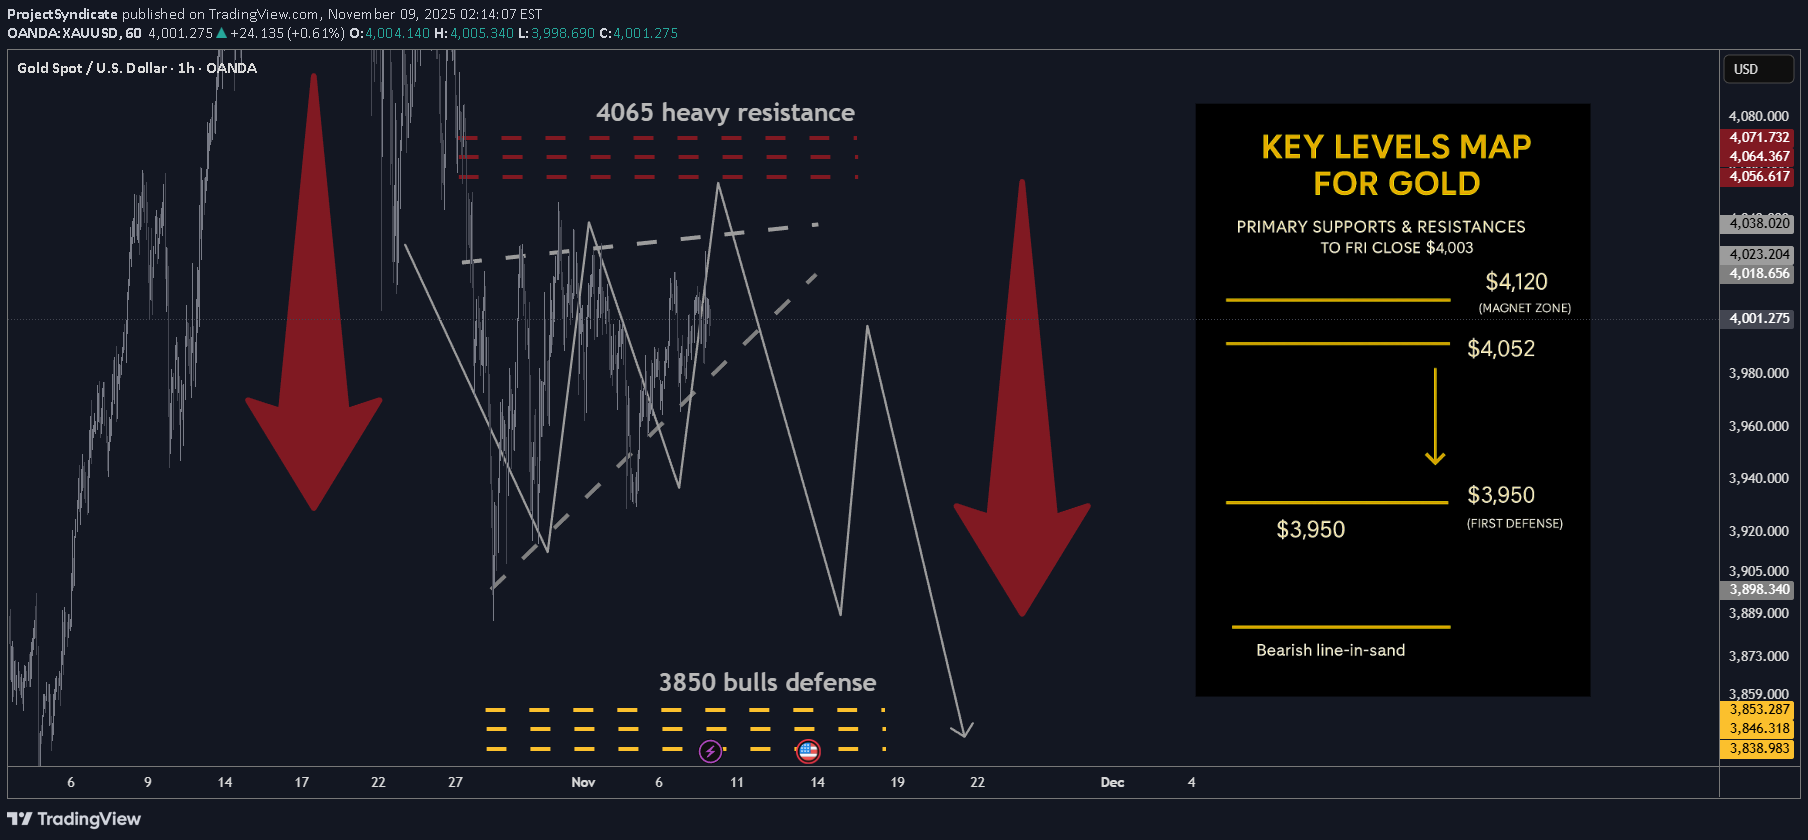
🔥 ALTIN HAFTALIK ANLIK GÖRÜNTÜ — PROJECTSYNDICATE TARAFINDAN 🏆 Yüksek/Kapanış: 4.024,9 Dolar → ~4.003 Dolar — satıcıların yükselişleri azaldı; haftalık kapanış yumuşak ancak 4 bin doların üzerinde. 📈 Trend: Aralık içinde nötr/hafif düzeltme; 4.080-4.120$'ın altındayken hemen yeni zirveler beklemiyoruz. 🛡 Destekler: 3.950 ABD Doları → 3.900 ABD Doları → 3.850 ABD Doları — ayıların kar alması ve kontrolü için önemli raflar. 🚧 Dirençler: 4.040 Dolar / 4.080 Dolar / 4.120 Dolar — tekrarlanan tedarik bölgeleri; solma için tercih edilen ilk dokunuşlar. 🧭 Gelecek hafta önyargı: Kısa pozisyonlar 4.040-4.120 dolara satılıyor; TP $3,950 ve ardından $3,850 (planınız). Sürekli geri alma durumunda geçersiz kılma > 4.120 – 4.175 ABD Doları; 3.850$'lık kayıp, uzatmanın daha düşük olması riskini taşıyor. 🌍 Makro arka rüzgarlar/karşı rüzgarlar (bu haftanın kaseti): •Anlatı tonu: Kitco, karışık görünümlerle (balon ve konsolidasyon) 4.000 $ civarında "jilet keskinliğini" işaretledi, diğer bir Kitco ise bu durumu "sağlıklı bir duraklama" olarak çerçeveledi. •WSJ flow: Manşetler “4.000 doların altına düşüşler” ile mütevazı yükselişler arasında gidip geliyordu; net okuma, hızlı iki yönlü ticaretle 4 bin dolar civarında konsolidasyondur. •Seviyeler: Spot haftayı 4 bin dolardan tamamladı; intrawEEK zirvesi hafta başında 4,02-4,03 bin dolarlık sınırı geçemedi. 🎯 Sokak görünümü: Geçen ayki 4.000 doların üzerindeki baskının ardından (ilk kez), WSJ'nin tonu sindirime kaydı; Yükselişler, üst direncin kararlı bir şekilde geri kazanılmasına kadar arz çekmeye devam ediyor. ________________________________________ 🔝 Anahtar Direnç Bölgeleri •4.040$ — acil tavan; haftalık yüksek yakınlık, muhtemelen ilk testleri sınırlayacak. • 4.080$ — son arızalardan kaynaklanan ikincil tedarik kesintisi. •4.120$ — üst bant; Buradaki kabul, düzeltmeyi etkisiz hale getirmeye başlar. 🛡 Destek Bölgeleri • 3.950$ — ilk savunma / ilk TP. • 3.900$ — yuvarlak rakamlı raf; kayıp momentum araştırmalarını davet eder. • 3.850$ — kritik yapısal taban ve ikinci TP; kırılma riskleri aşağı yönlü hızlanmadır. ________________________________________ ⚖️ Temel Durum Senaryosu Yükselen kama benzeri bir yapı içindeki sıkıştırma 3.850 ila 4.120 dolar arasında değişiyor. 4.040 $ – 4.120 $'a ilk itişler, 3.950 $ → 3.850 $'a doğru rotasyonlar için satılabilirken, piyasa haftalık düşük zirvelere saygı duyuyor. 🚀 Koparma / Arıza Tetikleyicileri • Boğa tetikleyicisi: Sürekli kabul > ~4.120$ – 4.175$, gidişatı tekrar yapıcı hale getirir ve 4.200$'ın üzerinde yeniden açılır. • Ayı tetikleyicisi: Günlük kapanış < 3.900 $, tam 3.850 $'lık test olasılığını artırır; 3.850 doların başarısızlığı ivme kaybı riskini taşıyor. 💡 İzlenecek Pazar Yönlendiricileri •Fed yolu / gerçek getiriler (WSJ kopyasındaki faiz indirimi ihtimalleri ve yapışkan enflasyon anlatımı). •USD dalgalanmaları (genel USD zayıflığı yok → yukarı yönlü girişimler duruyor). •ETF/CB akışları (Kitco röportajları bölünmüş hissiyatı vurguluyor; dip alıcıları aktif, momentum oyuncuları temkinli). •Olay riski (başlık hassasiyeti yüksek olmaya devam ediyor; dirence hızlı bir şekilde sıkışmak mümkün). 🔓 Boğa / Ayı Tetik Hatları •Yukarıdaki yükseliş: 4.120$ – 4.175$ (sürekli). •Aşağıdaki düşüş: 3.900 $ → 3.850 $ (risk 3.850 $'ın altına yayılır). 🧭 Bu haftanın stratejisi Dirençten kısa: 4.040 $ → 4.080 $ → 4.120 $ civarında ölçeklenebilir; TP #1: 3.950 Dolar; TP #2: 3.850 Dolar; Risk: Hard 4.120 doların üzerinde bir günlük kapanışta (veya yeniden teste devam eden gün içi ihlalde) durma. Haber odaklı bir sıkıştırma 4.175 doları etiketlerse ve başarısız olursa düzeltmeyi düşünün. 💰 4.024 Dolar → 4.003 Dolar — Haftalık kapanış 4 bin doların üzerinde sabit; Satıcılar yukarı yönlü hareket etti. ⚖️ Trend: Nötr/düzeltici; 4.080 ila 4.120 ABD Doları aralığının altında. 🏗 Yapı: Yükselen kama sıkışması – momentumun azalması. 🎯 Strateji: Kısa 4.040$ – 4.120$; 3.950 $ → 3.850 $’ı hedefliyor. 🧱 Destekler: 3.950 Dolar / 3.900 Dolar / 3.850 Dolar — ayıların kar alma bölgeleri. 🚧 Dirençler: 4.040 Dolar / 4.080 Dolar / 4.120 Dolar — tekrarlanan arz sınırları. 🌍 Makro tonu: WSJ ve Kitco — “4 bin dolara yakın konsolidasyon”, gerçek getiri sağlam, USD karışık. 🔥 Ayı tetikleyicisi: Günlük kapanış < 3.900 $ → 3.850 $ testini açar. 🚀 Boğa tetikleyicisi: Sürdürülebilir > 4.120$ – 4.175$ → tersine dönme riski. 🧭 Önyargı: Gücü sat, çevik kal; Yükselen kama = rallilerin azalması, düşüşlerde kar kaydetme.
ProjectSyndicate
پیشبینی طلای ۲۰۲۶: آیا اصلاح فعلی فرصت خرید نهایی قبل از صعود است؟
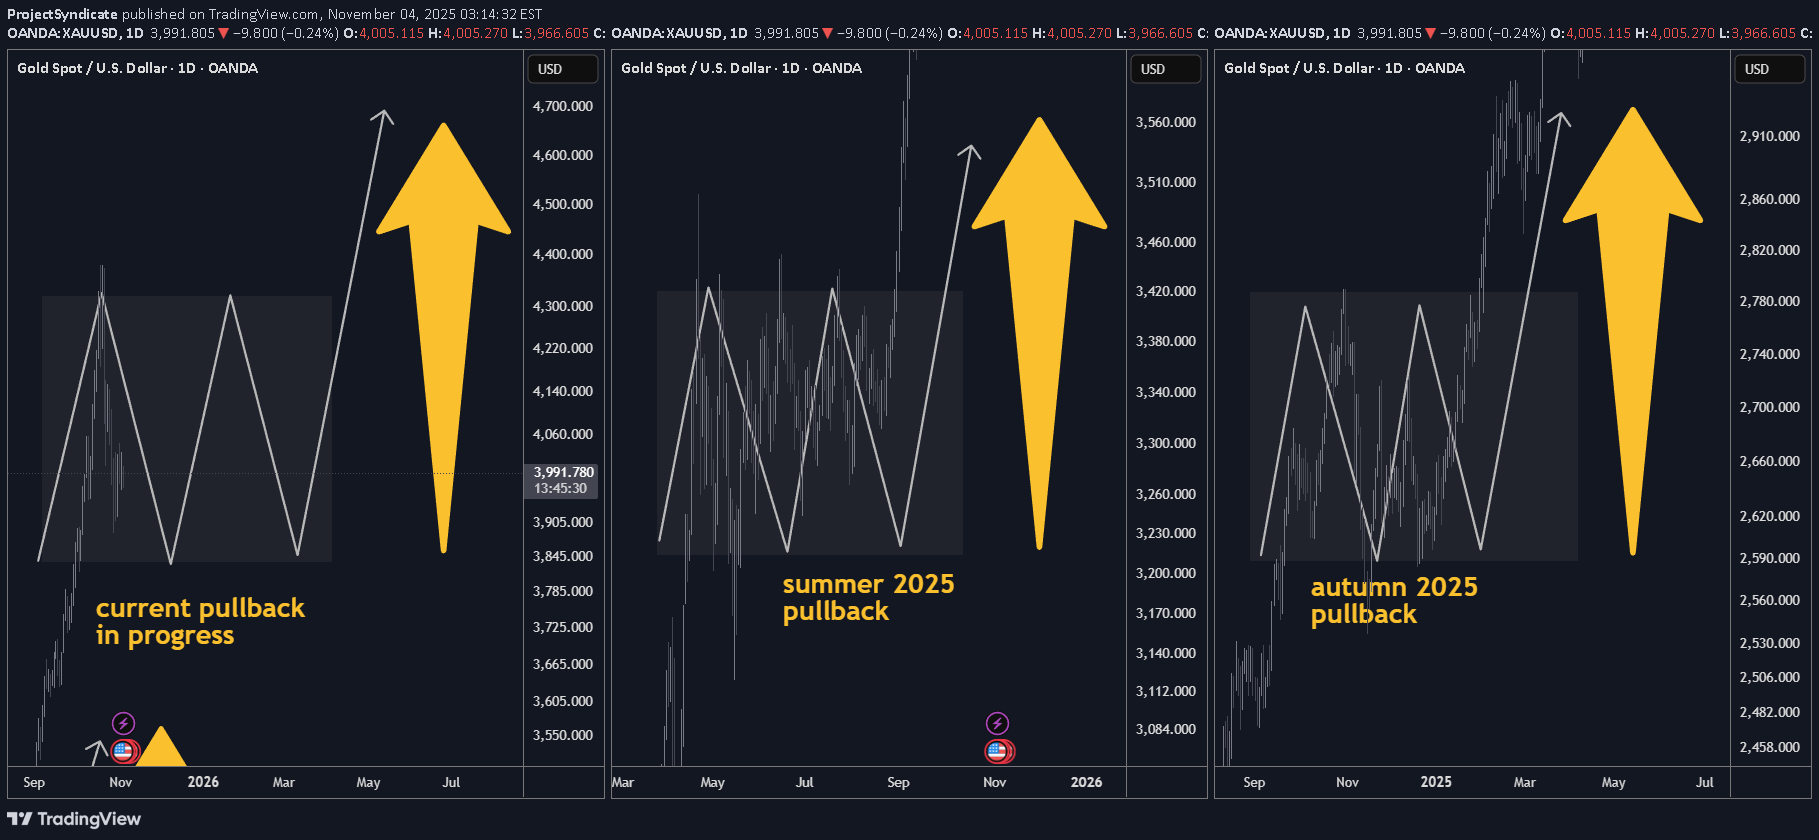
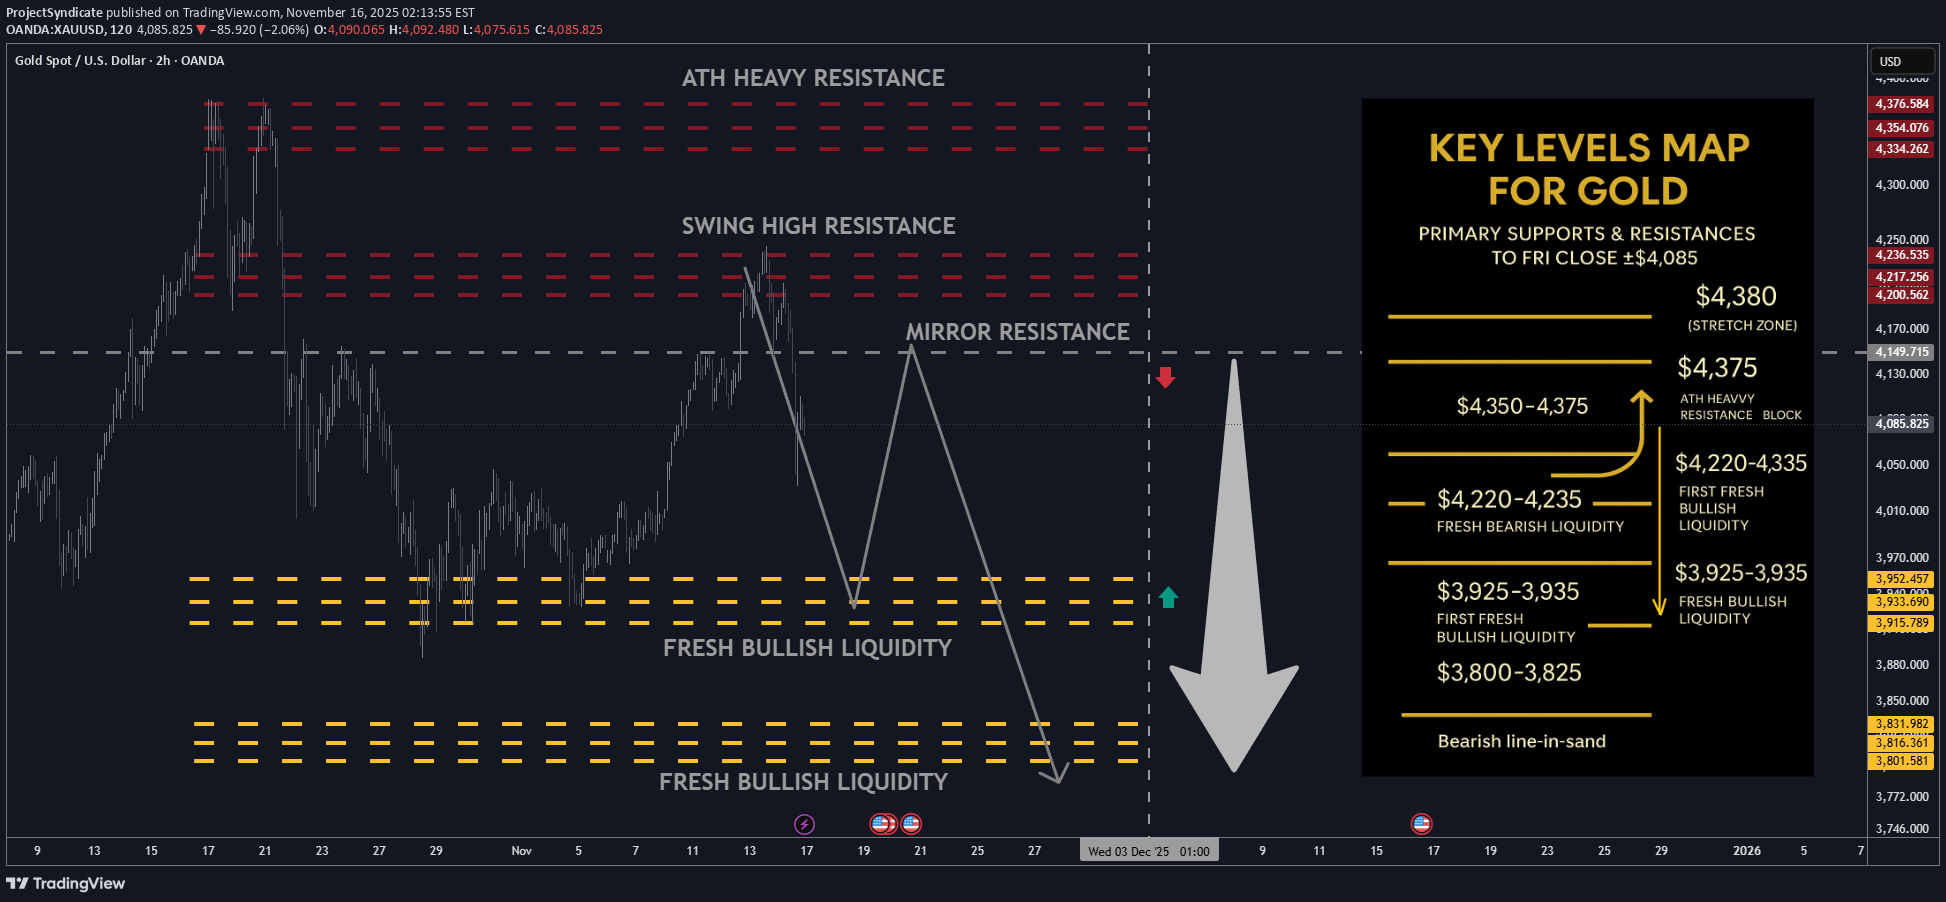
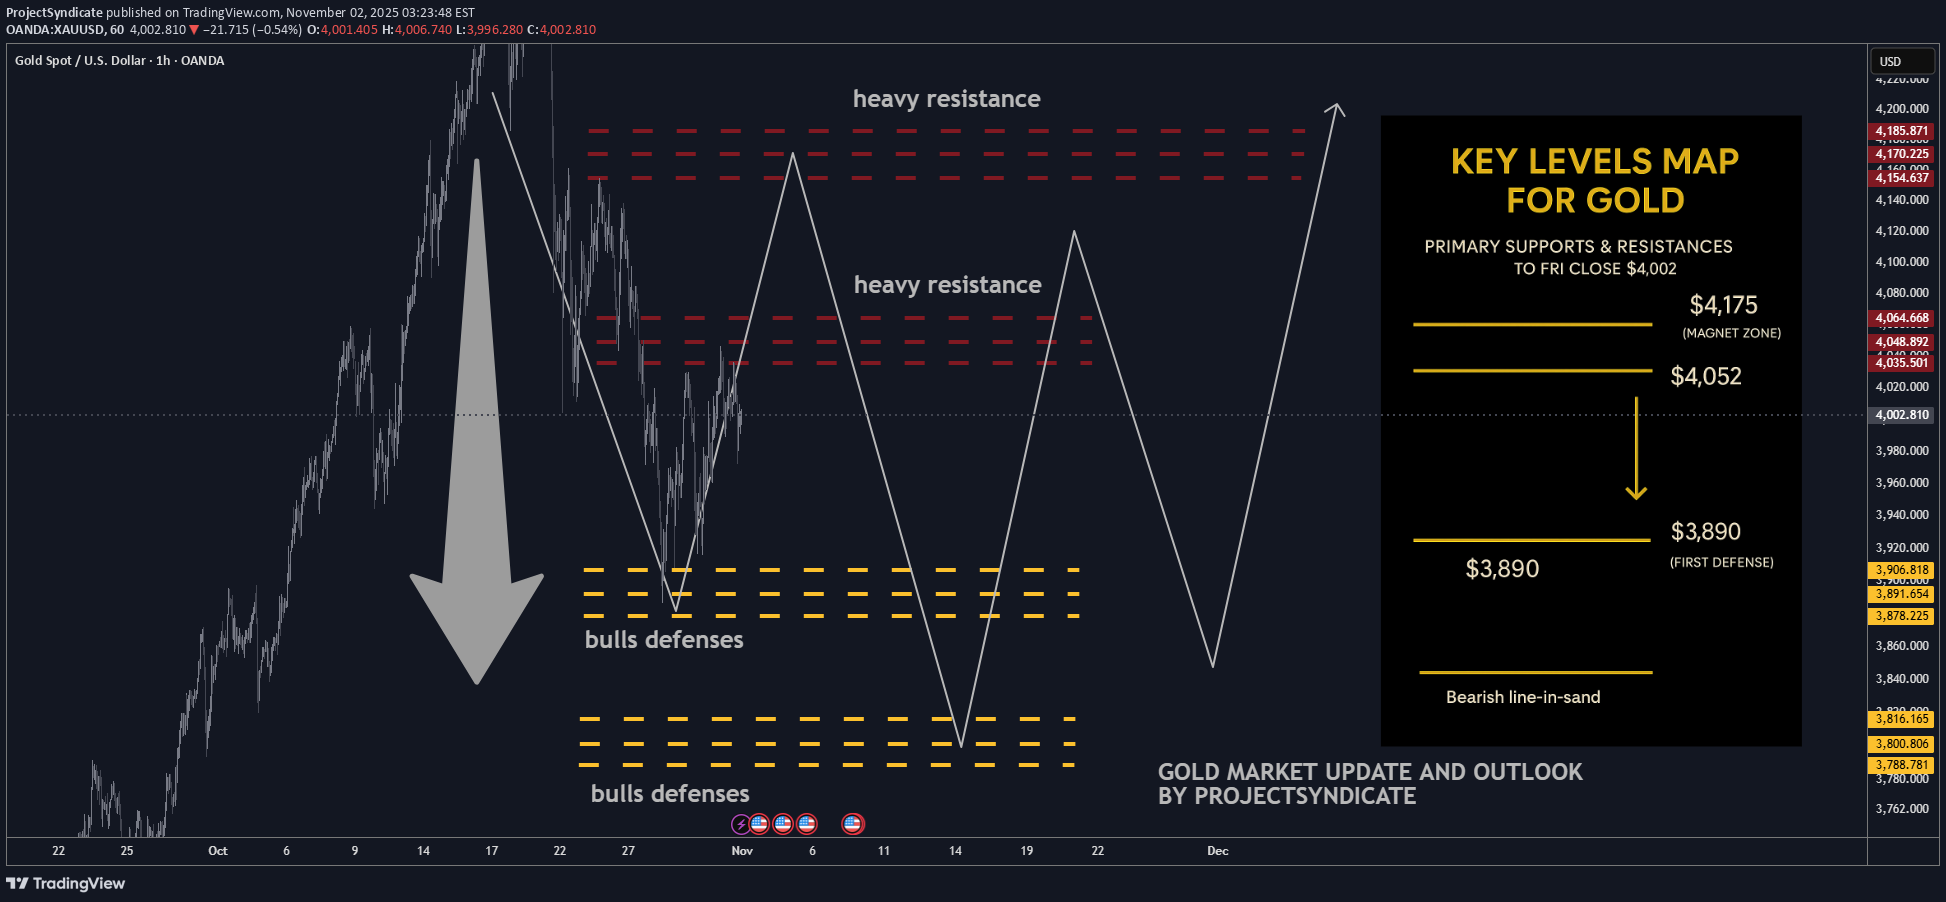
📌 Executive Summary •Base case (60%): The current pullback is a normal retracement within the primary bull trend. We expect consolidation through late Q4-2025 and potentially into January 2026, followed by a resumption of the uptrend in Q1/Q2-2026. •Drivers remain intact: Persistent central-bank accumulation, reserve-diversification dynamics, and episodic macro/geopolitical risk keep the structural bid under gold. •Positioning stance: Maintain core long exposure, add tactically on weakness into the $3.8k–$4.0k zone spot equivalent with tight risk controls, and ladder call spreads into Q2-2026. •Risk skew: Near-term pullback risk persists position shakeouts, macro data surprises. Structural bearish risks are low unless central-bank demand materially softens. ________________________________________ 🧭 Market Context & Recent Price Action •Gold printed successive record highs into mid-October; front-month futures traded above $4,170/oz before easing. Headlines framed the rally as policy and safe-haven led, with year-to-date gains exceptionally strong. •Central-bank demand continues to underpin the move: WGC and sell-side coverage highlight accelerating official-sector buying and diversification away from FX reserves; banks forecast higher prices into 2026. •The current setback aligns with prior bull-market pauses (e.g., Apr–Jul 2025 and Sep 2024–Dec 2024 pullbacks), consistent with the user-stated pattern of multi-month consolidations before trend resumption. What’s new in headlines late Oct–Nov 2025: •Pullback is “technical and temporary,” with buy-the-dip framing from UBS; next tactical target cited around $4,200. •Official-sector flows: Korea & Madagascar exploring reserve increases; PBoC extended buying streak into September. •WSJ coverage stresses gold’s role in erosion of trust in fiat/central banks and the reserve-diversification theme. ________________________________________ 🔑 Structural Bull Case 2025-2026 1.Official-Sector Accumulation: oMulti-year build in central-bank gold holdings (EM-led) as a sanctions-resilient reserve asset; this remains the single most important marginal buyer narrative. 2.Reserve Diversification & Financial Geopolitics: oEvidence that gold’s share of global reserves has risen while some institutions reassess currency composition. 3.Macro Volatility & Policy Trajectory: oPeriodic growth scares, policy pivots, and real-rate uncertainty sustain hedging demand. Street targets for late-2026 (e.g., ~$4,900 GS) anchor upside convexity. 4.Market Microstructure: oThin above prior highs and crowded shorts on pullbacks can fuel sharp upside re-accelerations when macro catalysts hit data, geopolitics, policy hints. ________________________________________ 📊 Technical Map Top-Down •Primary trend: Up. The sequence of higher highs/higher lows since 2024 remains intact; current move is a trend-within-trend consolidation. •Pullback anatomy: Prior bull pauses (Apr–Jul 2025; Sep–Dec 2024) lasted 2–4 months, with troughs forming on volatility compression and momentum washouts—a template for now. •Key tactical zones spot-equiv.: o$3,800–$4,000: First reload area prior breakout shelf / 50–61.8% of the last leg. o$4,200–$4,250: First resistance / re-acceleration trigger retests of breakdown pivots. o$4,350–$4,400: High congestion; decisive weekly close above here re-opens ATH extension. ________________________________________ 🗓️ Scenario Pathing Q4-2025 → Q2-2026 •Base Case 60% — “Consolidate then resume”: oSideways-to-lower into late Q4/Jan 2026 as positioning resets; range $3.8k–$4.2k. oBreakout resumption in Q1/Q2-2026 as macro and official flows re-assert. •Bullish Extension 25% — “Shallow dip, quick reclaim”: oSofter real yields / risk flare trigger swift recapture of $4.2k–$4.4k and new highs earlier in Q1-2026. oCatalysts: heavier central-bank prints, geopolitical shock, or earlier policy-easing rhetoric. •Bear-Risk 15% — “Deeper flush, trend intact”: oHawkish macro surprise or forced deleveraging drives $3.6k–$3.7k probes; structure holds unless official-sector demand meaningfully fades ________________________________________ 🧪 What to Watch High-Signal Indicators •Official-Sector Data: Monthly updates from WGC, IMF COFER clues, and PBoC reserve disclosures. Continuation of EM purchases = green light for the bull. •Rates & Liquidity: Real-rate direction and dollar liquidity conditions around data and policy communications. •Microstructure: CFTC positioning inflections, ETF out/in-flows a lagging but useful confirmation when they finally turn. •Asia Physical/Policy: China/Japan retail and wholesale dynamics; policy/tax headlines can create short-term volatility. ________________________________________ 🎯 Strategy & Implementation 1) Core: •Maintain strategic long allocation consistent with mandate e.g., 3–5% risk budget; avoid pro-cyclical reductions during orderly pullbacks. 2) Tactical Adds •Scale-in buy program within $3.8k–$4.0k •Optionality: Buy Q2-2026 call spreads (e.g., 4.2/4.8) on dips; fund via selling Q1-2026 downside put spreads around $3.6k–$3.7k where comfortable with assignment. 3) Risk Controls 🛡️: •Hard-stop any tactical adds on weekly close < ~$3.6k or if credible evidence emerges of official-sector demand reversal.🥇 Base Case: Normal pullback inside primary bull trend — consolidation likely till Jan ’26, rally resumes Q1/Q2 ’26. 💰 Drivers Intact: Central-bank buying, reserve diversification, & macro/geopolitical hedging sustain long-term bid. 🏦 CB Demand: PBoC, Korea, Madagascar add reserves; official-sector flows remain the key pillar. 📉 Current Pullback: Mirroring Apr–Jul ’25 & Sep–Dec ’24 pauses — 2-4 month digestion phase. 🪙 Tech Zones: Buy zone $3.8k–$4.0k | Resistance $4.2k | ATH trigger $4.35k–$4.4k. 📊 Scenario Path: 60% → Consolidate → Resume bull 25% → Quick reclaim > $4.2k 15% → Deeper flush $3.6k–$3.7k (trend intact). 🔔 Watch: WGC/PBoC data, real-rate trends, CFTC & ETF flows, Asia policy headlines. 🎯 Strategy: Maintain core long (3-5% risk); scale-in $3.8–$4.0k; add Q2-26 call spreads 4.2/4.8; hedge via Q1-26 put spreads. 🛡️ Risk Control: Cut if < $3.6k or CB demand fades — otherwise, stay gold & buy the dip.🎁Please hit the like button and 🎁Leave a comment to support our team!let me know your thoughts on the above in the comments section 🔥🏧🚀Gold Bull Market Outlook And Targets: 5000 USD/7500 USD🪙 GOLD WEEKLY SNAPSHOT — BY PROJECTSYNDICATE 🏆 High/Close: $4,030 → $4,000 — range compression after prior volatility; tighter, indecisive week. 📉 Trend: Uptrend softens but still above key pivot; buyers holding the line near $4,000. 🛡 Supports: $3,980 / $3,940 → $4,000 remains short-term must-hold. 🚧 Resistances: $4,040 / $4,080 / $4,120 → stretch $4,160. 🧭 Bias next week: Neutral-to-slightly bearish; muted tone favors range-trade between $3,940–$4,080. Re-acceleration only above $4,100. Break below $3,940 opens $3,900. 🌍 Macro backdrop: Fed cut odds steady; USD/yields drift; central-bank demand resilient. No strong catalyst seen — expect quieter consolidation week.Gold next week: Key S/R Levels and Outlook for TradersGold next week: Key S/R Levels and Outlook for TradersGold next week: Key S/R Levels and Outlook for TradersWhy Manual Forex Trading Is Officially Dead🏅 GOLD WEEKLY SUMMARY — SHORT THE RIPS 🪙 Trend: Uptrend intact long-term, but near-term tape turning distributive. 🏔️ Key Sell Zone: $4,220–$4,320 — prime area to short rips into supply. 🐻 Bear Liquidity: $4,350 (fresh liquidity) → expect rejection / reversal. 📉 Stretch Stop-Run: $4,380 — only hit on squeeze; short bias still valid below here. 📊 Downside Targets: $4,060 → $4,000 → $3,960. 🛡️ Major Support: $3,930–$3,940 bullish block (HTF buyers defend). ⛔ Bear Expansion: Break below $3,930 = opens $3,880–$3,850. 💱 Macro: Lower real yields + softer USD = supportive but not enough to chase highs. 🏦 Flows: Strong central-bank buying keeps floor firm but upside crowded. 🎯 Strategy: Fade all strength into $4,220–$4,350; take profits down into $4,060–$3,960.Gold next week Key S/R Levels and Outlook for TradersBOOM DONE
ProjectSyndicate
تحلیل طلا هفته آینده: سطوح حیاتی حمایت و مقاومت و پیشبینی معاملهگران
🔥 ALTIN HAFTALIK ANLIK GÖRÜNTÜ — PROJECTSYNDICATE TARAFINDAN 🏆 Yüksek/Kapanış: 4.108 Dolar → ~ 4.002 Dolar — satıcılar genel giderleri savundu; Haftalık kapanış yumuşak aralıkta. 📈 Trend: Nötr / düzeltme modu hala AÇIK; yakın vadede yeni zirveler beklemiyoruz. 🛡 Destekler: 3.890 $ → 3.800 $ — olumsuz etkilerin kontrol altına alınması için önemli raflar. 🚧 Dirençler: 4.052 Dolar / 4.175 Dolar — tedarik / zayıflama girişimleri için mıknatıs bölgeleri. 🧭 Gelecek hafta önyargı: 3.890 $ → 3.800 $ yönünde kar alma ile 4.052 $ – 4.175 $ arası açığa satışları tercih edin. Sürekli geri alma durumunda geçersiz kılma > 4.175 ABD Doları; 3.800 doların başarısızlığı, daha düşük bir uzatma riski taşıyor. 🌍 Makro arka rüzgarlar/karşı rüzgarlar: • Oranlar: Reel getiriler istikrarlı-sağlam yükselişi kontrol altında tutuyor; Herhangi bir güvercin sürpriz, direnişe doğru sıkışmalara yol açabilir. • FX: DXY karışık—genel USD zayıflığının olmaması, ivmenin devamını sınırlıyor. • Akışlar: CB/ETF talebi deep düşüşlerde destekleyici ancak zirvelere yakın sakin. • Jeopolitik: Olay riski aralıklı teklifler sağlar; bu hafta trend sürücüsü değil. 🎯 Sokak görünümü: Orta vadeli yükseliş söylemleri rezerv çeşitlendirmesini ve 2026'ya kadar politika gevşemesini sürdürüyor, ancak kısa vadeli bant direnç altında ortalamaya geri dönüşü destekliyor. ________________________________________ 🔝 Anahtar Direnç Bölgeleri • 4.052 Dolar — acil tavan; Önceki tedarik pivotunun ilk testleri sınırlaması muhtemel • 4.175 Dolar — üst direnç; Yukarıdaki kabul, tonu düzelticiden yapıcıya çevirir 🛡 Destek Bölgeleri • 3.890 Dolar — ilk savunma; kayıp momentum araştırmalarını davet ediyor • 3.800 Dolar — kritik yapısal temel; kırılma riskleri aşağı yönlü hızlanma ________________________________________ ⚖️ Temel Durum Senaryosu Aralıktan yumuşak ticarete 3.800 ila 4.175 dolar aralığında. 4.052-4.175 Dolar arasındaki rallilerde satılabilir; Satıcıların baskı yapması durumunda rotasyonların 3.890 dolara geri dönmesini ve kapsamın 3.800 dolara çıkmasını bekliyoruz. 🚀 Koparma Tetikleyici Yalnızca ~4.175$'ın üzerinde kalıcı bir kabul, düzeltmeyi geçersiz kılar ve 4.200$'ın üzerinde yolu açar; tersine, günlük kapanış < 3.890 $ iken 4.052 $'dan kesin olarak reddedilmesi, 3.800 $'lık bir test olasılığını artırır. 💡 Pazarın Yönlendiricileri • Fed yolu ve reel getiri drift • USD endeksi dalgalanmaları • Düşüşlere ve yükselişlere karşı ETF/CB flow tonu • Risk duyarlılığı manşetleri (jeopolitik/ticaret) 🔓 Boğa / Ayı Tetik Hatları • Yukarı yönlü yükseliş: 4.175$'lık düzeltme aşamasının devam etmesi muhtemel • Aşağı yönlü düşüş: 3.890$ → risk 3.800$'ın altına genişliyor 🧭 Strateji Genel dirençlerden açığa satış (4.052 $ → 4.175 $). Kârları 3.890 ABD Dolarına, ardından 3.800 ABD Dolarına ölçeklendirin; Tetik seviyelerinin üzerinde stopları sıkı tutun. 4.175 doların üzerinde sürdürülebilir toparlanma ivme kazanana kadar yeni uzun pozisyonlardan uzak durun.
Sorumluluk Reddi
Sahmeto'nun web sitesinde ve resmi iletişim kanallarında yer alan herhangi bir içerik ve materyal, kişisel görüşlerin ve analizlerin bir derlemesidir ve bağlayıcı değildir. Borsa ve kripto para piyasasına alım, satım, giriş veya çıkış için herhangi bir tavsiye oluşturmazlar. Ayrıca, web sitesinde ve kanallarda yer alan tüm haberler ve analizler, yalnızca resmi ve gayri resmi yerli ve yabancı kaynaklardan yeniden yayınlanan bilgilerdir ve söz konusu içeriğin kullanıcılarının materyallerin orijinalliğini ve doğruluğunu takip etmekten ve sağlamaktan sorumlu olduğu açıktır. Bu nedenle, sorumluluk reddedilirken, sermaye piyasası ve kripto para piyasasındaki herhangi bir karar verme, eylem ve olası kar ve zarar sorumluluğunun yatırımcıya ait olduğu beyan edilir.