
CRYPTOMOJO_TA
@t_CRYPTOMOJO_TA

Ne tavsiye etmek istersiniz?
önceki makale
پیام های تریدر
filtre
CRYPTOMOJO_TA
CRV شکست خط روند نزولی: آیا زمان پرواز فرا رسیده است؟

CRV düşüş trendini kırdı. Büyük hamleler genellikle bu şekilde başlar. 👀 Eğer kırılma devam ederse uçarız. 🚀
CRYPTOMOJO_TA
شکست خط روند FET: آیا قیمت به ۰.۴۰ دلار میرسد؟

FET sonunda trend çizgisini kırdı. 🚀 Desteği tersine çevirdik, EMA'lar yukarıya döndü ve alıcılar geri adım atıyor. Fiyat bu kırılmanın üzerinde kaldığı sürece, 0,35-0,40 dolara doğru yükseliş söz konusu olabilir. Momentum artıyor. 👀
CRYPTOMOJO_TA
دوج کوین ترکید! آیا این روند صعودی جدید است؟ (هدف بعدی ۰.۱۵ دلار)

#DOGE az önce patlak verdi. 🚀 Düşüş trendi nihayet sona erdi ve momentum yükselişe geçiyor. Fiyat kırılmanın üzerinde kaldığı sürece bir sonraki hedef 0,15 dolar olacak. Güçlü görünüyor. 👀
CRYPTOMOJO_TA
نقطه عطف حیاتی SUI: آیا اوج میگیرد یا سقوط میکند؟
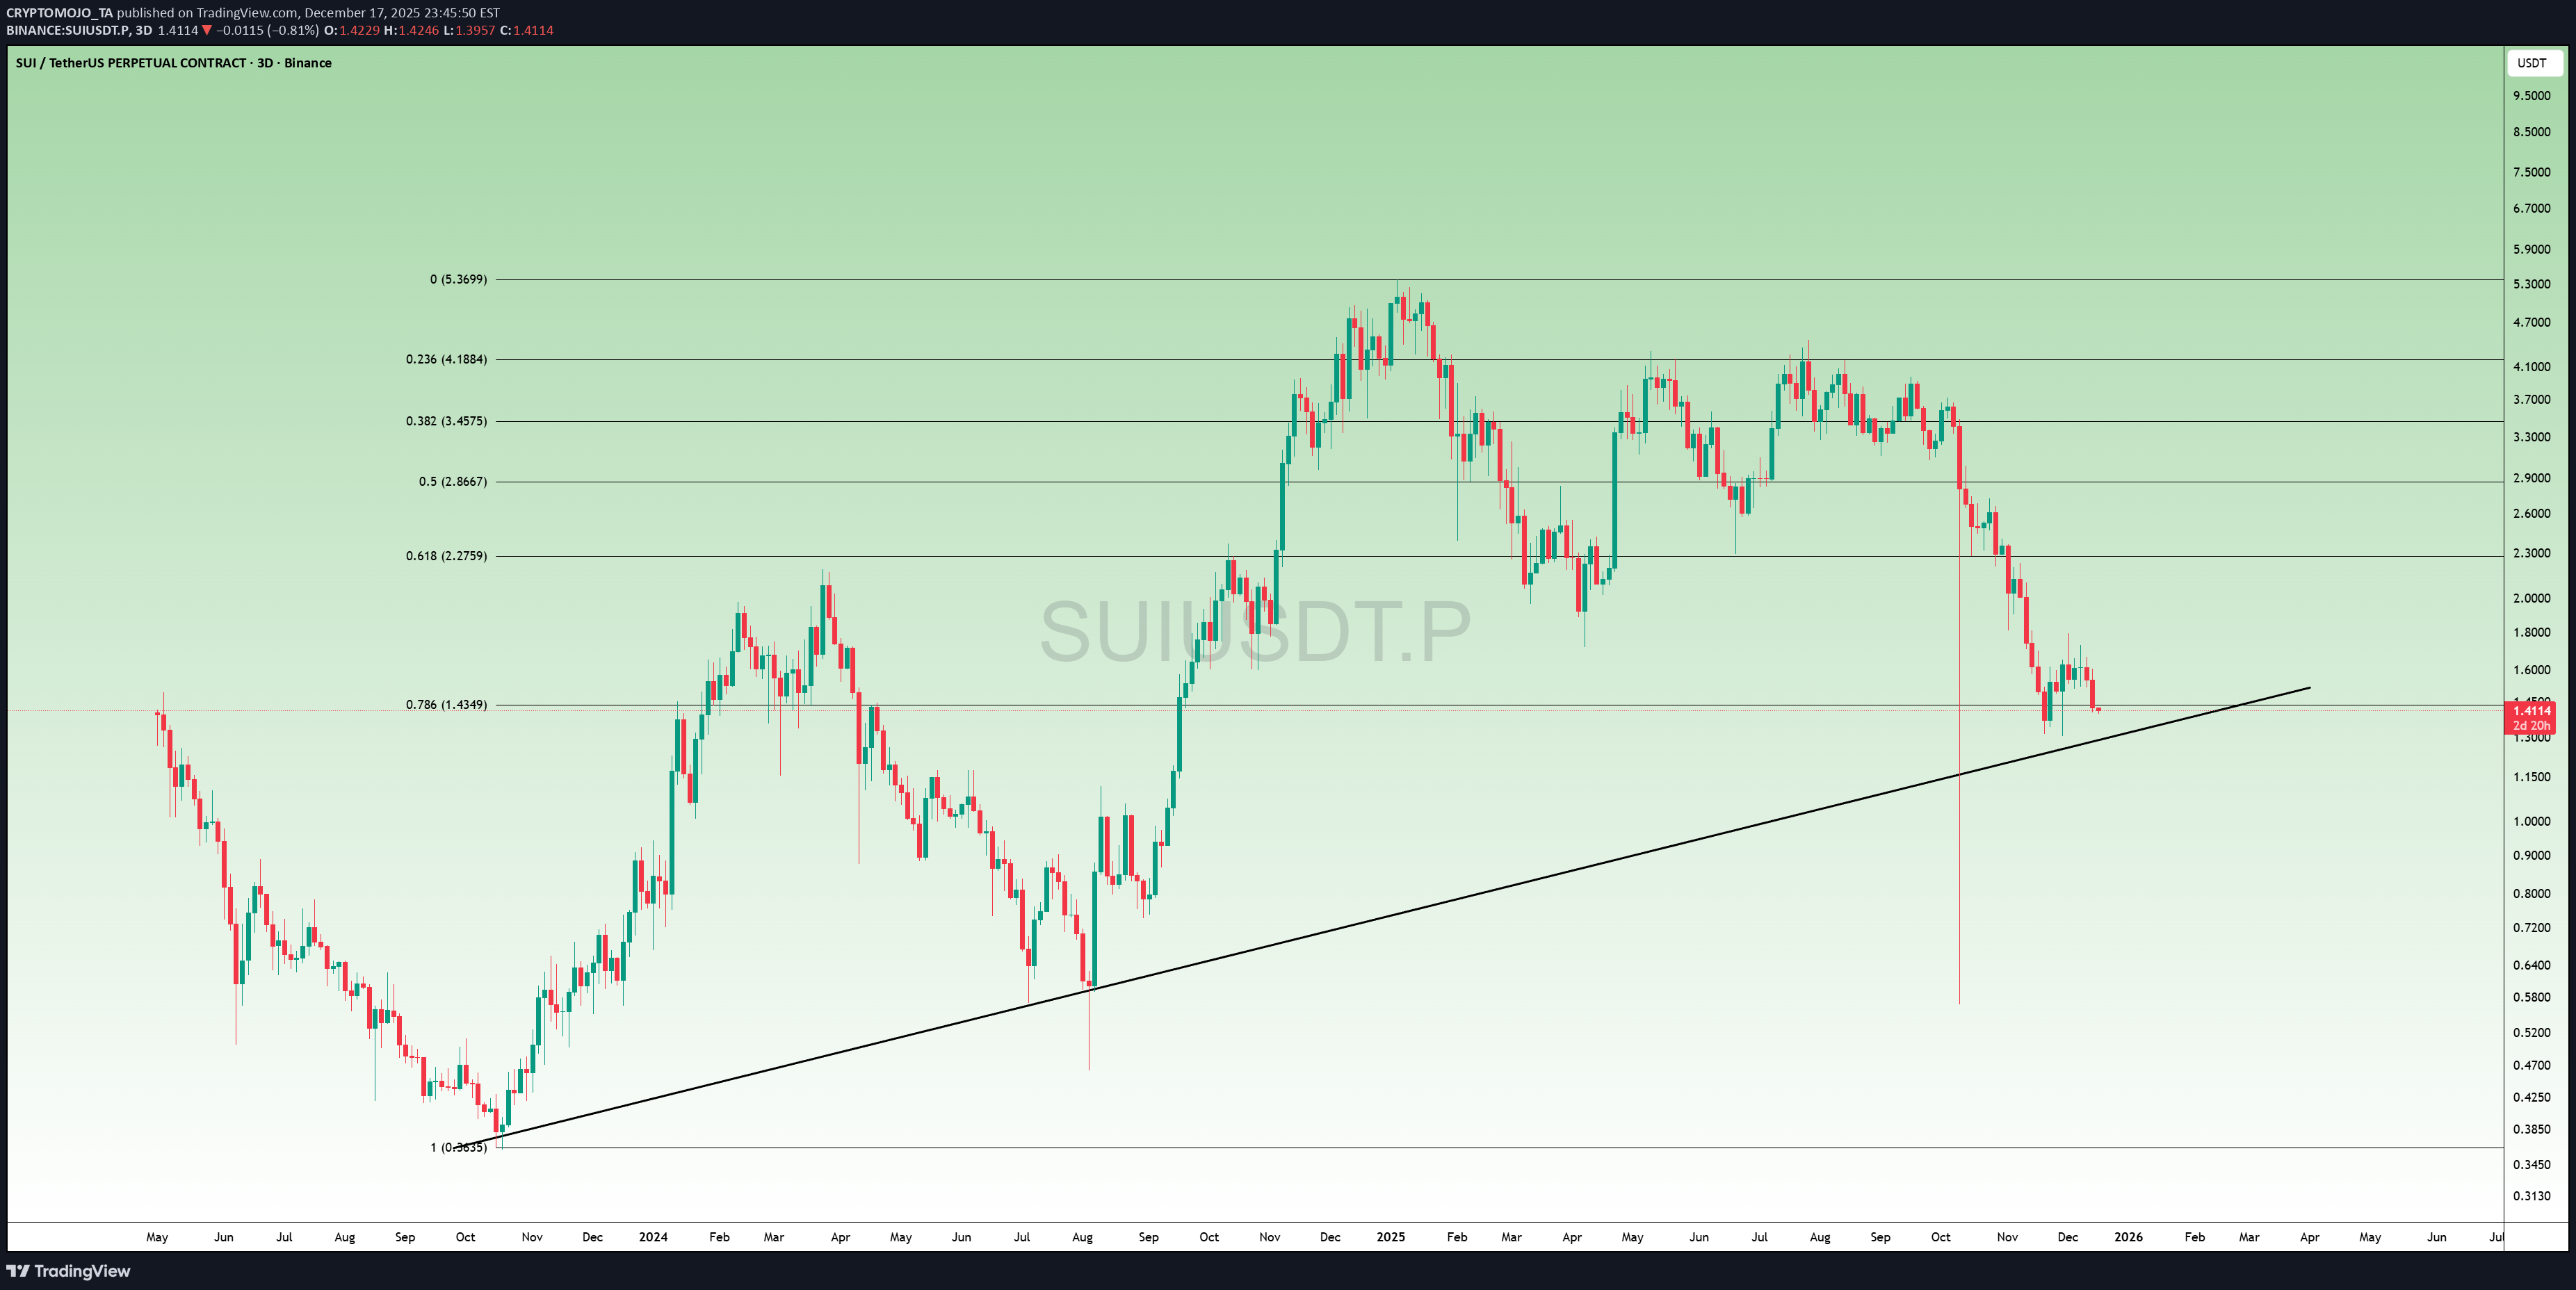
#SUI şu anda major uzun vadeli trend çizgisinde yer alıyor ve bu seviye lansmandan bu yana korundu. 👀 Fiyat bu trend çizgisine her dokunduğunda SUI güçlü bir move yükseliş başlattı. Tekrar buraya geri döndük… tam destek + 0,786 Fib bölgesinin yakınında. Alıcılar devreye girerse, bir sonraki temel hedef 2,2 Dolar → 2,8 Dolara doğru bir sıçrama olacaktır. Eğer bu seviye kırılırsa ancak o zaman daha aşağı bakarız. SUI için büyük an. Uyanık kalın. #Kripto
CRYPTOMOJO_TA
CRYPTOMOJO_TA
QNT's Big Move Is Coming!
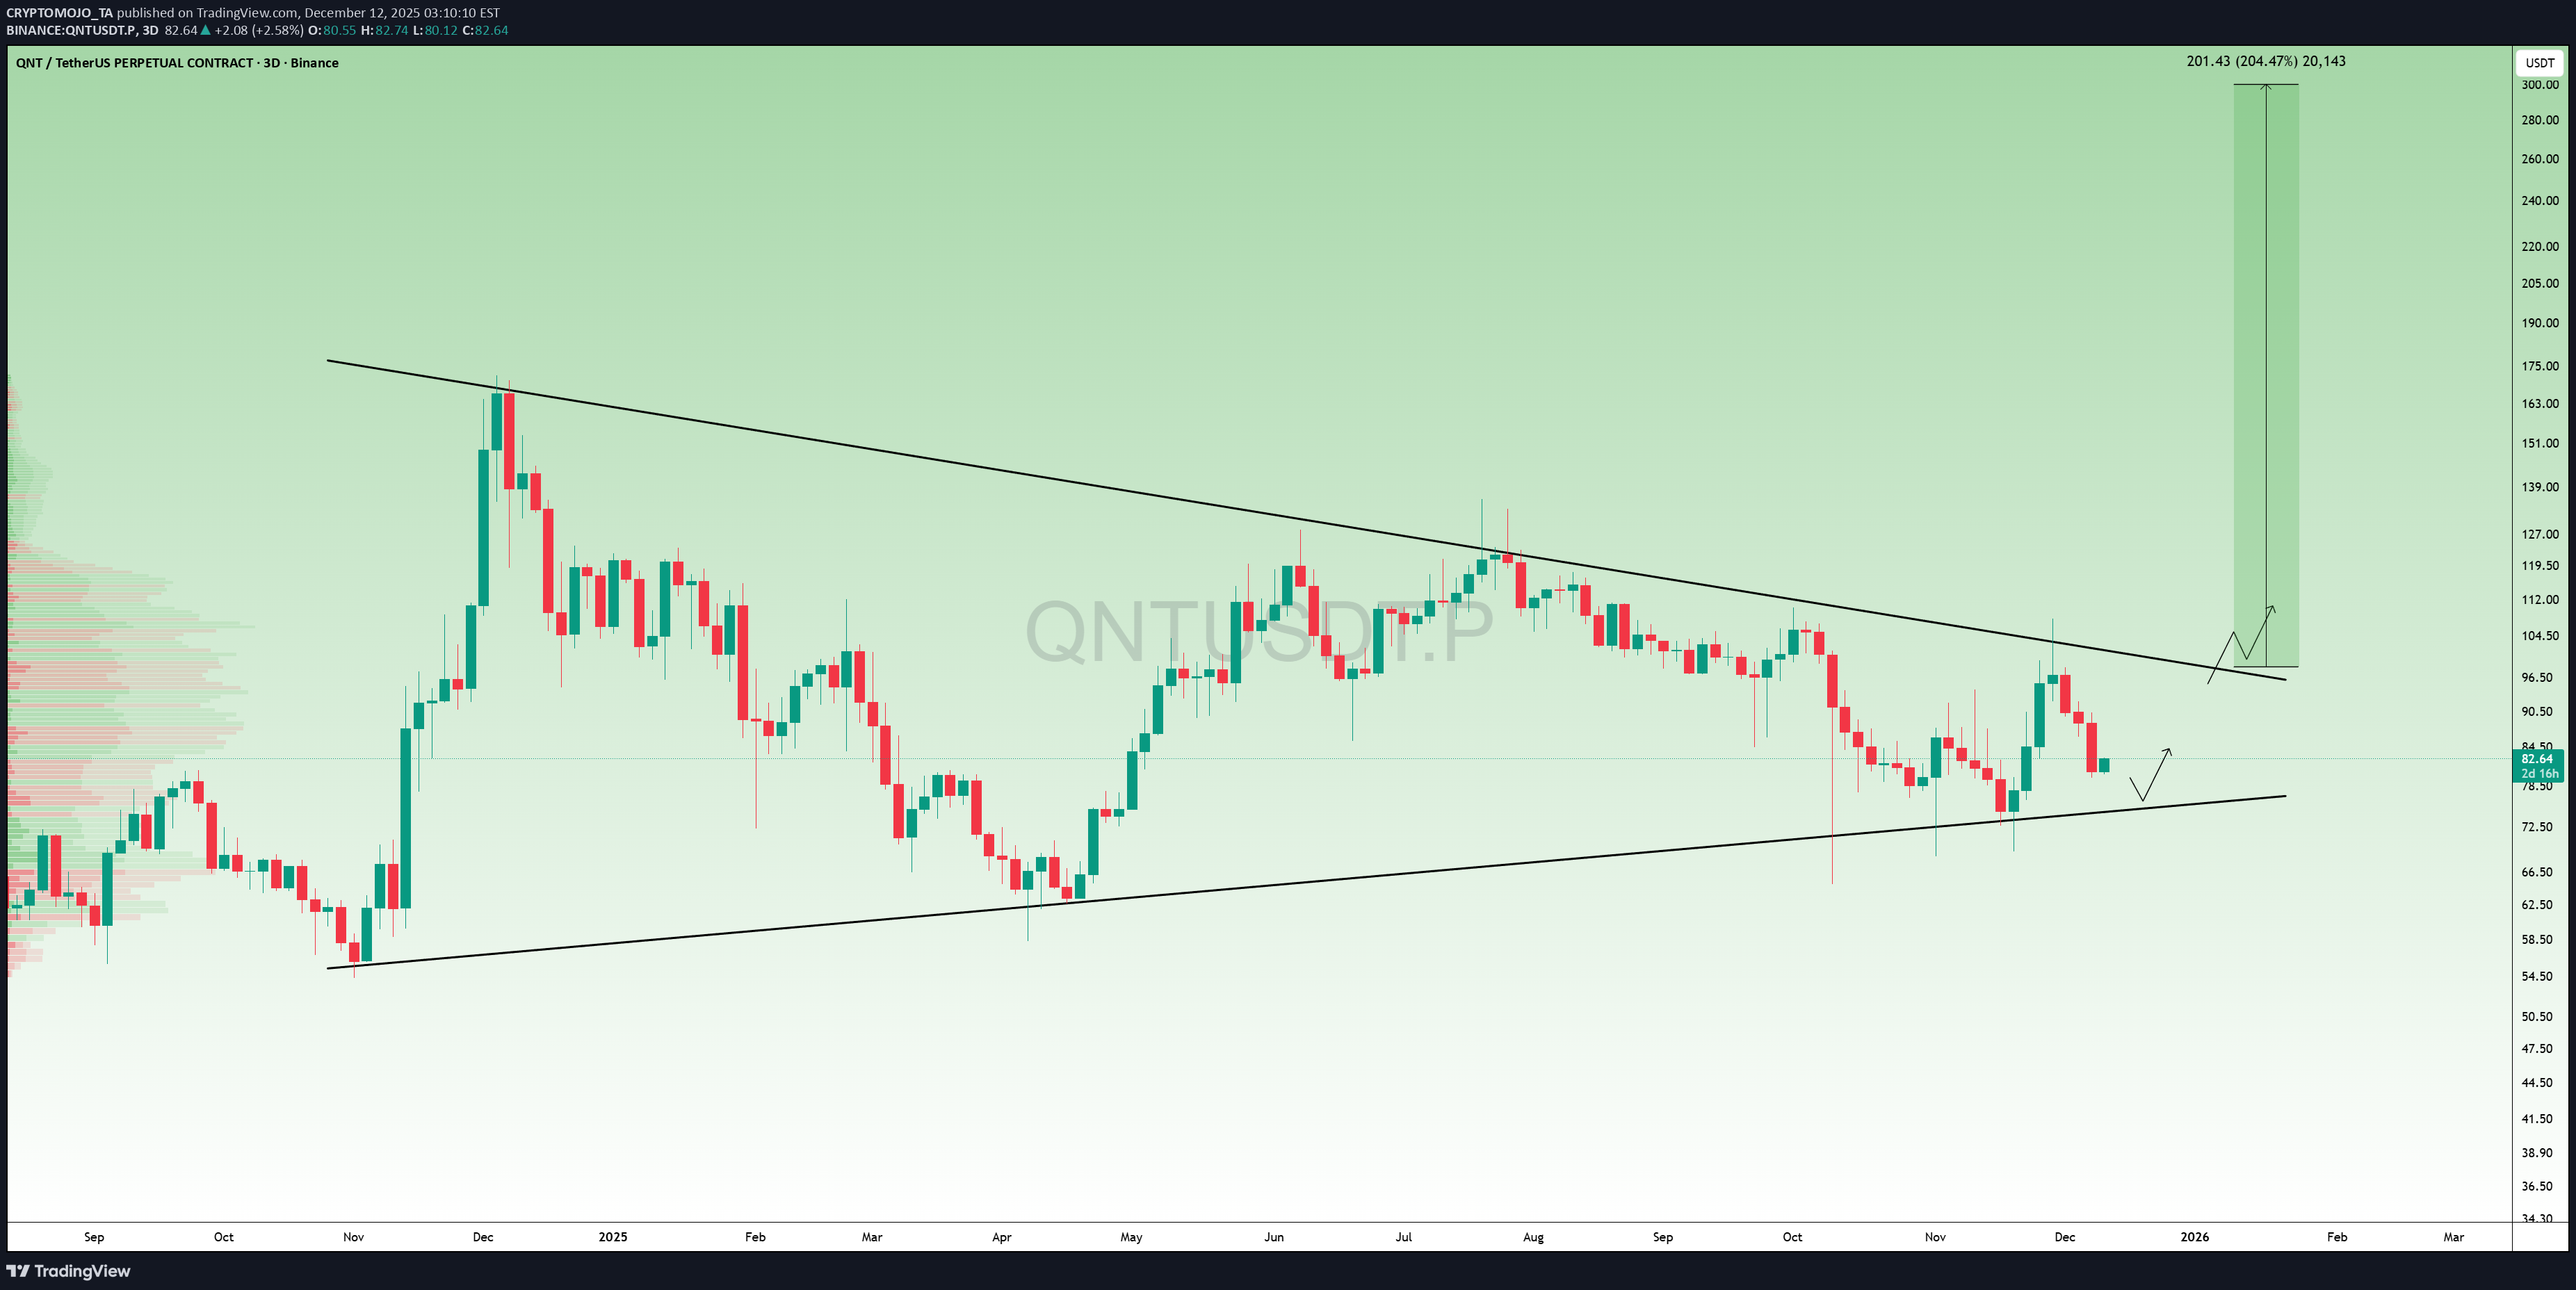
QNT sessizce piyasadaki en temiz makro modellerden birini oluşturuyor. Fiyat bir yıldan fazladır bu devasa düşen takozun içinde sıkışıp kalıyor… Ve QNT alt trend çizgisine her dokunduğunda hard sıçradı. Artık kırılma bölgesine yaklaşıyoruz. Buradan bir kırılma, 250-300$ aralığına doğru %200 move işaret ediyor. Finansal tavsiye değil, sadece grafiğe saygı duyuyorum. Bu bir sürü insanı şaşırtabilir.
CRYPTOMOJO_TA
LINK at Critical Bounce Point, Historically Where Rallies Begin
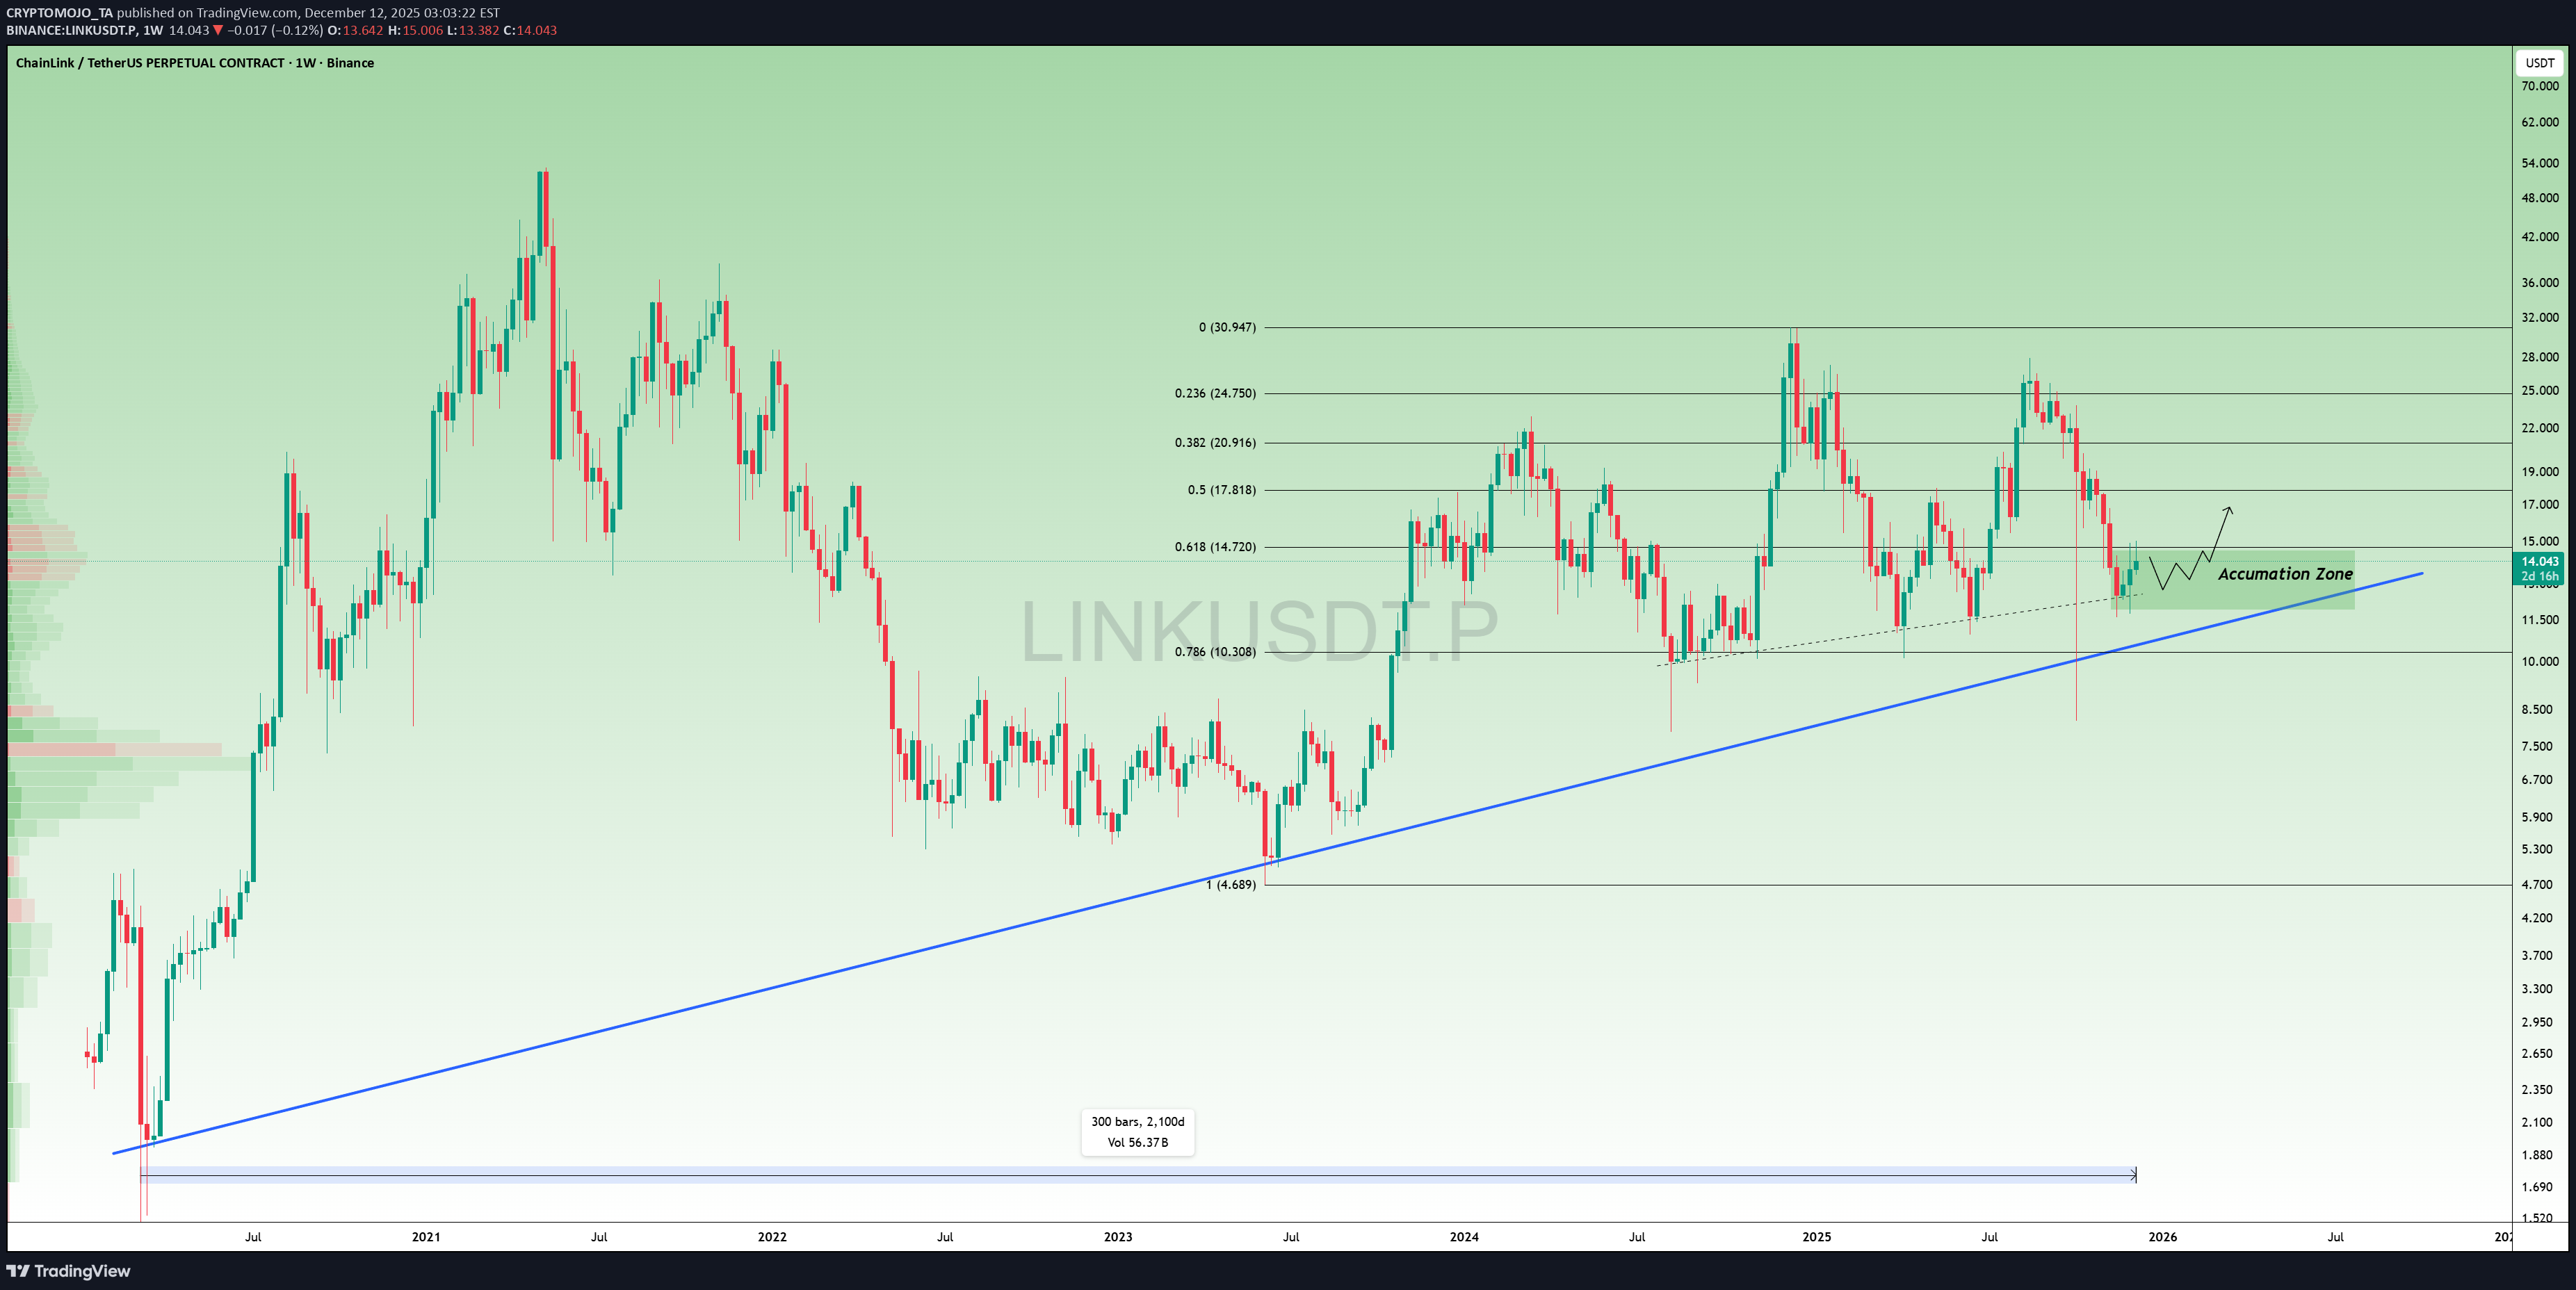
LINK grafikteki en güçlü birikim bölgelerinden birine geri döndü. Bu trend çizgisi neredeyse 5 yıldır devam ediyor ve her dokunuş major move yükselişe yol açtı. Fiyat şu anda tam desteğin üzerinde bulunuyor ve 0,618/0,786 Fib, akıllı paranın genellikle yüklendiği bir bölgeyi dengeliyor. LINK burada tutulursa, 17-21$'a doğru bir geri çekilme masada. Burası büyük hareketlerin sıklıkla başladığı alandır.
CRYPTOMOJO_TA
CRYPTOMOJO_TA
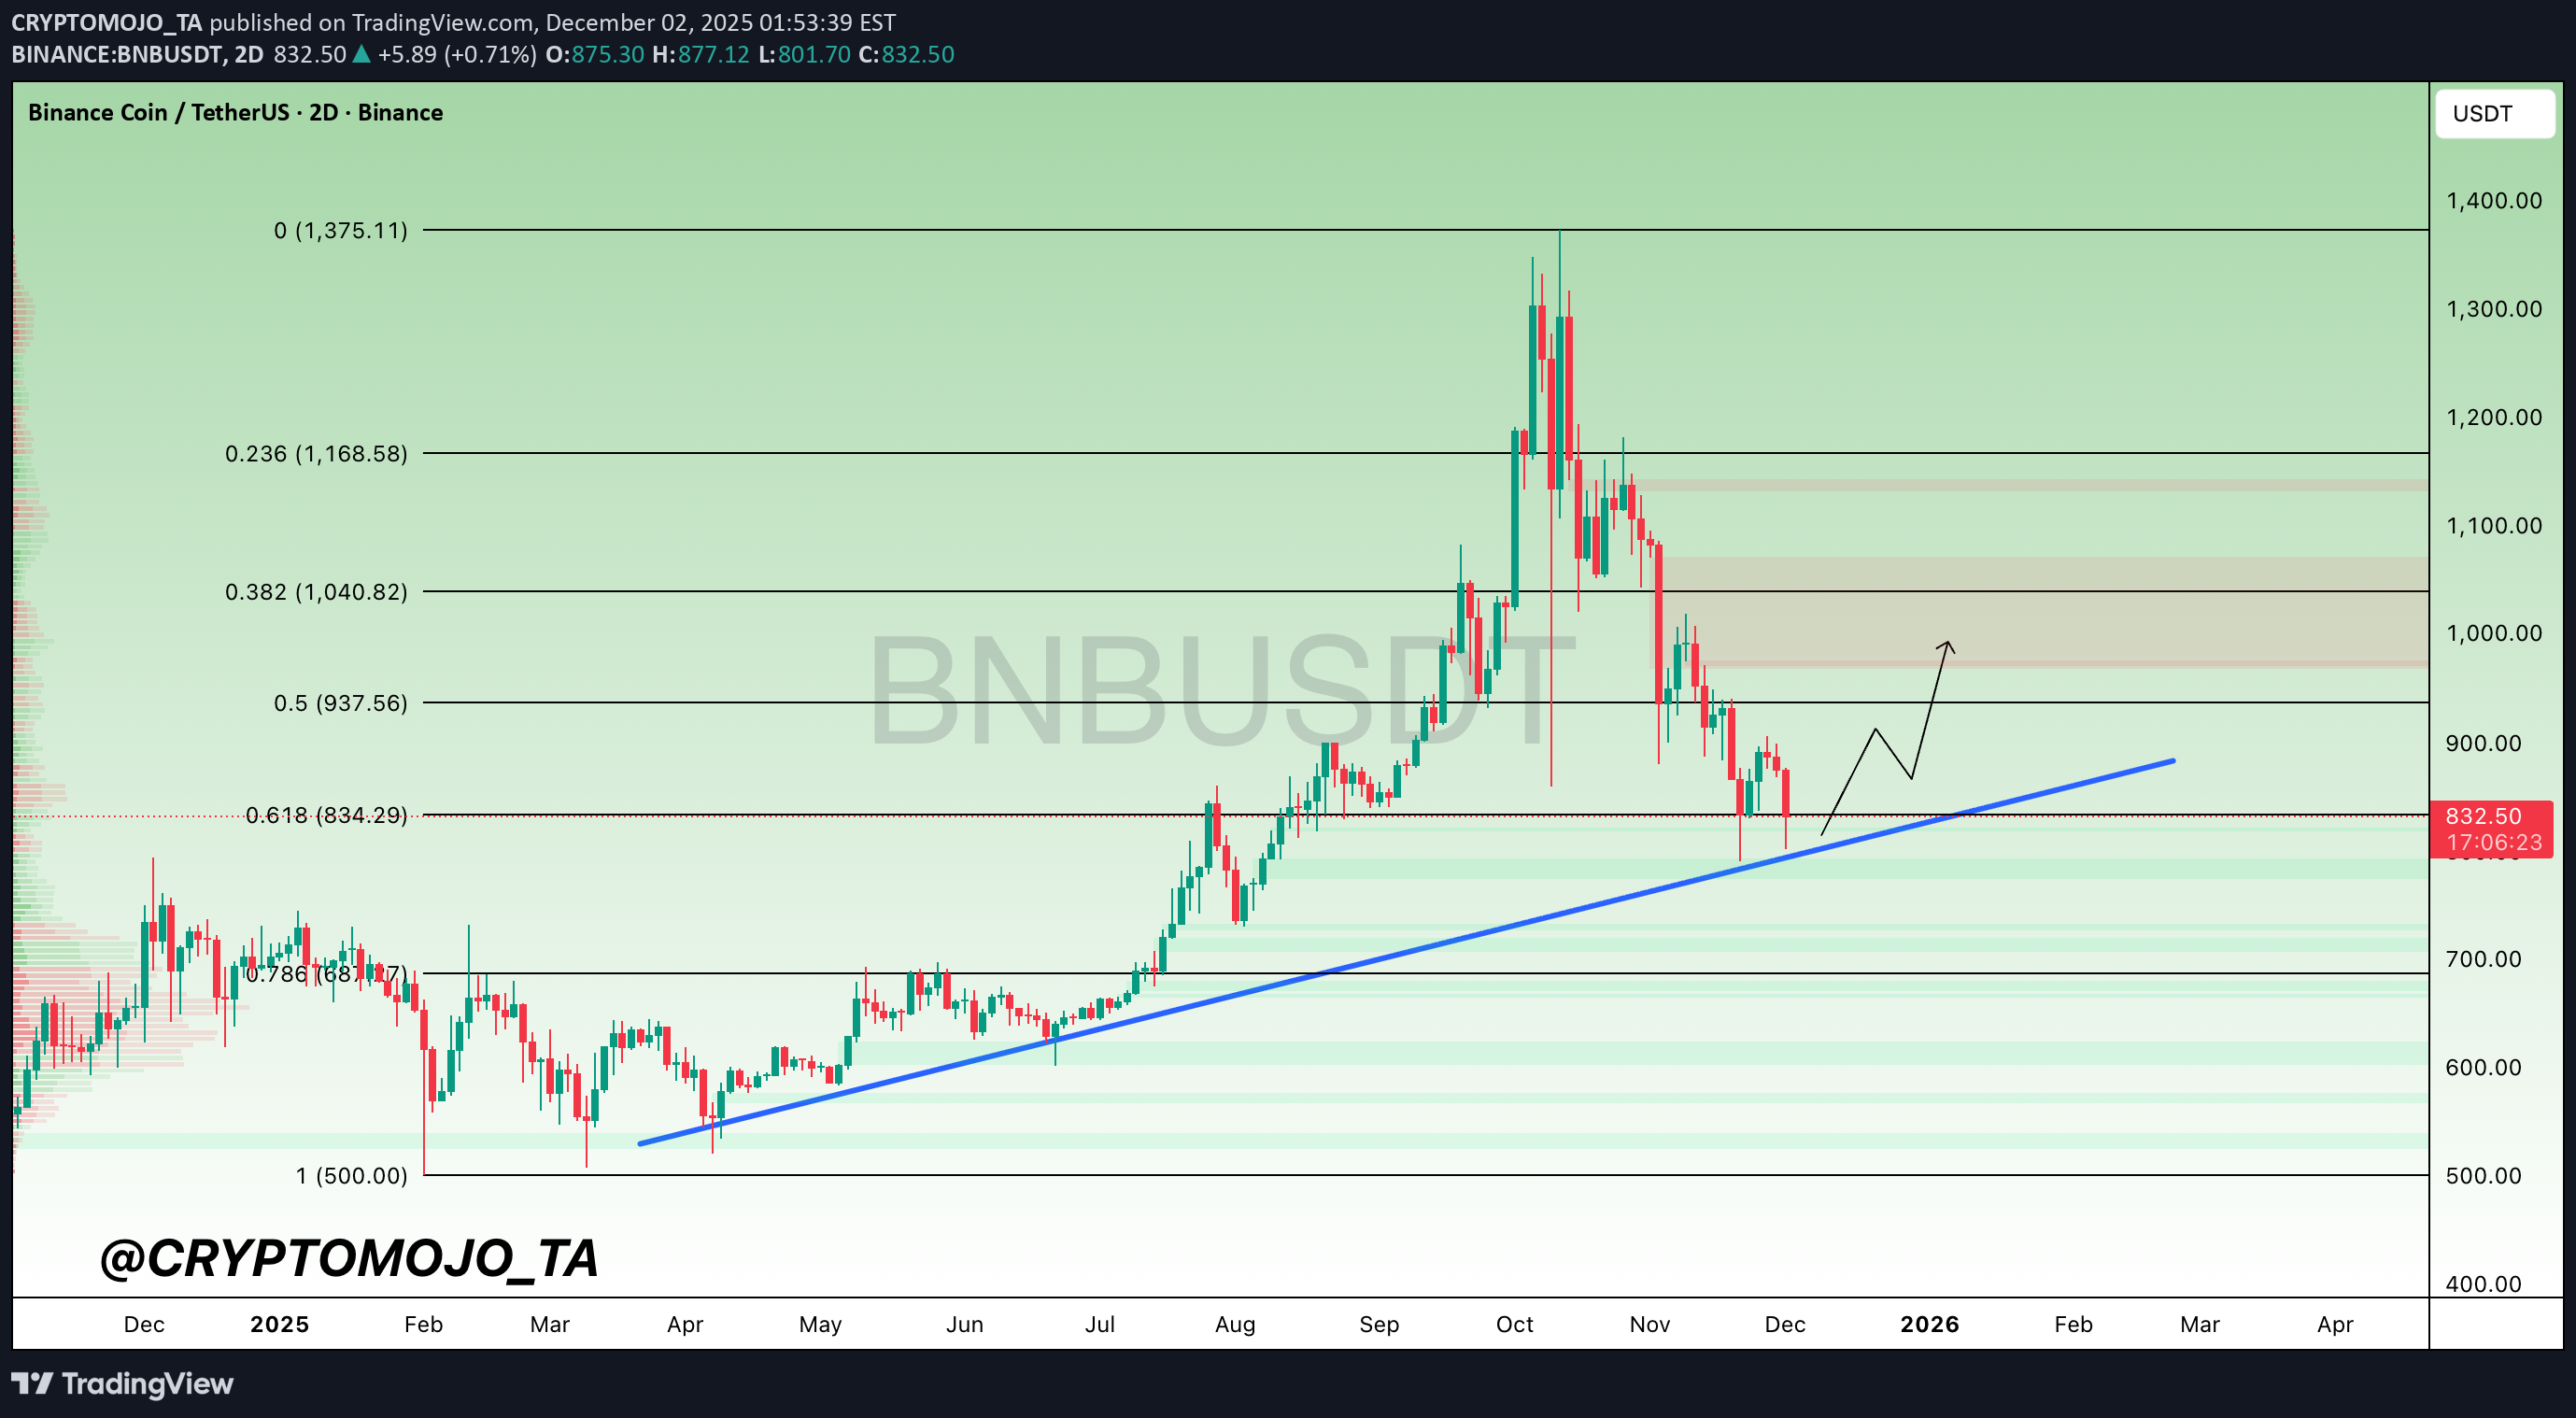
خط قرمز سرنوشتساز بیتکوین (BNB): آیا حمایت تاریخی میشکند یا به قله جدید میرسد؟
CRYPTOMOJO_TA
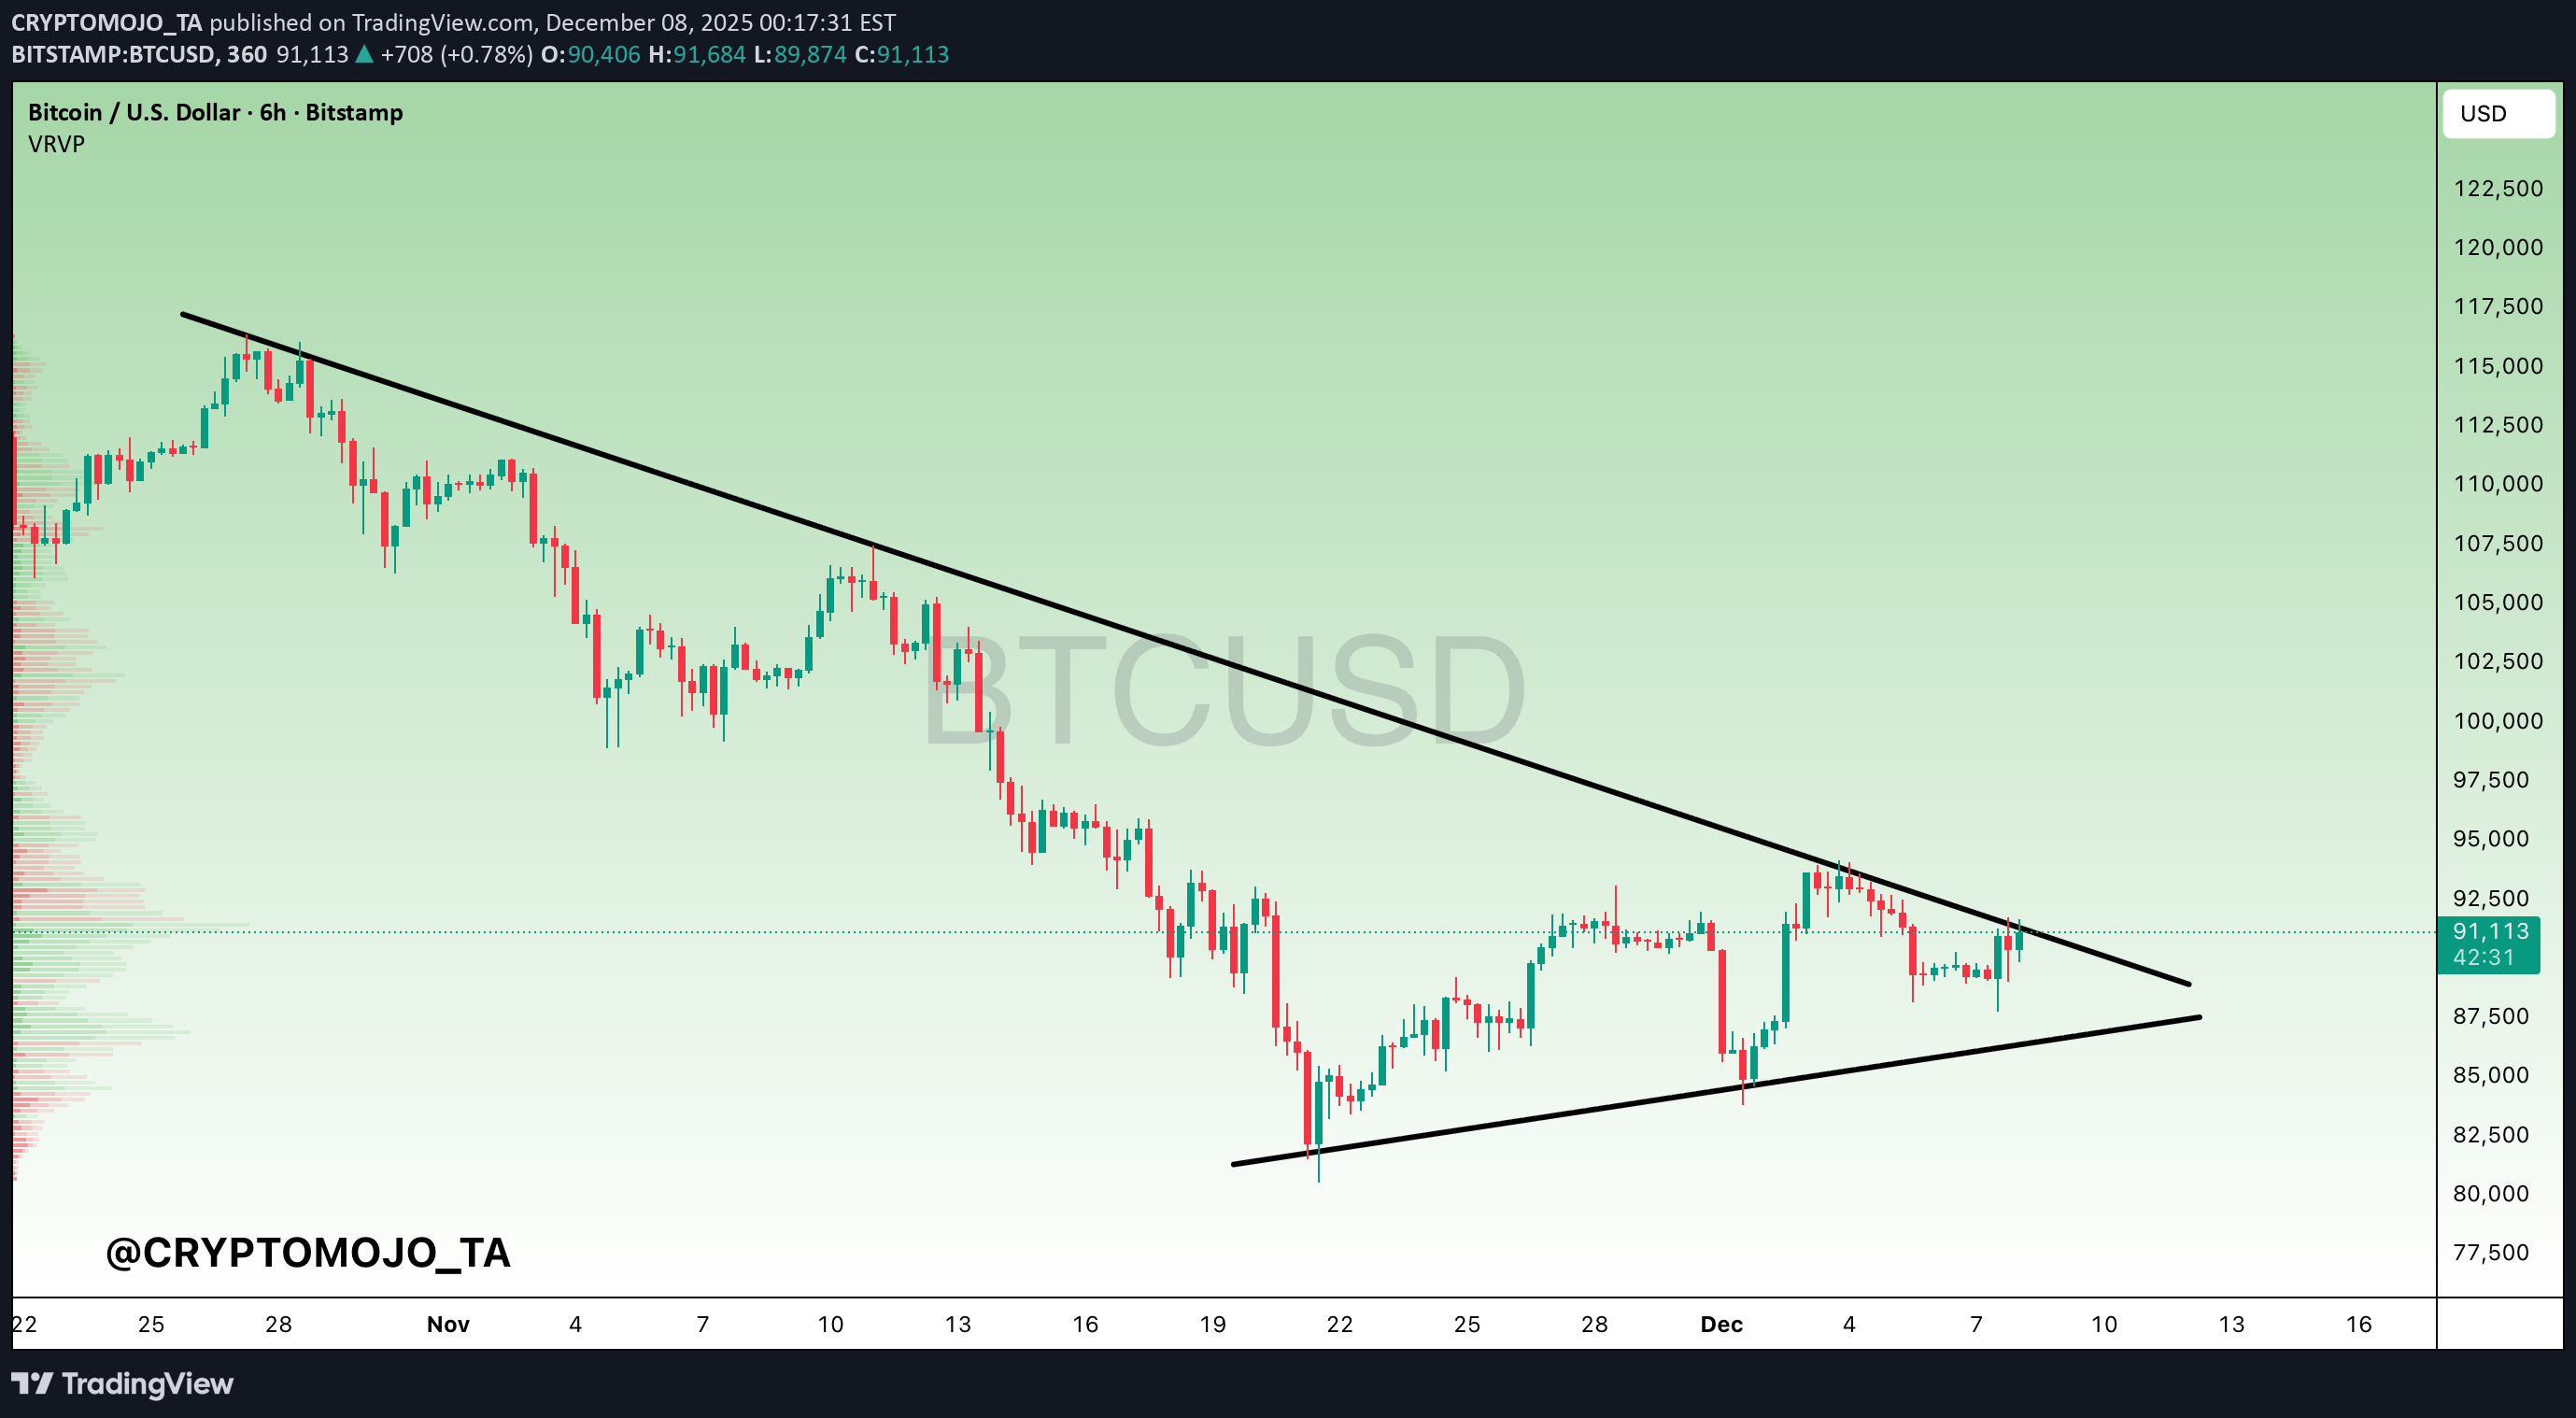
شکست خط روند بیت کوین: آیا سقوط به ۹۳ هزار یا ۸۵ هزار قطعی است؟
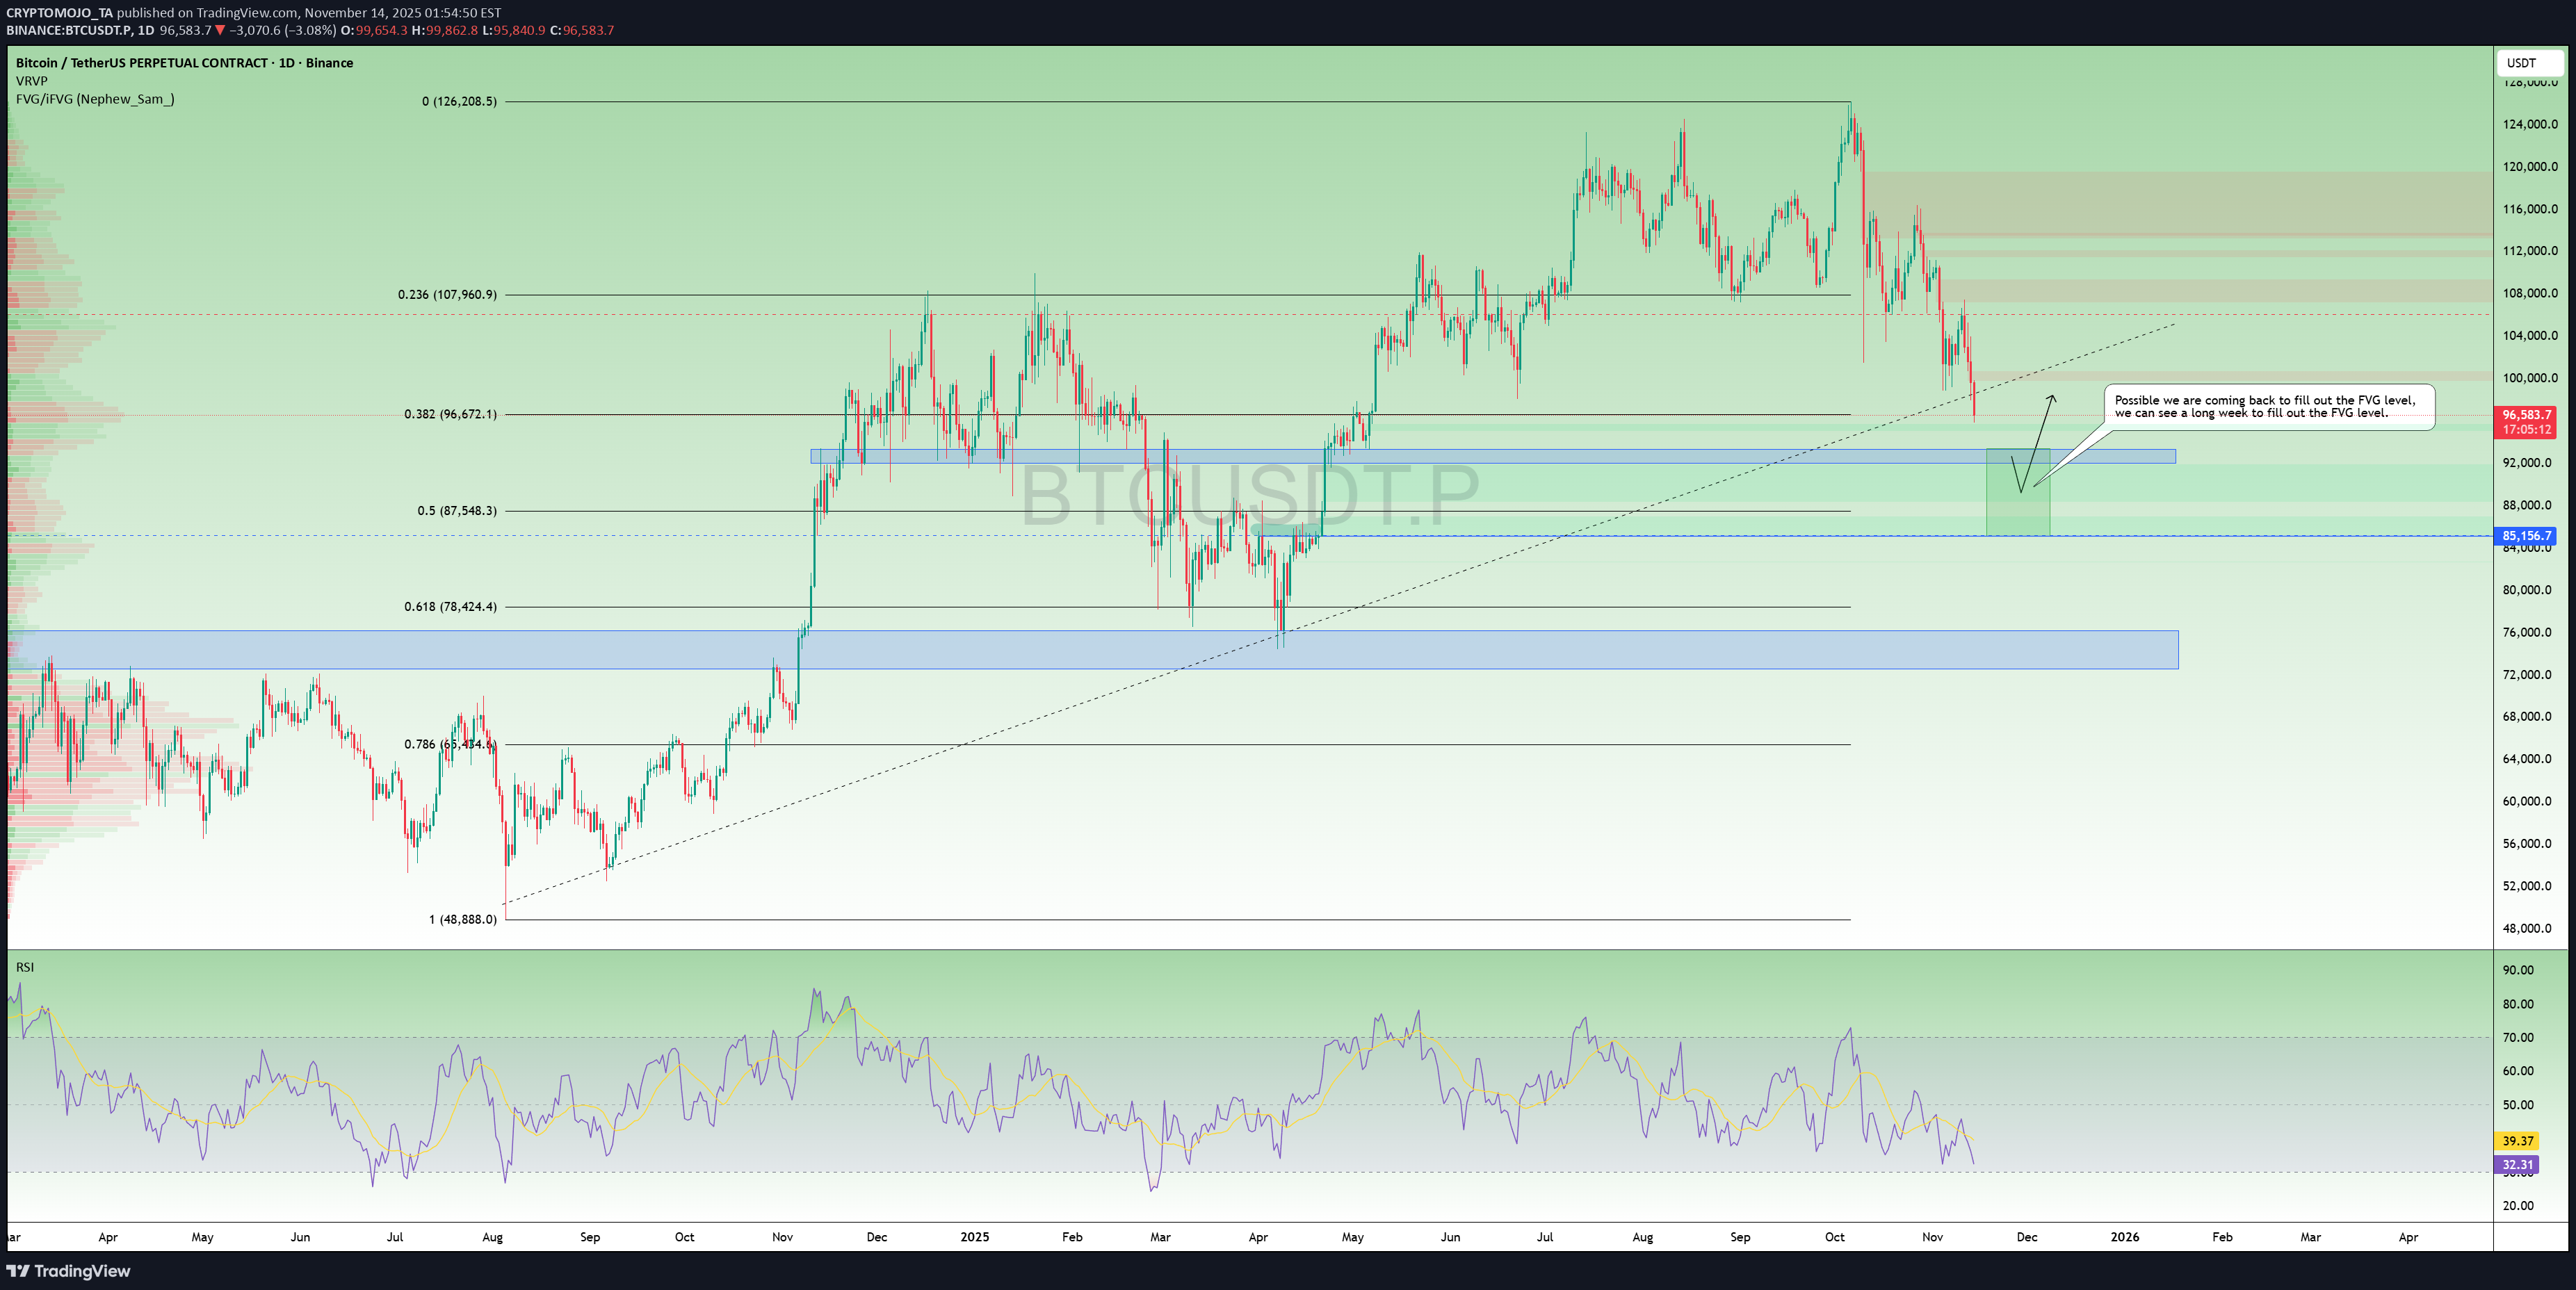
BTC Günlük Yapı Güncellemesi – Trend Çizgisi Kayboldu, Gözler 92–93K Desteğinde! Bitcoin resmi olarak günlük trend çizgisi desteğinin altına inerek mevcut piyasa yapısında daha fazla zayıflamaya doğru bir kaymayı doğruladı. Bu döküm, herhangi bir anlamlı sıçramadan önce daha derin geri çekilme seviyelerinin yakalanma olasılığını artırır. 🔹 İzlenecek Temel Seviyeler ▪️ 92K–93K Destek Bölgesi Fiyat şu anda bu ilk major destek alanına doğru ilerliyor. Bu bölge önceki taleple uyumludur ve kısa vadeli bir tepki sunabilir. ▪️ 0,5 Fibonacci Düzeyi (≈87,5K) 92K-93K tutunamazsa bir sonraki mıknatıs 0,5 FIB geri çekilme bölgesi olur. Tarihsel olarak BTC, döngü ortası düzeltmeler sırasında 0,5'lik geri çekilmeyi dikkate alır, dolayısıyla bu alan önemlidir. ▪️ Gerçeğe Uygun Değer Açığı (FVG) – 85K'yı Hedefleme Aşağıda görünür bir FVG kaldı ve yapı artık onu doldurmak için olası bir geri dönüş öneriyor. Momentum aşağı doğru devam ederse, 85K'ya doğru uzun bir fitil kesinlikle masada. Görüşlerinizi yorumlayın ve daha fazla güncelleme için takip edin.
Sorumluluk Reddi
Sahmeto'nun web sitesinde ve resmi iletişim kanallarında yer alan herhangi bir içerik ve materyal, kişisel görüşlerin ve analizlerin bir derlemesidir ve bağlayıcı değildir. Borsa ve kripto para piyasasına alım, satım, giriş veya çıkış için herhangi bir tavsiye oluşturmazlar. Ayrıca, web sitesinde ve kanallarda yer alan tüm haberler ve analizler, yalnızca resmi ve gayri resmi yerli ve yabancı kaynaklardan yeniden yayınlanan bilgilerdir ve söz konusu içeriğin kullanıcılarının materyallerin orijinalliğini ve doğruluğunu takip etmekten ve sağlamaktan sorumlu olduğu açıktır. Bu nedenle, sorumluluk reddedilirken, sermaye piyasası ve kripto para piyasasındaki herhangi bir karar verme, eylem ve olası kar ve zarar sorumluluğunun yatırımcıya ait olduğu beyan edilir.