
ProjectSyndicate
@t_ProjectSyndicate

تریدر چه نمادی را توصیه به خرید کرده؟
سابقه خرید
تخمین بازدهی ماه به ماه تریدر
پیام های تریدر
فیلتر
نوع پیام
ProjectSyndicate
فروپاشی بزرگ بیت کوین در ۲۰۲۶: آیا BTC تا ۳۰,۰۰۰ دلار سقوط میکند؟
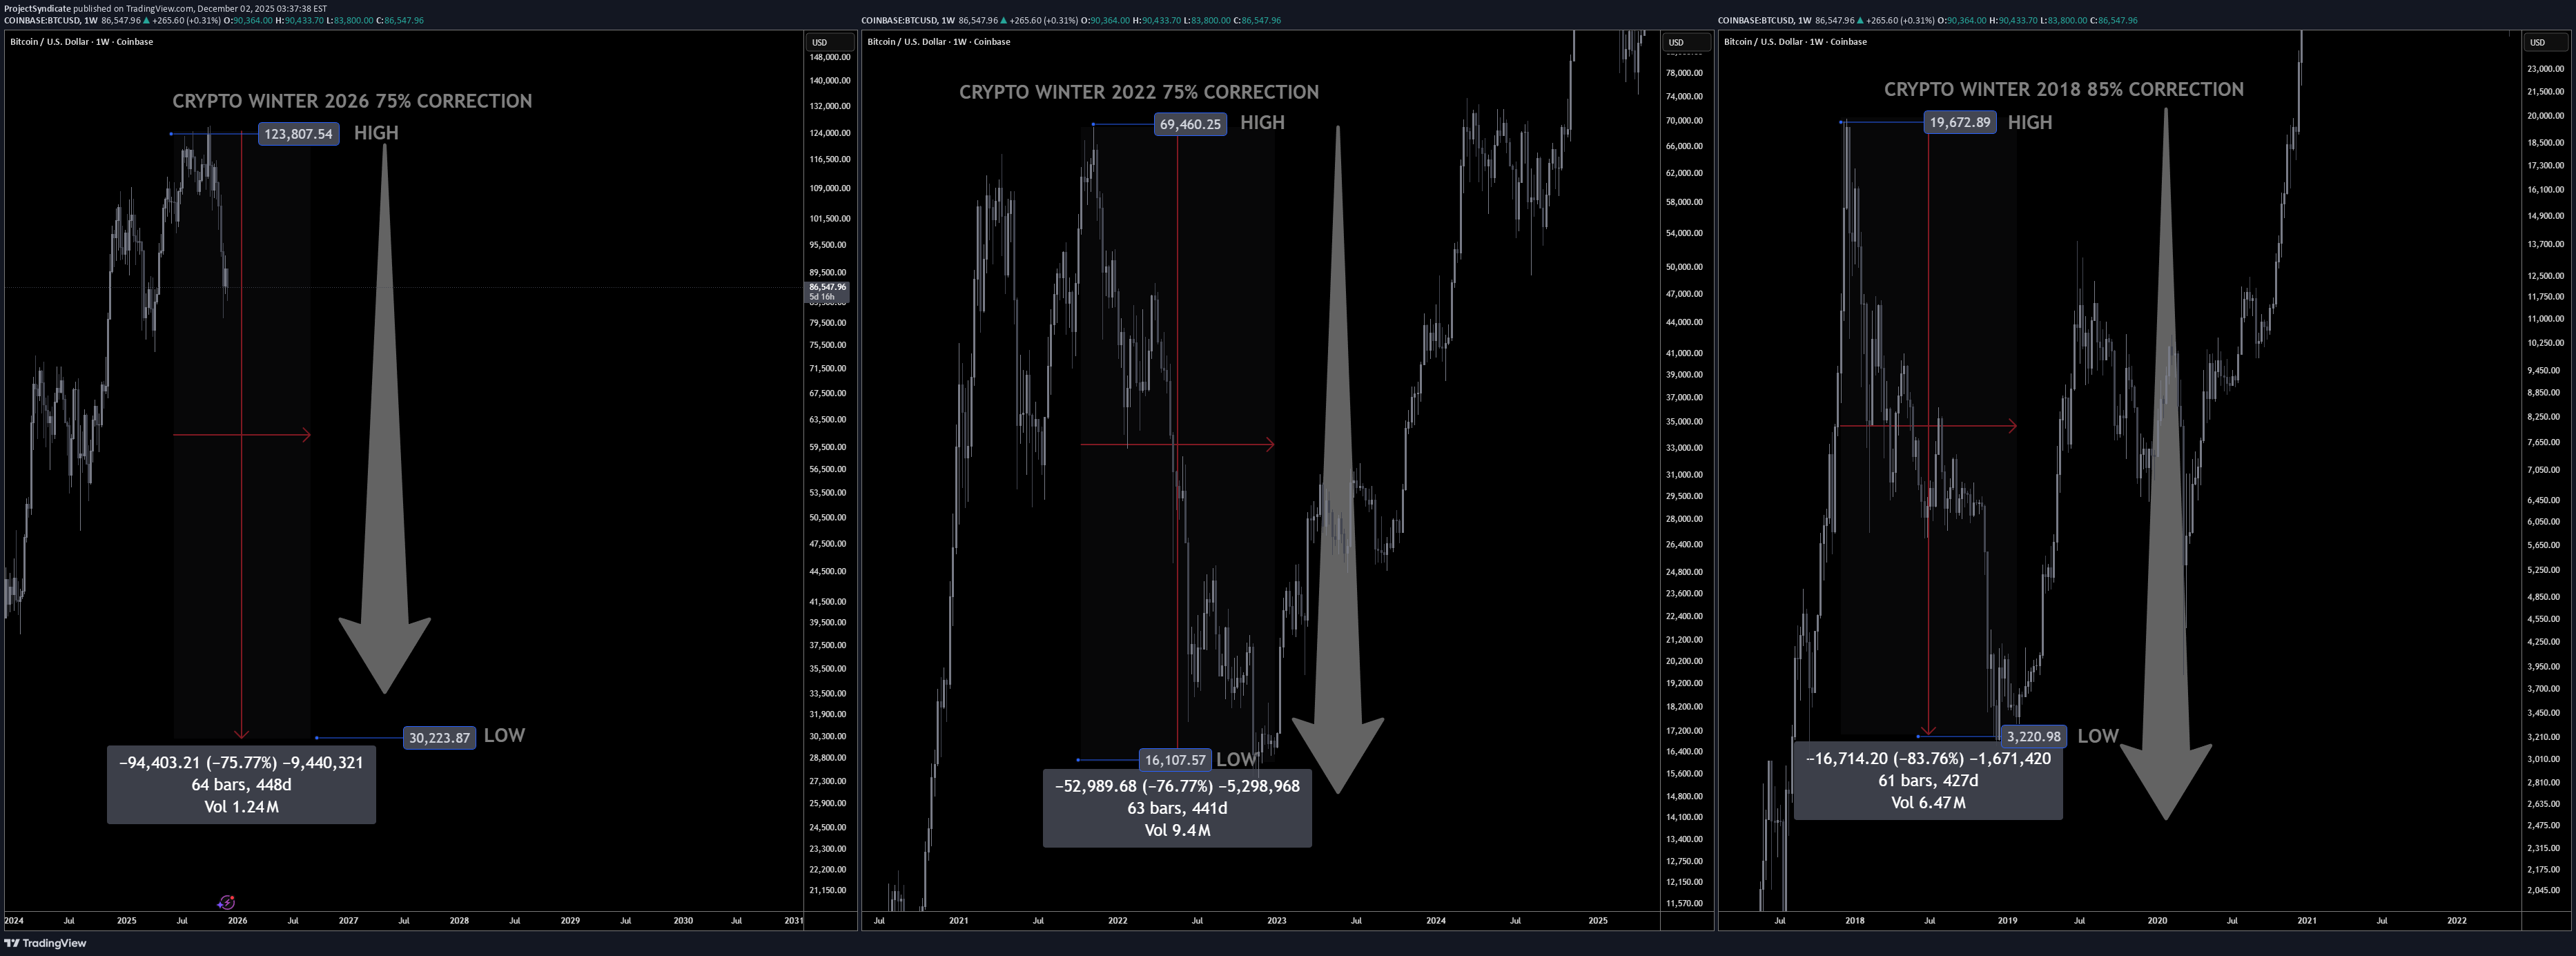
Investment Memo: Anticipating a 2026 Bitcoin Crypto Winter By ProjectSyndicate ________________________________________ 1. Executive Summary ❄️ Summary view: This memo treats 2026 as the high-probability crypto winter year for Bitcoin following the 2024 halving, with a working top around 123,000 USD and an expected cycle low near 30,000 USD, implying roughly a 75–76% drawdown from the peak. This is fully consistent with historical Bitcoin bear markets, which have typically seen 75–85% corrections from all-time highs. ❄️ Contrarian hook: While mainstream narratives still focus on ETFs, institutional adoption, and “crypto as macro asset,” the explosion of leverage (Aster DEX up to 1001x), CZ-backed perps, and BNB-chain meme-coin mania are treated here as late-cycle excess—classic topping signals rather than sustainable foundations. ________________________________________ 2. Thesis & Target Range 📊 Cycle top assumption: cycle high of ~123,000 USD per BTC. That is well within the band implied by recent ATH prints ~125–126k in mid-2025 and aligns with a typical “blow-off” overshoot above the prior psychological milestone at 100k. 📊 Cycle low assumption: 30,000 USD downside target represents a drawdown of ~75.6% from 123,000 USD—slightly shallower than the 2018 crash (~84%) and broadly in line with the 2021–22 bear (~77% from 69k to ~15–16k). That keeps this winter brutal but not apocalyptic, consistent with a maturing asset still capable of deep mean reversion. 🧮 Math check on prior winters •2017–18: 19k → 3k ≈ 84% drawdown •2021–22: 69k → 16k ≈ 77% drawdown •2025–26 (your base case): 123k → 30k ≈ 76% drawdown This places scenario squarely inside the historical corridor of 75–85% post-peak corrections. ________________________________________ 3. Historical Pattern: Why Large Drawdowns Are the Base Case 📉 Structural volatility: Bitcoin’s entire price history is punctuated by massive post-parabolic drawdowns—early cycles saw 86–93% collapses, later ones 75–80%. Each halving-to-peak run has ended in a violent crash once marginal buyers are exhausted and leverage saturates. 📉 Time dimension: Historically, the “winter” phase has lasted 9–18 months from peak to capitulation and then a long grinding accumulation. The 2017 peak to 2018–19 bottom spanned roughly a year; the 2021 peak to 2022–23 nadir similarly took about a year, with a further period of sideways chop. 📉 Drawdown normalization: Traditional asset allocators increasingly frame Bitcoin as an alternative macro asset, but the statistical reality is unchanged: drawdowns of 70%+ are not outliers—they are typical. An assumption of only shallow corrections is the non-consensus view; a 75% winter is actually the boringly normal scenario from a historical distribution standpoint. ________________________________________ 4. Where We Are in the Current Cycle ⏳ Post-halving positioning: The fourth Bitcoin halving occurred in April 2024, cutting block rewards to 3.125 BTC and effectively tightening supply. Historically, the major blow-off tops occur 12–18 months after halving, as reduced supply + narrative momentum pulls in late-stage retail and leverage. ⏳ Evidence of late-cycle behavior: By mid-2025, Bitcoin had already pushed to new ATHs above 100k and then into the ~120–126k region, with growing signs of ETF saturation, institutional FOMO, and leverage-driven upside. From a purely cyclical lens, we are more likely in the “euphoria / distribution” band than in early bull territory. ________________________________________ 5. Aster DEX & Meme-Coin Mania as Contrarian Top Signals 🚨 Aster DEX as the “Hyperliquid of BNB Chain”: Aster DEX, emerging from APX Finance and Astherus and explicitly leveraging Binance’s network, is marketed as a high-performance perp DEX with MEV-resistant trading and leverage up to 1001x, backed by CZ/affiliate ventures. From a contrarian perspective, this is textbook late-cycle: maximum leverage offered to the broadest possible audience at or near cycle highs. 🚨 BNB meme-coin carnival: Simultaneously, BNB-chain meme coins and speculative listings (Maxi Doge, PEPENODE, various new BNB meme projects) are being pushed as high-beta “next 100x” plays. Historically, similar episodes—2017 ICOs, 2021 dog-coin and NFT mania—have coincided with or slightly lagged Bitcoin’s macro top rather than signal early-cycle value. 🎭 Narrative pattern recognition: In prior cycles, the market’s center of gravity shifted from Bitcoin to highly speculative edges (ICOs, NFTs, obscure DeFi, meme coins) at the very end of the bull. Late-cycle liquidity rotates into lottery tickets while BTC quietly transitions from “must own” to “source of funds.” The current Aster + BNB meme complex rhymes strongly with that historical script. ________________________________________ 6. Why a 75% Drawdown to 30,000 USD is Plausible 🧊 From 123k to 30k mechanically: A move from 123k to 30k doesn’t require structural failure; it merely requires a reversion to historical drawdown. That kind of move can be achieved by: •ETF inflows slowing or turning to mild outflows •Derivatives funding turning negative as carry trades unwind •A moderate macro risk-off (equities correction, higher real yields) 🧊 Maturing, not invincible: As adoption broadens—spot ETFs, institutional mandates, integration into macro portfolios—Bitcoin’s upside may gradually compress, but liquidity cycles and leverage cycles haven’t vanished. Even if each cycle’s drawdown edges slightly lower from ~85% to ~77%, there’s no reason to assume sub-50% drawdowns are the new regime. A respectable winter at 30k is almost conservative relative to earlier -80%+ events. ________________________________________ 7. Why the Floor Might Hold Above Prior Lows 🛡️ On-chain + macro floor logic: Without pinning to proprietary on-chain models, two simple supports for a 30k floor are: •Institutional cost basis: A growing chunk of supply is held via ETFs and treasuries accumulated in the 40–70k band. Many of these players may defend positions with hedging or incremental buying in the high-20k / low-30k region rather than panic-sell at -70–80%. •Realized price ratcheting higher: Across cycles, Bitcoin’s long-term realized price average on-chain cost basis tends to step up structurally. Past winters have bottomed not far below that long-term average; as the realized base rises, so does the likely bear-market floor. 🛡️ Regime shift vs. previous cycles: In 2018 and 2022, Bitcoin was still climbing the wall of institutional skepticism. By the mid-2020s, you have: •Spot ETFs •Corporate treasuries •Sovereign/FI experimentation These players typically do not capitulate to zero; they reduce risk, but they also accumulate in stress. That supports the idea of a shallower floor (30k) instead of a full 85–90% purge. ________________________________________ 8. Timing the 2026 Winter 🧭 Halving + 18-month lag template: Using the standard halving cycle template, major tops often occur 12–18 months post-halving, and winters then dominate the following year. With the fourth halving in April 2024, a 2025 ATH and a 2026 winter are exactly what the simple cycle model would project. 🧭 Scenario sketch •2025: Distribution at elevated levels (80–120k+), persistent Bitcoin as digital gold narrative, alt & meme blow-off, over-issuance of high-leverage products (Aster, other perps). •2026: Liquidity withdrawal + ETF fatigue + regulatory flare-ups → a stair-step decline through 80k, 60k, 45k, culminating in capitulation wicks into the 30–35k zone before a multi-month bottoming process. ________________________________________ 9. Market Structure Stress Points in a Winter Scenario 🧱 Leverage cascade risk: Perp DEXs offering hundreds to 1000x leverage attract the most price-insensitive flow at the worst time. When BTC breaks key levels (e.g., 80k → 60k → 50k), auto-deleveraging and forced liquidations can accelerate downside far beyond spot selling. Aster-style platforms, while innovative, mechanically create risk of cascading liquidations in a volatility spike. 🧱 Alt & meme vaporization: BNB meme coins and other speculative assets that rode the late-cycle pump will likely see 90–99% drawdowns, as in previous winters where smaller alts dramatically underperformed BTC. In your framework, BTC at 30k is actually the “high-quality survivor” outcome; the majority of late-cycle tokens may never reclaim their peaks. 🧱 Mining and infrastructure: With halved rewards and a much lower BTC price, marginal miners will be forced offline, just as in prior winters. That tends to deepen the short-term pain but ultimately improves the cost curve (strong miners consolidate, inefficient ones exit), laying groundwork for the next cycle. ________________________________________🎁Please hit the like button and 🎁Leave a comment to support our team!let me know your thoughts on the above in the comments section 🔥🏧🚀🚨🚨🚨 2026 CRYPTO WINTER PLAYBOOK – CONTRARIAN BTC OUTLOOK 🥶 Bitcoin cycle top penciled in around $123K, with a projected winter low near $30K (≈-75%). ❄️ Previous winters: 2018 -84%, 2022 -77% – a -75% drawdown is actually “normal” for BTC. 🌨️ 2024 halving → 2025 blow-off → 2026 winter fits the classic 12–18 month post-halving boom-and-bust pattern. 🧊 Aster DEX 1000x leverage + BNB meme coin mania = classic late-cycle euphoria, not the start of a new bull. 🌬️ Spot ETF + institutional FOMO can’t delete BTC’s historical 70–80% crash DNA – they just shift where the floor is. 🌨️ $30K acts as a plausible new floor, supported by higher institutional cost basis and long-term realized price. 🧊 Expect alt & meme coins to nuke 90–99%, while BTC “only” does -75% and survives to lead the next cycle. ❄️ Smart money sells euphoria near 6-figure BTC, builds dry powder, and targets gradual entries 40–35–30K. 🥶 Leverage is the enemy: perps and 1000x casinos likely accelerate the crash via liquidation cascades. 🌨️ Not financial advice – it’s a cycle-based contrarian framework for a statistically “normal” 2026 Bitcoin winter.final DEATH BOUNCE incoming shortly in December/January. then lights out.
ProjectSyndicate
طلا هفته آینده: سطوح حیاتی حمایت و مقاومت و پیشبینی تریدرها
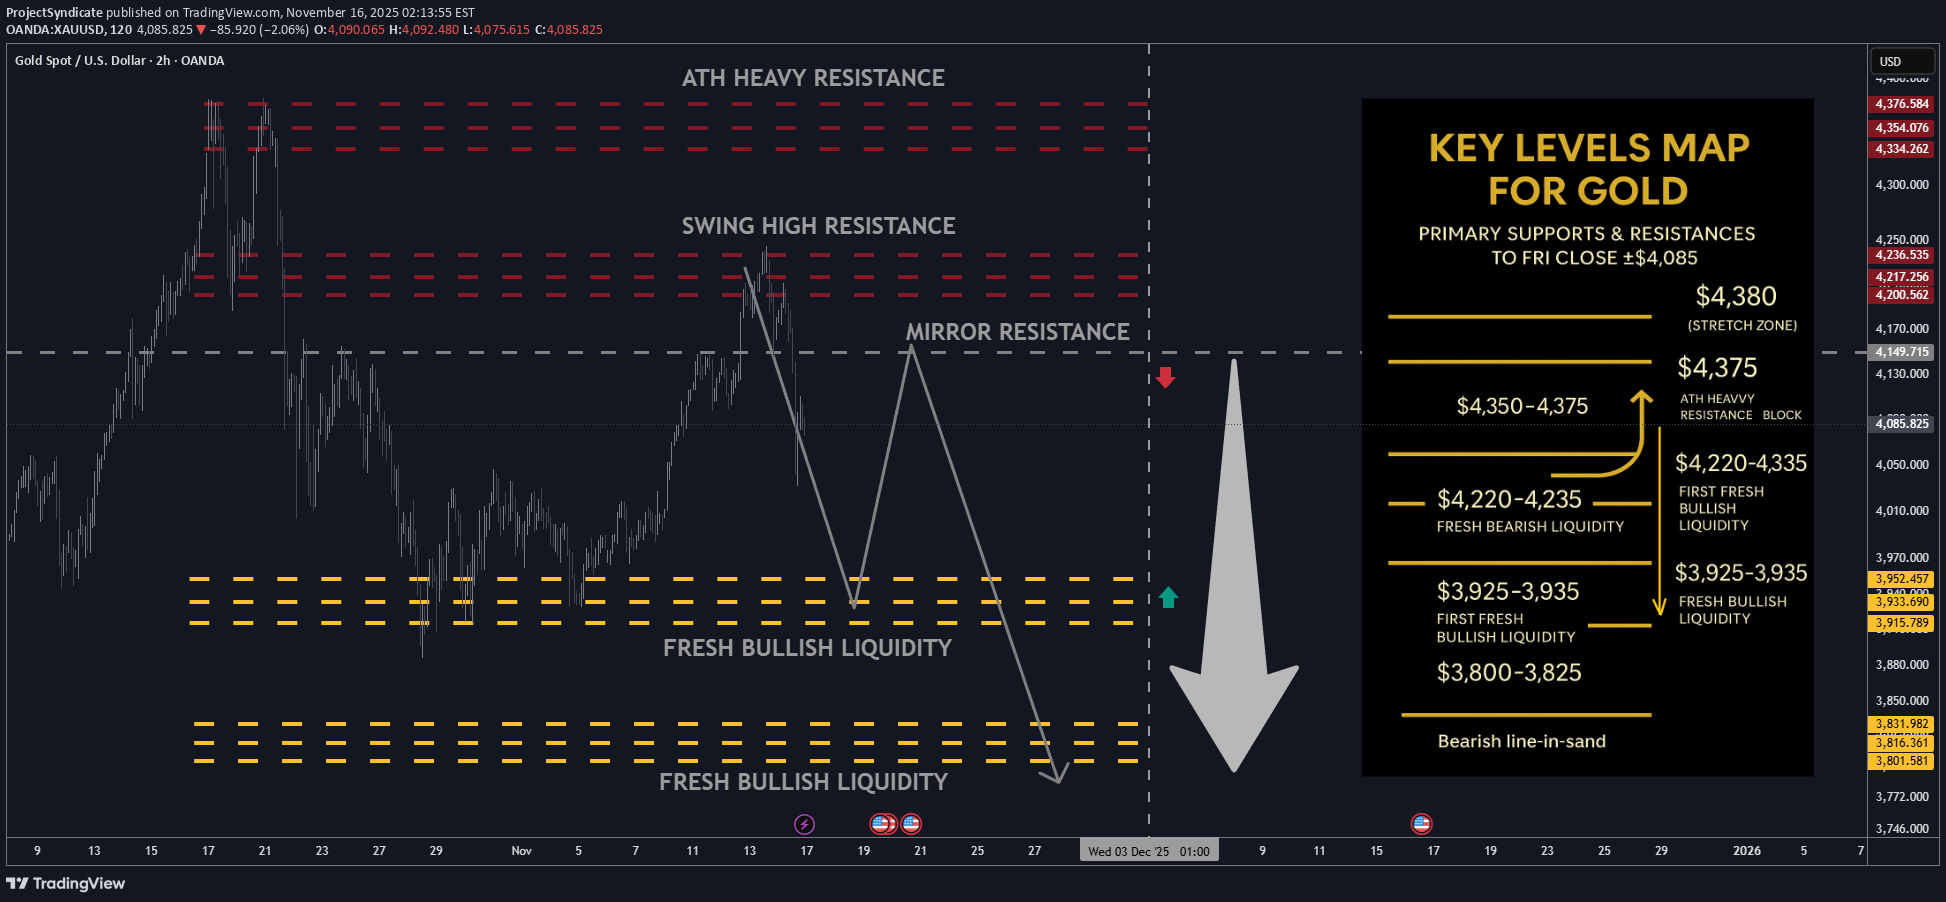
🔥 عکس هفتگی طلایی — توسط PROJECTSYNDICATE 🏆 بالا/بسته: ~4244 دلار → ~4085 دلار - خریداران به 4.20 هزار دلار رسیدند اما فروشندگان از باند 4220 تا 4250 دلار دفاع کردند. بسته شدن هفتگی نرم است اما همچنان به راحتی بالای 4 هزار دلار و قیمت متوسط است. 📈 روند: صعودی اما در حالت اصلاحی / دو طرفه ; در نظر گرفتن نوار فعلی به عنوان تجارت محدوده در حالی که زیر بلوک عرضه 4350-4375 دلار ATH است. 🛡 پشتیبانی: 3925-3935 دلار نقدینگی صعودی تازه ← جیب تقاضای 3800 تا 3825 دلاری - قفسههای کلیدی که انتظار میرود خرید پایینتر در آنها وجود داشته باشد. 🚧 مقاومت ها: 4220-4230 دلار منطقه محو شدن کوتاه مدت → 4350-4375 دلار (ATH بلوک مقاومت سنگین). 🧭 تعصب در هفته آینده: ترجیح به محو شدن قدرت به 4220-4230 دلار، با هدف چرخش مجدد به 3925-3935 دلار. گزینه دیگر این است که کاهش قیمت را به 3925 تا 3935 دلار بخرید و بازه را به 4220 تا 4230 دلار برگردانید. ابطال در پذیرش پایدار بالای 4350-4375 دلار؛ از دست دادن 3800 تا 3825 دلار خطر بازگشت میانگین عمیق تر را به همراه دارد. _____________________________________ _____________________________________ 🔝 مناطق مقاومت کلیدی •4220-4230 دلار — سقف فوری هفتگی. با بلوک مقاومت مشخص شده شما، منطقه جذاب برای شروع شلوارک در اولین آزمایش ها، هماهنگ است. •4,350-4,375 دلار - قبل از ATH / "بلوک مقاومت سنگین"; هر سنبله ای در اینجا یک کاندید محو است مگر اینکه قیمت بالاتر از آن در حجم قوی باشد. 🛡 مناطق پشتیبانی •3925-3935 دلار - نقدینگی صعودی تازه. ترجیحاً اولین سود برای شلوارک و منطقه خرید اولیه. • 3800-3825 دلار - نقدینگی تازه تر. شکست در اینجا نشان دهنده یک اصلاح معنادارتر است، نه فقط یک عقب نشینی در یک روند صعودی. _____________________________________ ⚖️ سناریوی موردی پایه محدوده / ادغام بین تقریباً 3800 تا 4230 دلار: • فشارهای اول به 4220-4230 دلار برای چرخش به 3925-3935 دلار قابل فروش است. •تا زمانی که بستههای هفتگی همچنان بلوک 4350 تا 4375 دلاری ATH را رد کند، سوگیری «فروش قدرت، خرید کاهش نقدینگی پاک» باقی میماند. 🚀 محرک های شکست / شکست • ماشه افزایشی: پذیرش پایدار بالای 4350-4375 دلار جلسات متعدد در بالا و استفاده از آن band به عنوان پشتیبانی، لحن را به روند کامل برمیگرداند و مسیر را به سمت و فراتر از افراطهای قبلی باز میکند (~4400 دلار +). • ماشه خرس: بسته شدن قاطع روزانه زیر 3800 دلار، «پسکشی سالم» فعلی را به اصلاحی عمیقتر تبدیل میکند، اتاقی را به سمت قفسههای پایین قبلی زیر 3750 دلار باز میکند و احتمال افزایش نوسانات را دارد. _____________________________________ 💡 رانندگان بازار برای تماشا •بازدهی فدرال رزرو و واقعی: احتمال کاهش در ماه دسامبر دوباره افزایش یافته است. هر گونه پسبک جنگطلب یا داغتر data میتواند تجمعات نزدیک به مقاومت را محدود کند. •U.S. ریسک مالی/سیاسی: تعطیلی و حاشیه مالی هنوز در پس زمینه است. عناوین قطعنامه می توانند به طور خلاصه بر طلا فشار بیاورند، در حالی که بی ثباتی مجدد از پیشنهاد حمایت می کند. جریان و موقعیت: تقاضای ETF و بانک مرکزی همچنان حمایت کننده است، اما پس از اجرای 60% YTD، پول سریع به سرعت سود را افزایش می دهد. •رفتار دارایی متقابل: مراقب همبستگی سهام و طلا باشید. اگر ریسک کاهش یابد و طلا همچنان با سهام بفروشد، پیش از ورود خریداران استراتژیک، افت بیشتر میشود. _____________________________________ 🔓 خطوط ماشه گاو / خرس • صعودی بالاتر: 4,350 تا 4,375 دلار (پذیرش پایدار؛ ATH بلوک به عنوان پشتیبانی بازپس گرفته شد). • نزولی زیر: 3800 دلار (ریسک انحلال عمیق تر را در زیر قفسه های نقدینگی فعلی باز می کند). _____________________________________ 🧭 استراتژی این هفته طرح اولیه - کوتاه از مقاومت (ایده core شما): •منطقه ورود: به شکل شورت در حدود 4220-4230 دلار front لبه بلوک مقاومت مقیاس کنید. •TP #1: نقدینگی جدید صعودی 3925-3935 دلار. در نظر بگیرید که بیشترین اندازه را در اینجا ببندید. • دونده / توسعه: اگر شتاب پایین تر است، برای کسب سود نهایی 3800-3825 دلار را تماشا کنید. در اینجا نمایه به حالت تصحیح عمیق تر تغییر می کند. • خطر: Hard بی اعتباری اگر قیمت بالاتر از 4,350-4,375 دلار را بپذیرد، بسته شدن روزانه در بالا و تست مجدد موفقیت آمیز. طرح جایگزین - خرید افت نقدینگی: •منطقه ورود: Stagger حدود 3925-3935 دلار پیشنهاد می دهد و برای موقعیت یابی تهاجمی تر به 3800-3825 دلار پیشنهاد می دهد. •منطقه خروج: هدف اول به $4,220-4,230 باز می گردد. با نزدیک شدن به آن مقاومت، ریسک زدایی را به شدت در نظر بگیرید band. •ریسک: کاهش یا کاهش در صورتی که قیمت در بسته شدن روزانه بالای 3800 دلار باقی بماند یا اگر فروش در حجم بالا در آن قفسه تسریع شود. 🔱 GOLD WEEKLY SUMMARY 💰 زیاد/بسته: 4,244 → 4,085 — فروشندگان از 4,220–4,250 دفاع کردند. 📊 روند: صعودی اما اصلاحی؛ محدوده تجارت در حالی که < 4,350-4,375. 🏰 مقاومت: 4220–4230 (منطقه محو شدن) → 4350–4375 (ATH بلوک). 🛡 پشتیبانی: 3,925–3,935 (نقدینگی تازه) → 3,800–3,825 (deep تقاضا). 🎯 تعصب: فروش قدرت → 4,220/4,230 → هدف 3,925/3,935. 🏹 Alt طرح: کاهش قیمت را با قیمت 3925/3935 به سمت 4220/4230 بخرید. 🚀 ماشه گاو: شکستن و نگه داشتن بالای 4350–4375. ⚠️ ماشه خرس: بسته روزانه < 3800. 🌐 محرک ها: کاهش فدرال رزرو، دلار/بازده، ریسک مالی، جریان ETF/CB. ⚒️ ریسک: با پذیرش بالای ۴۳۵۰–۴۳۷۵ شورت را باطل کنید. 🎁لطفا دکمه لایک را بزنید و 🎁برای حمایت از تیم ما نظر خود را بنویسید! نظرات خود را در مورد موارد فوق در قسمت نظرات به من بگویید 🔥🏧🚀
ProjectSyndicate
پیشبینی تسلا ۲۰۲۶: رتبهبندی کاتالیزورها و هدف قیمتی ۶۰۰ دلاری
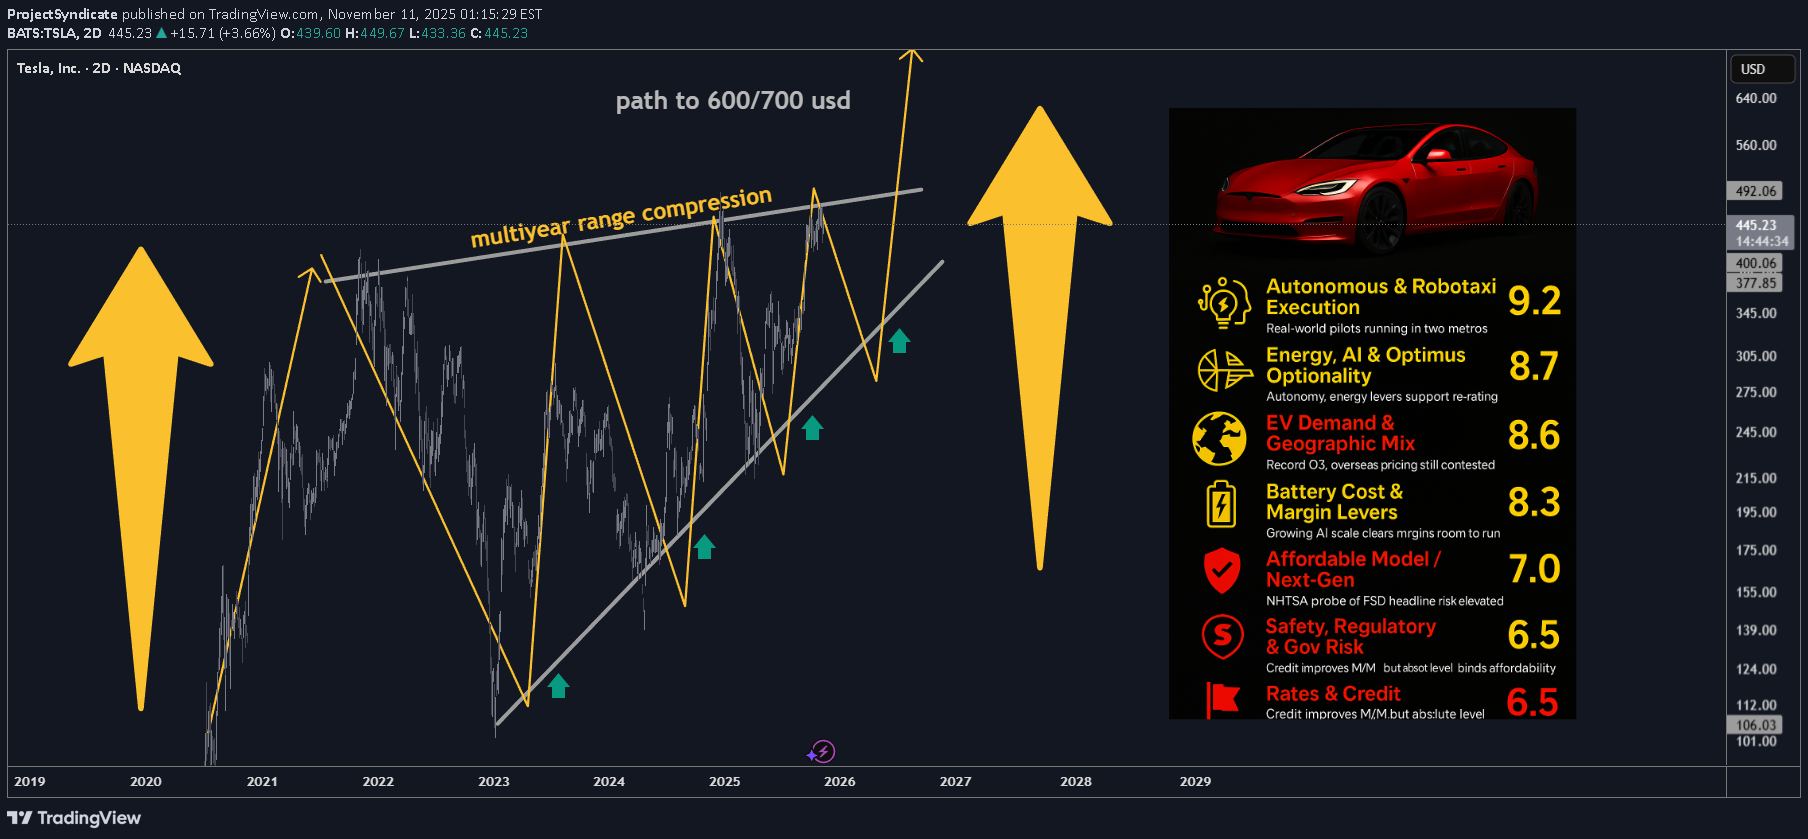
________________________________________ TSLA: Updated Outlook (Nov-2025) Here's an updated/revised outlook for TSLA including all the primary catalyst ranking and analyst ratings and overview of latest developments this was updated for Q1 2026 with all the viable market data. ________________________________________ 🤖 1) Autonomous & Robotaxi Execution — 9.2/10 (↑) •What changed: Tesla’s invite-only Austin robotaxi pilot kept running through the summer; Tesla also says it launched a Bay Area ride-hailing service using Robotaxi tech (Q3 deck). FSD v14 (Supervised) began rolling out in Oct with broader model upgrades; Tesla claims billions of supervised miles and AI training capacity lifted to ~81k H100-equivalents. •Offsetting risk: NHTSA opened a fresh probe (Oct-2025) into ~2.9M Teslas over traffic-safety violations when using FSD; investigation cites 58 reports incl. crashes/injuries. •Why the bump: Real pilots in two metros + visible AI scale-up keep autonomy the center of the bull case—even with elevated regulatory risk. ________________________________________ 🌍 2) EV Demand & Geographic Mix — 8.6/10 (↘ ) •What changed: Q3-25 delivered record vehicles and record energy storage deployments, with record revenue and near-record free cash flow. Still, we’re past the U.S. tax-credit pull-forward and China/Europe pricing remains competitive. •Read-through: Momentum into Q4 looks better than 1H-25, but regional price discipline and mix will matter. ________________________________________ 💸 3) U.S. EV Tax Credits & Incentives — 6.0/10 (↘) •What changed: Federal new/used EV credits ended for vehicles acquired after Sept 30, 2025 under OBBB. Buyers can still qualify if a binding contract + payment was made by 9/30 and the car is placed in service later (“time-of-sale” reporting). This creates a limited after-deadline tail into late ’25/early ’26 but the program has sunset for new acquisitions. •Implication: Pull-forward demand helped Q3; near-term becomes tougher without the credit. ________________________________________ 📉 4) Rates & Credit Conditions — 6.5/10 (↔) •Rate-cut expectations have eased financing costs M/M, but absolute affordability still binds EV uptake. (Macro-sensitive; no single decisive print.) ________________________________________ 🎯 5) Affordable Model / Next-Gen Platform — 8.0/10 (↔) •Q3 deck emphasized Model 3/Y “Standard” variants to expand entry price points; true next-gen remains staged, with execution risk. ________________________________________ 🔋 6) Battery Cost & Margin Levers — 8.3/10 (↑) •What changed: Q3 total GAAP GM improved vs 1H; energy revenue +44% YoY; free cash flow ~$4.0B. Scale/learning and supply-chain localization called out. ________________________________________ ⚡ 7) Energy, AI & Optimus Optionality — 8.7/10 (↑) •Record storage deployments, Megapack 3 / Megablock unveiled; expanding AI inference/training and a U.S. semi-conductor deal noted. This is the clearest re-rating vector beyond autos. ________________________________________ 🛡️ 8) Safety, Regulatory & Governance Risk — 7.5/10 (risk) (↑ risk) •New NHTSA probe into FSD reporting/behavior escalates headline risk; audit scrutiny persists. Interpret higher score here as more material risk to multiple. ________________________________________ 🚩 9) Competition & Global Share — 6.2/10 (↔) •Competitive intensity in China/EU remains high; Q3 execution improved but pricing power still contested. ________________________________________ 🌐 10) Macro & Trade/Policy — 6.5/10 (↑) •Policy shifts (e.g., OBBB tax-credit sunset; tariff/trade uncertainty) remain a swing factor for cost & demand corridors. ________________________________________ ✅ 11) Commodities/Inputs — 5.5/10 (↔) •Mixed moves across lithium/nickel; no single driver eclipses execution/AI narrative near term. ________________________________________ Updated Catalyst Scorecard (ranked by impact) 1.Autonomous & Robotaxi Execution — 9.2 2.Energy, AI & Optimus Optionality — 8.7 3.EV Demand & Geographic Mix — 8.6 4.Battery Cost & Margin Levers — 8.3 5.Affordable Model / Next-Gen — 8.0 6.U.S. EV Incentives — 6.0 7.Rates & Credit — 6.5 8.Macro/Trade — 6.5 9.Competition/Share — 6.2 10.Safety/Reg/Gov Risk — 7.5 (risk flag) 11.Commodities — 5.5 (Key Q3 facts from Tesla’s deck; probe/tax-credit items from NHTSA/IRS reporting.) ________________________________________ 📊 Analyst Rankings & Price Targets •Street consensus (near-term 12-mo): ~$391 average target; consensus rating: Hold across ~46 firms. •Bull camp: Wedbush (Dan Ives) $600 PT (reiterated Nov-5; Street-high; thesis = embodied-AI/robotics optionality + robotaxi). Benchmark $475 Buy (post-Q3). •Cautious/negative: UBS $247 Sell (raised from $215 but still bearish on deliveries/margins). •Tape-check from Tesla: Q3-25 revenue $28.1B, non-GAAP EPS $0.50, record FCF, record deliveries & storage. (EPS miss vs some expectations; revenue beat.) ________________________________________ 🔍 Headlines that moved the needle •NHTSA opens new FSD probe (scope ~2.9M vehicles). •FSD v14 (Supervised) broad rollout; AI capacity to ~81k H100-eq; Bay Area robotaxi ride-hailing noted (Q3 deck). •OBBB EV tax credits sunset 9/30/25; binding-contract/time-of-sale guidance enables limited post-deadline claims. •Q3 print: record deliveries, record energy storage, record FCF; EPS light vs some models but narrative shifts to AI/energy. ________________________________________ 🧭 Technicals: Levels & Structure (weekly focus) Primary structure: since late-2022, TSLA’s traded inside a contracting wedge, with noteworthy compression into 2H-2025—typical of late-stage accumulation before a decisive break. Momentum divergences are improving on weekly frames even as price consolidates. ________________________________________ Key levels (spot-agnostic): •Support: $360–$370 (prior breakdown area/weekly shelf); $330–$345 (multi-touch base/pivot); $310–$320 (cycle risk zone). •Resistance: $405–$420 (range top & supply), $450–$475 (post-robotaxi pop zone / analyst PT cluster), $500 (psych), then $600–$650 (LT measured target band). •Roadmap Expect one more downside probe into $310–$320 in Q1-2026 to complete the wedge, then trend break and resume bull leg toward $600/$650 over the subsequent cycle (≈ ~100% off the projected low). •Risk markers: sustained weekly closes < $305 would postpone the “final low” timing and force a re-mark to the 200-week MA cluster; weekly closes > $475 accelerate the upside timing toward the $500/$600 handles. ________________________________________ Cases unchanged framework •Bull: Robotaxi expands to more metros, regulators settle into a supervised-AV regime, energy/AI scale continues; market re-rates to $475–$600 (Benchmark/Wedbush anchors). •Base: Solid execution across autos + energy, FCF stays healthy, autonomy rolls out cautiously under oversight; stock tracks Street $350–$400 band. •Bear: Delivery softness post-credit-sunset, tougher pricing in China/EU, or adverse NHTSA actions; retest of $300–$330 zone before trend resolution. ________________________________________ What to watch next (60–90 days) 1.NHTSA probe path and any software/recall remedies. 2.Robotaxi geographic expansion cadence and any shift from safety-monitor to remote-assist ops. 3.Energy bookings & Megapack 3/Megablock ramp against utility RFP calendars. 4.Delivery run-rate post-credit sunset and mix of Standard trims. ________________________________________🚗 TSLA Catalysts Ranking: Q1 2026 Outlook PT 600 USD 🤖 Autonomy Surge: Robotaxi pilots live in Austin & Bay Area; FSD v14 expanding fast. ⚡ Energy & AI Lift: Record storage deployments + AI training scale hitting 80k H100 eq. 🌍 EV Demand: Q3 deliveries & FCF at record highs, though EU/China pricing still tight. 🔋 Margins Recovering: Cost cuts & energy growth push GM ↑, strong cash generation. 💰 Tax Credit Fade: U.S. EV credits ended 9/30; only pre-deadline contracts still qualify. 📉 Rates & Macro: Fed easing helps affordability, but demand gap post-credits to watch. 🦾 Optimus & AI Story: Embodied-AI optionality now key to long-term re-rating. 🚨 Reg Risk: NHTSA probes ~2.9 M FSD cars—headline volatility risk persists. 🏁 Tech Map: Wedge compression since ’22 = accumulation; possible final low $310–$320 Q1-26. 🚀 LT Target: Bull cycle toward $600–$650, ≈ +100% from projected base.🎁Please hit the like button and 🎁Leave a comment to support our team!let me know your thoughts on the above in the comments section 🔥🏧🚀Ferrari (RACE) Catalyst Scorecard AND 2026 Outlook
ProjectSyndicate
تحلیل طلای هفته آینده: سطوح حیاتی حمایت و مقاومت برای معاملهگران
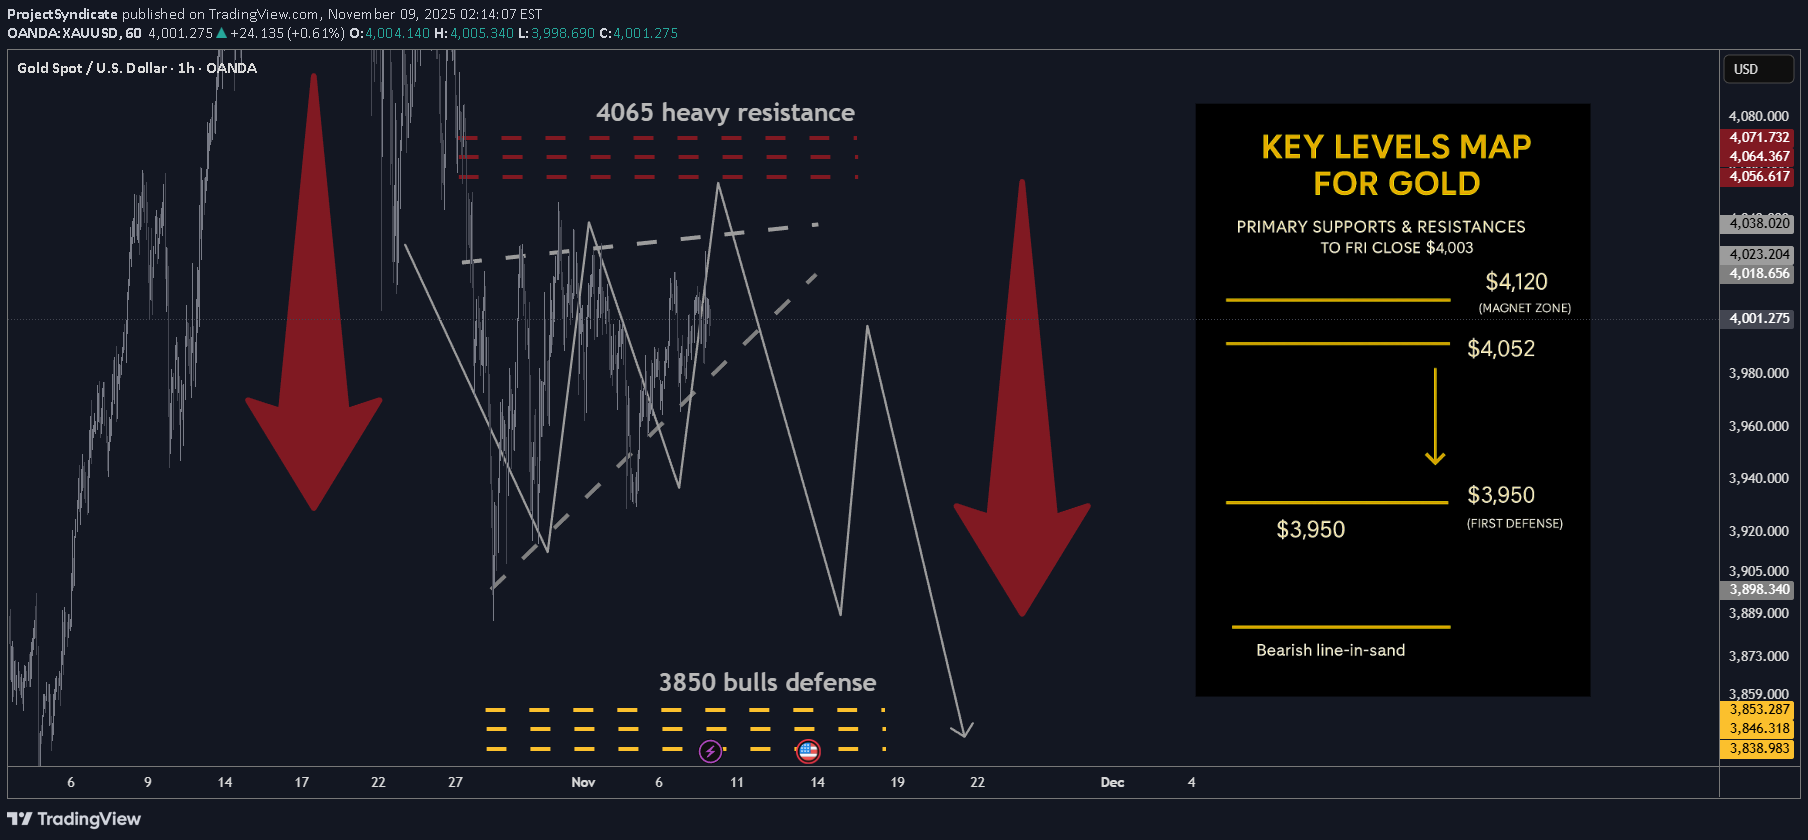
🔥 عکس هفتگی طلایی — توسط PROJECTSYNDICATE 🏆 بالا/بسته: 4,024.9 دلار → ~ 4,003 دلار - فروشندگان محو شده. بسته نرم هفتگی اما دوباره بالای دور 4000 دلار. 📈 روند: خنثی / اصلاح خفیف در محدوده. در حالی که کمتر از 4,080 تا 4,120 دلار است. 🛡 پشتیبانی: 3950 دلار → 3900 دلار → 3850 دلار — قفسه های محوری برای سود بردن و کنترل خرس ها. 🚧 مقاومت ها: 4040 دلار / 4080 دلار / 4120 دلار - مناطق عرضه مکرر. اولین ضربه برای محو شدن مورد علاقه. 🧭 تعصب در هفته آینده: فروش کوتاه به 4040 تا 4120 دلار می رسد. TP 3950 دلار و سپس 3850 دلار (برنامه شما). باطل شدن مطالبه مستمر > 4120 تا 4175 دلار؛ از دست دادن 3850 دلار خطر گسترش کمتر است. 🌍 بادهای دنباله دار کلان / بادهای مخالف (نوار این هفته): • لحن روایی: کیتکو «لبه تیغ» را نزدیک به 4000 دلار با نماهای متفاوت (حباب در مقابل تثبیت) نشان داد، در حالی که قطعه دیگری از کیتکو غرفه را به عنوان «مکث سالم» قاب کرد. •WSJ flow: سرفصلها بین «لغزشهای کمتر از 4000 دلار» و روزهای متوسط در نوسان بودند. خالص خواندن در حدود 4 هزار دلار با تجارت سریع دو طرفه تجمیع می شود. •سطوح: Spot هفته را اساساً با 4000 دلار به پایان رساند. intrawEEK بالا نتوانست سقف 4.02-4.03 هزار دلاری اوایل هفته را پاک کند. 🎯 نمای خیابان: پس از چاپ ماه گذشته بیش از 4000 دلار (اولین بار)، لحن WSJ به هضم تغییر کرد. رالی ها هنوز هم عرضه را جذب می کنند تا زمانی که مقاومت بالایی به دست بیاید. _____________________________________ 🔝 مناطق مقاومت کلیدی •4040 دلار — سقف فوری; نزدیکی زیاد هفتگی، احتمالاً اولین آزمایشها را محدود میکند. • 4080 دلار - افت عرضه ثانویه ناشی از خرابی های اخیر. • 4,120 دلار — نوار بالایی; پذیرش بالا در اینجا شروع به خنثی کردن اصلاح می کند. 🛡 مناطق پشتیبانی • 3950 دلار — اولین دفاع / اولین TP. • 3900 دلار — قفسه با شماره گرد. از دست دادن کاوشگرهای تکانه را دعوت می کند. • 3850 دلار - پایه ساختاری حیاتی و TP دوم. شکستن خطرات شتاب نزولی. _____________________________________ ⚖️ سناریوی موردی پایه فشرده سازی در یک ساختار گوه مانند بالارونده، از 3850 تا 4120 دلار. فشارهای اول به 4040 تا 4120 دلار برای چرخش به 3950 دلار → 3850 دلار قابل فروش هستند در حالی که بازار به بالاترین سطح هفتگی پایین تر احترام می گذارد. 🚀 محرک های شکست / شکست • ماشه گاو نر: پذیرش پایدار > ~ 4120-4175 دلار، دوباره لحن را سازنده می کند و +4200 دلار را دوباره باز می کند. • ماشه خرس: بسته شدن روزانه < 3900 دلار شانس تست کامل 3850 دلار را افزایش می دهد. شکست 3850 دلاری خطر نشت حرکت را به همراه دارد. 💡 رانندگان بازار برای تماشا • مسیر فدرال/بازده واقعی (شانس کاهش نرخ در مقابل روایت تورم چسبنده در نسخه WSJ). • نوسانات USD (بدون ضعف گسترده USD → تلاش های صعودی متوقف می شود). • جریان های ETF/CB (مصاحبه های کیتکو احساسات دوپارچه را برجسته می کند؛ خریداران کم مصرف فعال، بازیکنان حرکت محتاط هستند). • خطر رویداد (حساسیت عنوان بالا باقی می ماند؛ فشار سریع به مقاومت ممکن است). 🔓 خطوط ماشه گاو / خرس • صعودی بالاتر: 4,120 تا 4,175 دلار (پایدار). • نزولی زیر: 3900 دلار → 3850 دلار (ریسک زیر 3850 دلار افزایش می یابد). 🧭 استراتژی این هفته کوتاهی از مقاومت: مقیاس در حدود $4,040 → $4,080 → $4,120; TP #1: 3950 دلار؛ TP #2: 3850 دلار؛ ریسک: Hard توقف در بسته شدن روزانه بالای 4120 دلار (یا نقض روزانه که در آزمون مجدد باقی می ماند). اگر فشار خبری 4175 دلار برچسب زد و ناموفق بود، اصلاح را در نظر بگیرید. 🏆 چشم انداز هفتگی طلا - پخش فشرده سازی محدوده 💰 4024 دلار → 4003 دلار — بسته شدن هفتگی ثابت بالای 4 هزار دلار؛ سقف فروشندگان بالا بود ⚖️ روند: خنثی / اصلاحی؛ محدوده محدود زیر 4080 تا 4120 دلار است. 🏗 ساختار: فشرده سازی گوه بالارونده - محو شدن حرکت. 🎯 استراتژی: 4040 تا 4120 دلار کوتاه. 3950 دلار → 3850 دلار را هدف قرار می دهد. 🧱 پشتیبانی: 3950 دلار / 3900 دلار / 3850 دلار - مناطق سود خرس. 🚧 مقاومت ها: 4040 دلار / 4080 دلار / 4120 دلار - درپوش های عرضه مکرر. 🌍 لحن ماکرو: WSJ & Kitco - "ادغام نزدیک به 4000 دلار"، بازده واقعی شرکت، USD مخلوط. 🔥 ماشه خرس: بسته روزانه < 3900 دلار → تست 3850 دلار را باز می کند. 🚀 محرک گاو نر: پایدار > 4120-4175 دلار → ریسک معکوس. 🧭 تعصب: قدرت بفروش، زیرک بمان. افزایش گوه = محو شدن رالی ها، رزرو سود در کاهش قیمت.🎁لطفا دکمه لایک را بزنید و 🎁برای حمایت از تیم ما نظر خود را بنویسید! نظرات خود را در مورد موارد فوق در بخش نظرات به من اطلاع دهید
ProjectSyndicate
پیشبینی طلای ۲۰۲۶: آیا اصلاح فعلی فرصت خرید نهایی قبل از صعود است؟
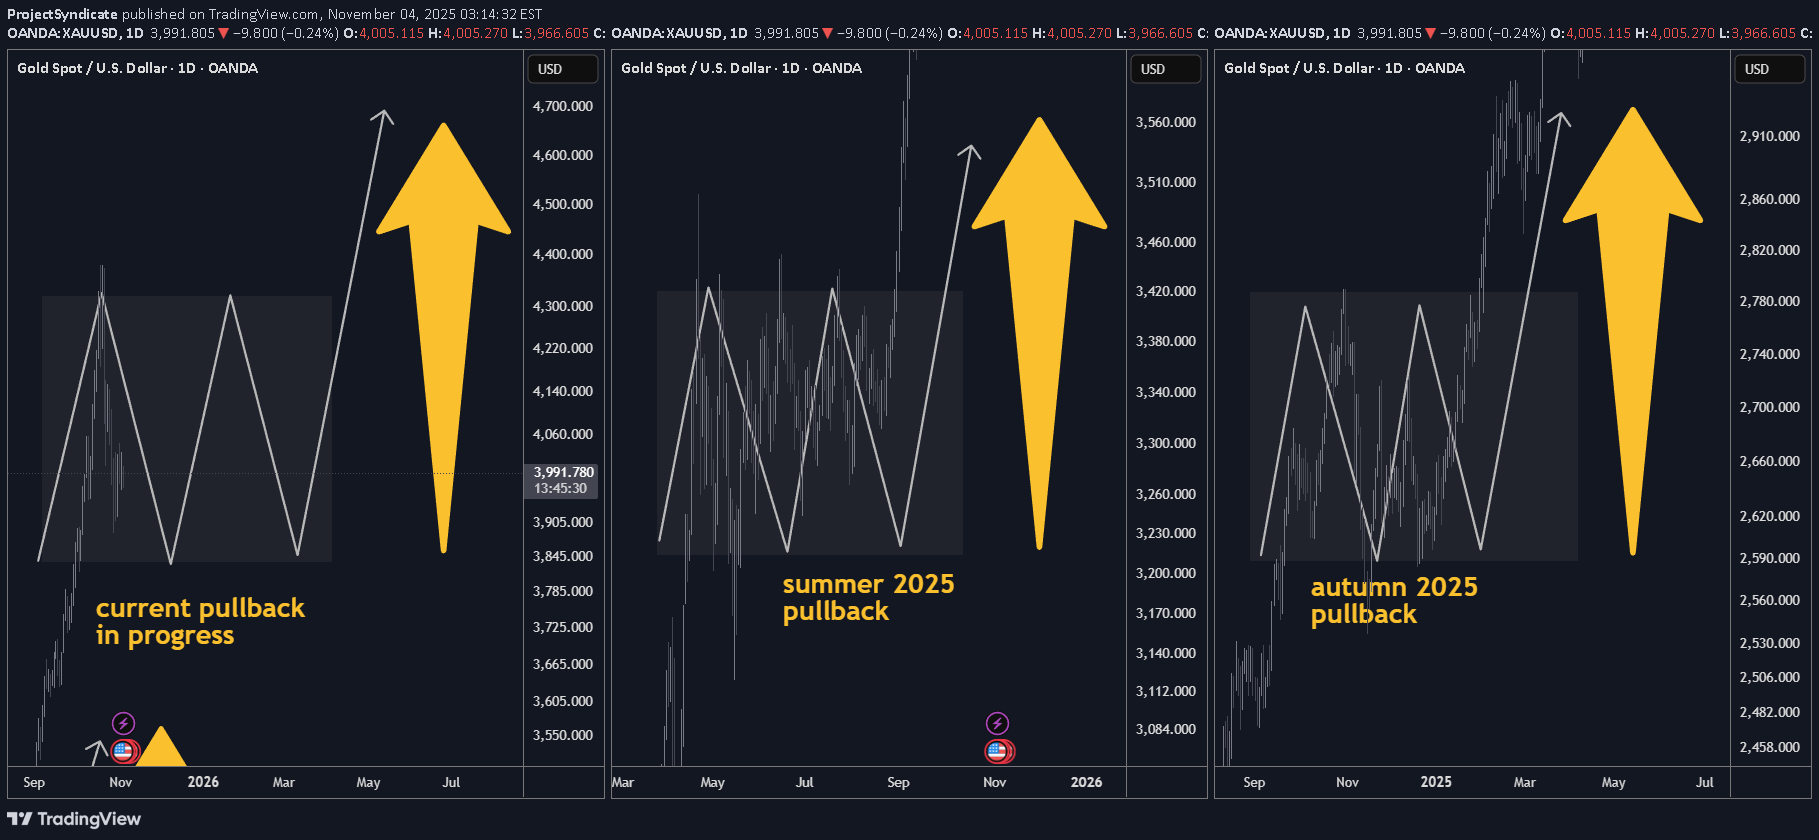
📌 Executive Summary •Base case (60%): The current pullback is a normal retracement within the primary bull trend. We expect consolidation through late Q4-2025 and potentially into January 2026, followed by a resumption of the uptrend in Q1/Q2-2026. •Drivers remain intact: Persistent central-bank accumulation, reserve-diversification dynamics, and episodic macro/geopolitical risk keep the structural bid under gold. •Positioning stance: Maintain core long exposure, add tactically on weakness into the $3.8k–$4.0k zone spot equivalent with tight risk controls, and ladder call spreads into Q2-2026. •Risk skew: Near-term pullback risk persists position shakeouts, macro data surprises. Structural bearish risks are low unless central-bank demand materially softens. ________________________________________ 🧭 Market Context & Recent Price Action •Gold printed successive record highs into mid-October; front-month futures traded above $4,170/oz before easing. Headlines framed the rally as policy and safe-haven led, with year-to-date gains exceptionally strong. •Central-bank demand continues to underpin the move: WGC and sell-side coverage highlight accelerating official-sector buying and diversification away from FX reserves; banks forecast higher prices into 2026. •The current setback aligns with prior bull-market pauses (e.g., Apr–Jul 2025 and Sep 2024–Dec 2024 pullbacks), consistent with the user-stated pattern of multi-month consolidations before trend resumption. What’s new in headlines late Oct–Nov 2025: •Pullback is “technical and temporary,” with buy-the-dip framing from UBS; next tactical target cited around $4,200. •Official-sector flows: Korea & Madagascar exploring reserve increases; PBoC extended buying streak into September. •WSJ coverage stresses gold’s role in erosion of trust in fiat/central banks and the reserve-diversification theme. ________________________________________ 🔑 Structural Bull Case 2025-2026 1.Official-Sector Accumulation: oMulti-year build in central-bank gold holdings (EM-led) as a sanctions-resilient reserve asset; this remains the single most important marginal buyer narrative. 2.Reserve Diversification & Financial Geopolitics: oEvidence that gold’s share of global reserves has risen while some institutions reassess currency composition. 3.Macro Volatility & Policy Trajectory: oPeriodic growth scares, policy pivots, and real-rate uncertainty sustain hedging demand. Street targets for late-2026 (e.g., ~$4,900 GS) anchor upside convexity. 4.Market Microstructure: oThin above prior highs and crowded shorts on pullbacks can fuel sharp upside re-accelerations when macro catalysts hit data, geopolitics, policy hints. ________________________________________ 📊 Technical Map Top-Down •Primary trend: Up. The sequence of higher highs/higher lows since 2024 remains intact; current move is a trend-within-trend consolidation. •Pullback anatomy: Prior bull pauses (Apr–Jul 2025; Sep–Dec 2024) lasted 2–4 months, with troughs forming on volatility compression and momentum washouts—a template for now. •Key tactical zones spot-equiv.: o$3,800–$4,000: First reload area prior breakout shelf / 50–61.8% of the last leg. o$4,200–$4,250: First resistance / re-acceleration trigger retests of breakdown pivots. o$4,350–$4,400: High congestion; decisive weekly close above here re-opens ATH extension. ________________________________________ 🗓️ Scenario Pathing Q4-2025 → Q2-2026 •Base Case 60% — “Consolidate then resume”: oSideways-to-lower into late Q4/Jan 2026 as positioning resets; range $3.8k–$4.2k. oBreakout resumption in Q1/Q2-2026 as macro and official flows re-assert. •Bullish Extension 25% — “Shallow dip, quick reclaim”: oSofter real yields / risk flare trigger swift recapture of $4.2k–$4.4k and new highs earlier in Q1-2026. oCatalysts: heavier central-bank prints, geopolitical shock, or earlier policy-easing rhetoric. •Bear-Risk 15% — “Deeper flush, trend intact”: oHawkish macro surprise or forced deleveraging drives $3.6k–$3.7k probes; structure holds unless official-sector demand meaningfully fades ________________________________________ 🧪 What to Watch High-Signal Indicators •Official-Sector Data: Monthly updates from WGC, IMF COFER clues, and PBoC reserve disclosures. Continuation of EM purchases = green light for the bull. •Rates & Liquidity: Real-rate direction and dollar liquidity conditions around data and policy communications. •Microstructure: CFTC positioning inflections, ETF out/in-flows a lagging but useful confirmation when they finally turn. •Asia Physical/Policy: China/Japan retail and wholesale dynamics; policy/tax headlines can create short-term volatility. ________________________________________ 🎯 Strategy & Implementation 1) Core: •Maintain strategic long allocation consistent with mandate e.g., 3–5% risk budget; avoid pro-cyclical reductions during orderly pullbacks. 2) Tactical Adds •Scale-in buy program within $3.8k–$4.0k •Optionality: Buy Q2-2026 call spreads (e.g., 4.2/4.8) on dips; fund via selling Q1-2026 downside put spreads around $3.6k–$3.7k where comfortable with assignment. 3) Risk Controls 🛡️: •Hard-stop any tactical adds on weekly close < ~$3.6k or if credible evidence emerges of official-sector demand reversal.🥇 Base Case: Normal pullback inside primary bull trend — consolidation likely till Jan ’26, rally resumes Q1/Q2 ’26. 💰 Drivers Intact: Central-bank buying, reserve diversification, & macro/geopolitical hedging sustain long-term bid. 🏦 CB Demand: PBoC, Korea, Madagascar add reserves; official-sector flows remain the key pillar. 📉 Current Pullback: Mirroring Apr–Jul ’25 & Sep–Dec ’24 pauses — 2-4 month digestion phase. 🪙 Tech Zones: Buy zone $3.8k–$4.0k | Resistance $4.2k | ATH trigger $4.35k–$4.4k. 📊 Scenario Path: 60% → Consolidate → Resume bull 25% → Quick reclaim > $4.2k 15% → Deeper flush $3.6k–$3.7k (trend intact). 🔔 Watch: WGC/PBoC data, real-rate trends, CFTC & ETF flows, Asia policy headlines. 🎯 Strategy: Maintain core long (3-5% risk); scale-in $3.8–$4.0k; add Q2-26 call spreads 4.2/4.8; hedge via Q1-26 put spreads. 🛡️ Risk Control: Cut if < $3.6k or CB demand fades — otherwise, stay gold & buy the dip.🎁Please hit the like button and 🎁Leave a comment to support our team!let me know your thoughts on the above in the comments section 🔥🏧🚀Gold Bull Market Outlook And Targets: 5000 USD/7500 USD
ProjectSyndicate
تحلیل طلا هفته آینده: سطوح حیاتی حمایت و مقاومت و پیشبینی معاملهگران
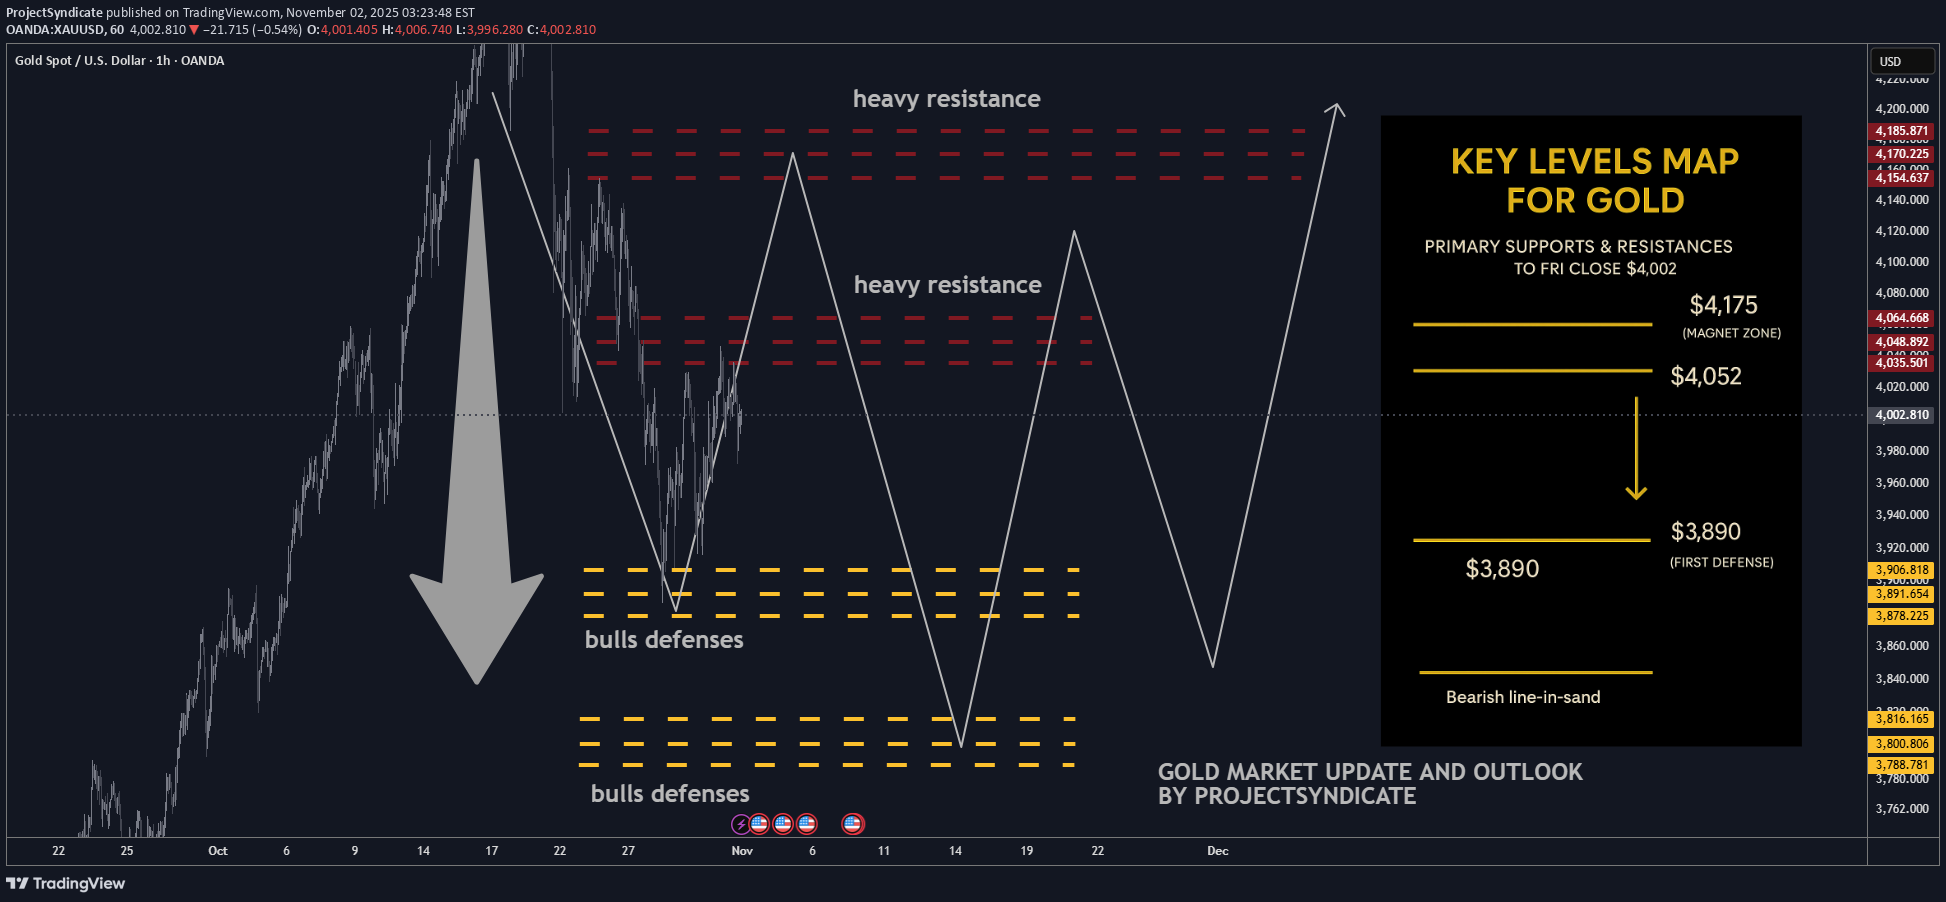
🔥 عکس هفتگی طلایی — توسط PROJECTSYNDICATE 🏆 زیاد/بسته: 4108 دلار → 4002 دلار - فروشندگان از سربار دفاع کردند. هفتگی نزدیک نرم در محدوده. 📈 روند: حالت خنثی / تصحیح همچنان روشن است. انتظار اوج های جدید در کوتاه مدت را نداشته باشید. 🛡 پشتیبانی: 3,890 دلار → 3,800 دلار - قفسه های محوری برای مهار در سمت پایین. 🚧 مقاومت ها: 4052 دلار / 4175 دلار - مناطق آهنربایی برای تلاش برای عرضه / محو شدن. 🧭 تعصب در هفته آینده: فروش های کوتاه را به 4052 تا 4175 دلار با سود برداشتی به 3890 → 3800 دلار ترجیح دهید. باطل شدن مطالبه مستمر > 4175 دلار؛ شکست 3800 دلار خطر گسترش کمتر. 🌍 بادهای دنباله دار کلان / بادهای مخالف: • نرخ ها: بازده واقعی پایدار به بنگاه بالا نگه داشته شود. هر گونه غافلگیری کبوتری می تواند جرقه ای را در جهت مقاومت ایجاد کند. • FX: DXY مختلط - فقدان ضعف گسترده USD، پیگیری تکانه را محدود می کند. • جریان ها: تقاضای CB/ETF در نزول های deep پشتیبانی می کند، اما نزدیک به اوج های ملایم است. • ژئوپلیتیک: ریسک رویداد پیشنهادهای متناوب را ارائه می دهد. این هفته یک محرک روند نیست. 🎯 نمای خیابان: روایتهای صعودی میانمدت تنوع را محفوظ میدارد، کاهش سیاستها تا سال 2026 باقی میماند، اما نوار کوتاهمدت به نفع بازگشت میانگین در شرایط مقاومت است. _____________________________________ 🔝 مناطق مقاومت کلیدی • 4052 دلار — سقف فوری؛ محور عرضه قبلی احتمالاً اولین آزمایشها را محدود میکند • 4175 دلار — مقاومت بالا. پذیرش بالا لحن را از اصلاحی به سازنده تغییر می دهد 🛡 مناطق پشتیبانی • 3890 دلار — اولین دفاع; از دست دادن کاوشگرهای تکانه را دعوت می کند • 3800 دلار - پایه ساختاری حیاتی. شکستن خطرات شتاب نزولی _____________________________________ ⚖️ سناریوی موردی پایه تجارت از محدوده به نرم بین 3800 تا 4175 دلار. رالی به 4052 تا 4175 دلار قابل فروش است. اگر فروشندگان فشار دهند، انتظار چرخش به 3890 دلار با دامنه تا 3800 دلار را دارید. 🚀 محرک شکست فقط پذیرش پایدار > ~ 4,175 دلار، اصلاح را نفی می کند و مسیر 4200 دلاری را باز می کند. برعکس، رد شرکت در 4052 دلار با بسته شدن روزانه <3890 دلار، شانس آزمون 3800 دلار را افزایش می دهد. 💡 رانندگان بازار • مسیر فدرال رزرو و بازده واقعی drift • نوسانات شاخص دلار • تن ETF/CB flow در شیب در مقابل ریپ • عناوین احساسات ریسک (ژئوپلیتیک/تجارت) 🔓 خطوط ماشه گاو / خرس • صعودی بالاتر: مرحله اصلاح 4,175 دلار در صورت حفظ احتمالاً به پایان رسید • نزولی زیر: 3,890 دلار → ریسک زیر 3,800 دلار افزایش می یابد 🧭 استراتژی فروش کوتاه مدت از مقاومت های سربار (4,052 $ → $4,175). سود را به 3890 دلار و سپس 3800 دلار مقیاس کنید. استاپ ها را بالاتر از سطوح ماشه محکم نگه دارید. تا زمانی که بازپرداخت پایدار بالای 4175 دلار شتاب خود را مجدداً تأیید کند، از خریدهای جدید کنار بیایید.🔥 عکس فوری هفتگی GOLD — PROJECTSYNDICATE 🏆 بالا/بسته: 4108 دلار → 4002 دلار — روکش نرم. سقف فروشندگان بالا بود 📈 روند: حالت خنثی/تصحیح همچنان روشن است — هیچ اوج جدیدی انتظار نمی رود. 🛡 پشتیبانی: 3890 دلار → 3800 دلار — طبقات پایین کلید. 🚧 مقاومت ها: 4052 دلار / 4175 دلار - مناطق تامین بالای سر قوی. 🧭 سوگیری: فروش کوتاه مدت به 4052 تا 4175 دلار → 3890 تا 3800 دلار هدف گذاری شده است. 💣 ابطال: بازپس گیری > 4175 دلار تلنگر صعودی. زیر 3800 دلار = ریسک عمیق تر. 🌍 کلان: بازدهی پایدار و سقف ثابت دلار صعودی؛ شیب های پشتیبانی شده توسط جریان های CB/ETF. ⚖️ Range View: تجارت 3,800 تا 4,175 دلار باقی میماند - احتمالاً افزایشها محو شد. 🚀 ماشه: پایدار > 4175 دلار = شکست. < 3890 دلار = ضعف مجدد. 🎯 استراتژی: فروش مقاومت، کسب سود در نزدیکی حمایت ها. در حال حاضر از آرزوهای طولانی خودداری کنید. نظرات خود را در مورد موارد فوق در بخش نظرات به من بگویید 🔥🏧🚀🎁لطفا دکمه لایک را بزنید و 🎁برای حمایت از تیم ما نظر بدهید!
ProjectSyndicate
اپل در مسیر ۴ تریلیون دلاری: پیشبینی Q1 2026 و کاتالیزورهای کلیدی هوش مصنوعی
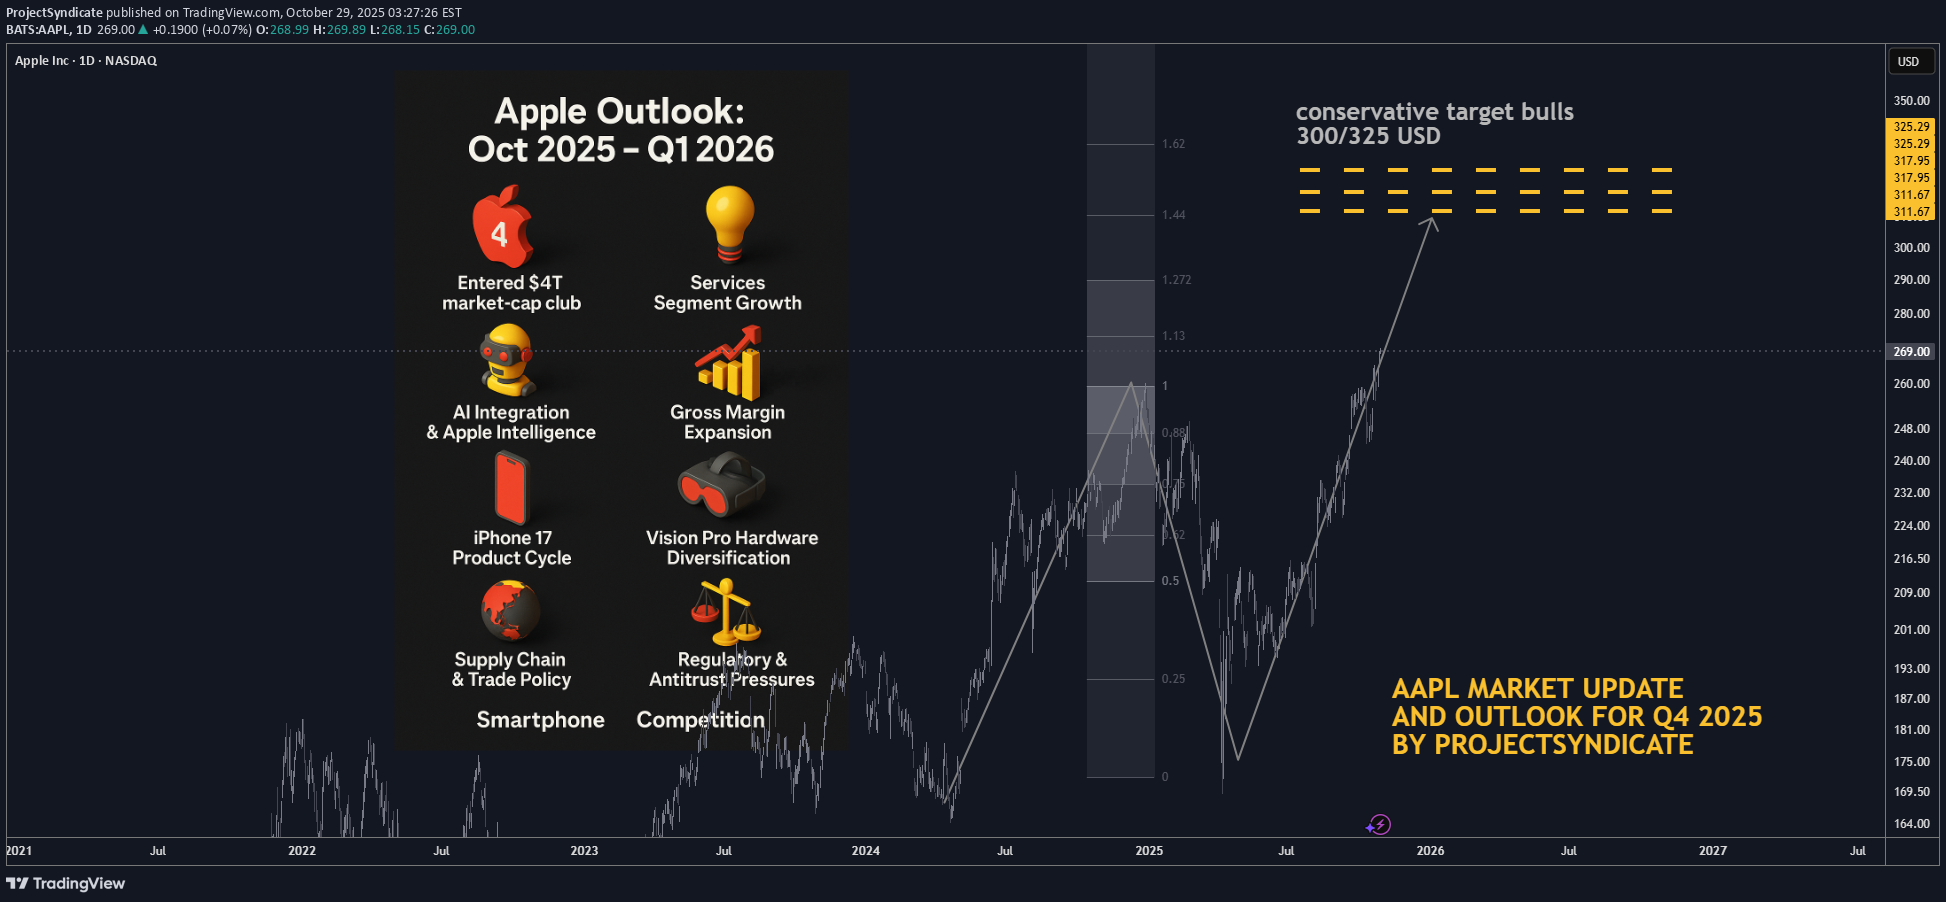
🍏 Apple Outlook: Oct 2025 – Q1 2026 🧠 Status and Tape Read. Apple (AAPL) has entered the $4 T market-cap club on Oct 28–29 2025, propelled by strong iPhone 17 sell-through and Services momentum. Shares pushed toward the $270 area intraday before easing, marking a powerful reversal from mid-year consolidation. Near-term, positioning is elevated into Thursday’s print; options imply ~±4% move on earnings. 📈 Path into Q1’26. Our base case shifts from a prolonged correction to a higher-low / buy-the-dip regime: dips toward the mid-$240s–$250s should attract sponsorship unless Services rolls over or China iPhone demand fades. A constructive tape through Q1’26 hinges on (1) Apple Intelligence engagement metrics, (2) iPhone 17 replacement/Android switcher rates, and (3) regulatory overhang. 📰 What’s New and recent headlines 🏆 Apple hits $4 T market value for the first time, joining Nvidia and Microsoft. Drivers: iPhone 17 traction and Services strength; stock up sharply since spring. 🗓️ Earnings set for Thu, Oct 30 (after-close); Street looking for growth in revenue/EPS; Services eyed >$100 B annual run-rate. 🔼 Loop Capital upgraded AAPL to Buy with $315 PT ahead of the move, citing iPhone cycle acceleration. 🧾 “Who Bought 8 Million Shares?” 🧺 JPMorgan Large Cap Growth Fund (SEEGX) increased its Apple position by ~8.15 million shares to ~32.9 million shares, per latest fund tracking. ⚙️ Catalysts Shaping Apple’s Stock Price in 2025–26 🤖 AI Integration & Apple Intelligence — Strength: 9/10 Rollout of on-device Apple Intelligence and upgraded Siri remains the core narrative into 2026. Look for user engagement datapoints and third-party app integrations at/after earnings. A positive read-through would validate the iPhone super-cycle argument. 💡 Services Segment Growth — Strength: 8.5/10 Consensus expects Services to push past a $100 B annual clip; durability watched versus regulatory pressure (DMA in EU, global app store scrutiny). A sustained >13% YoY growth print keeps multiple support intact. 📊 Gross Margin Expansion & Cost Efficiencies — Strength: 8/10 Management has guided 46–47% GM for FQ4 (tariff headwind embedded). Mix shift to Services + component deflation support FY26 margin resilience. 📱 iPhone 17 Product Cycle — Strength: 8/10 (↑ from 7.5) Early sell-through outpacing prior gen in the U.S. and China within first days; the iPhone 17 (incl. “Air”) is the incremental driver restoring unit momentum. 🥽 Vision Pro & Hardware Diversification — Strength: 7/10 Next-gen devices + Apple Intelligence tie-ins create optionality; still niche near-term but adds ecosystem gravity. 💵 Capital Returns — Strength: 7/10 $110 B buyback authorization remains a floor; watch cadence vs. stock at ATHs and post-print cash deployment commentary. 🌏 Supply Chain & Trade Policy — Strength: 6.5/10 China exposure/tariffs remain a swing factor; Apple has been absorbing some costs rather than pushing through prices on key models. ⚖️ Regulatory & Antitrust Pressures — Strength: 6/10 DMA compliance and global app store cases could trim Services take-rate; monitor any remedial changes called out on the call. 📈 Macro & Rates — Strength: 5/10 “Higher for longer” limits multiple expansion; any disinflation/soft-landing upside would expand P/E support. 🥊 Smartphone Competition — Strength: 5/10 Android OEM velocity still high in EM; Apple’s cycle needs sustained switcher share to outrun. 💼 Earnings Set-Up: FQ4 reporting Thu Oct 30 2025 📅 Consensus into print: • Revenue: ~$101–104 B (TipRanks ref: $102.2 B) • EPS: ~$1.74–$1.82 (TipRanks ref: $1.78) • Gross Margin guide: 46–47% (company indication) • Services: watch for >$100 B annualized pace confirmation • Implied move: options pricing ~±4% 🎧 Watch items on the call: Apple Intelligence activation/MAUs, iPhone 17 channel inventory, China mix, Services take-rate headwinds (EU), GM puts/takes (tariffs), cap-return cadence. 🎯 Street Positioning & Targets 🔼 Loop Capital: Buy, PT $315 (Oct 20/21 2025). 📊 General take: Many houses remain Overweight; focus turning to 2026 EPS power and AI monetization path. 🧭 Tactical View 0–3 Months 📈 Into/after print: Choppy but constructive. Chasing at ATHs is risky; prefer buy-on-weakness zones near $248–255 with stop discipline. A bullish guide/Services beat could sustain a breakout; a light AI engagement update or China wobble likely gets faded back into the mid-$250s. ⚠️ Risk-case: Regulatory headline or guide below mid-single-digit growth could quickly compress P/E and retest the $240s. 🚀 Bull-case: Clean beat/raise + AI usage KPIs → re-rate toward $290–300 into holiday. 🏁 Quick Milestone Recap 🥇 $4 Trillion Market Cap achieved on Oct 28–29 2025, making Apple the third public company (after Nvidia, Microsoft) to reach the level; iPhone 17 momentum and Services strength cited across coverage.🚀 Apple Outlook (Oct 2025 – Q1 2026) 🍏 Hit $4 T market cap, third company ever to reach the milestone. 🤖 Apple Intelligence & AI rollout driving next growth wave. 📱 iPhone 17 cycle strong, fueling demand recovery. 💡 Services segment on track for >$100 B annual run-rate. 📊 Gross margins guided at 46–47%, resilient vs. tariffs. 🥽 Expanding Vision Pro & AR/VR hardware ecosystem. 💵 $110 B buyback and dividends underpin valuation floor. 🌏 Supply-chain shift to India & Vietnam continues. ⚖️ Regulatory pressures in EU/US remain medium-term risk. 🧭 Base case: Buy-on-dips near $250 → target $290-300 if AI metrics beat.let me know your thoughts on the above in the comments section 🔥🏧🚀🎁Please hit the like button and 🎁Leave a comment to support our team!TSLA path to 550/650 USD Breakout Still PendingTSLA Catalysts Ranking: September 2025 update and Path ForwardGold next week: Key S/R Levels and Outlook for TradersGold Bull Market Update and Outlook Q4 2025 / Q1 2026
ProjectSyndicate
طلا سقوط کرد: آیا اصلاح قیمت تا ۳۵۰۰ دلار ادامه دارد؟
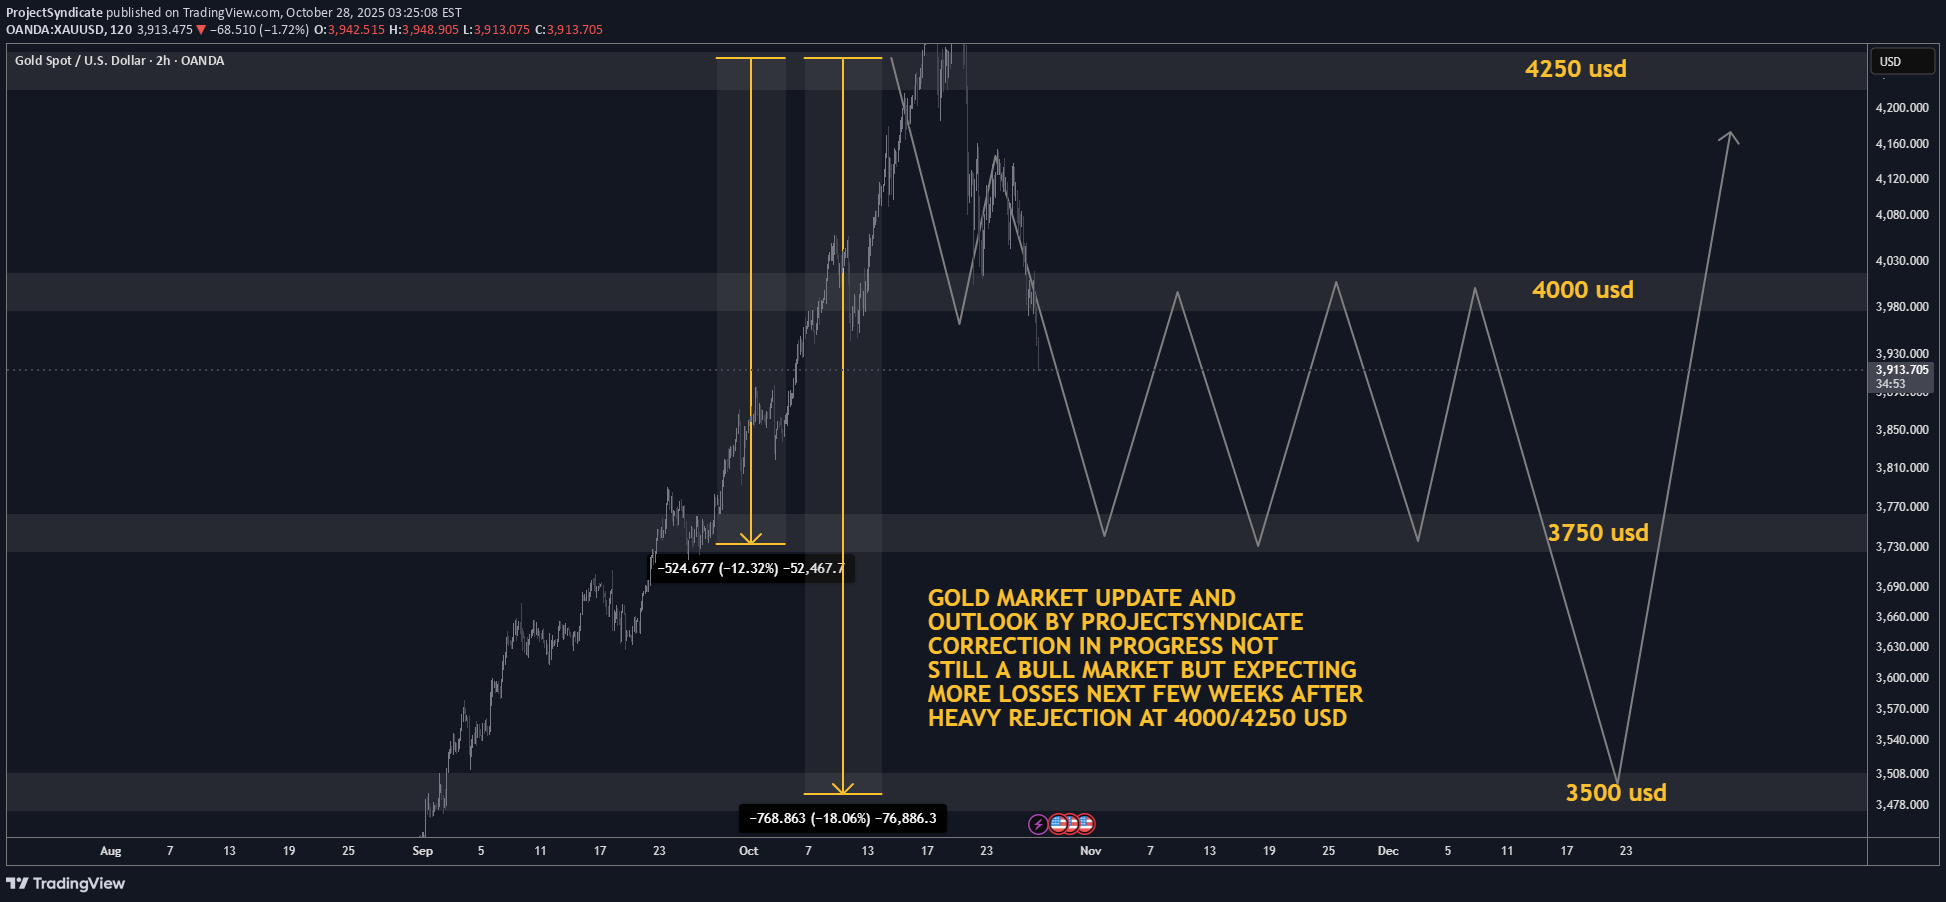
🟡 Where We Are Right now After ripping to fresh records, gold snapped hard — WSJ logged the steepest one-day loss in years last week and a follow-through weekly drop as longs unwound. Analysts across Kitco and others frame this as a technical/positioning correction after a parabolic run, with a fight around the $4k handle and scope to probe $3,750 → $3,500 if selling persists. Sentiment/flows flipped: GLD and other gold ETFs saw notable outflows into the selloff after heavy YTD inflows. That flow reversal is consistent with a near-term correction phase. 🔻 Why the Market Is Correcting Now 1️⃣ Positioning & Froth Unwinds The rally attracted outsized speculative length; once momentum cracked, forced de-risking kicked in. WSJ called out “long unwind” dynamics; Kitco says the correction could persist for months as near-term drivers fade. 2️⃣ $4k Failed on First Retest; Technical Break Triggered Stops Kitco flagged a “fight for $4k” with downside risk if that shelf gives. Once sub-4k prints hit, systematic sellers likely accelerated. 3️⃣ Flow Flip in ETFs After massive 2025 inflows, GLD posted a sharp daily outflow during the drop — classic late-cycle reversal behavior for a momentum move. 4️⃣ Macro Balance Less Supportive at the Margin Even with long-term tailwinds (deficits/geopolitics), the recent leg higher ran ahead of fundamentals. Kitco and others note easing physical tightness and cooling central-bank buying pace compared with earlier in the year, removing a key prop for spot. ⚙️ Near-Term Levels That Matter (Tactical) $4,000 → Battle zone. Regaining and holding above turns near-term tone neutral. $3,750 → First meaningful downside target; aligns with multiple analysts’ “healthy pullback” zone. $3,500 → Deeper correction magnet if flows/positioning continue to bleed; widely discussed as a plausible washout level. 🔮 4–8 Week Catalyst Map (What Can Push Price) 🏛️ Macro / Policy Treasury Quarterly Refunding (Nov 5): Mix/size guidance can sway the long-end, USD, and real yields — key for gold. A heavier bill tilt (and steady coupons) is less threatening than a surprise coupon ramp. Fed Communication Cadence: With the Oct 28–29 FOMC just occurred, watch minutes (Nov 19) + any guidance shifts. A less-dovish tone or firmer real yields = near-term headwind; growth scares or easing bias = support. US Data Prints: CPI/PCE, NFP, ISM — anything that re-prices the path of real rates. (Direction of real yields remains the single most important macro input.) 💰 Flows & Positioning ETF Flows (GLD/IAU): Continued outflows would confirm distribution; a turn back to net inflows often leads price inflections. COT Positioning: If spec length compresses materially, downside fuel diminishes — setting up a cleaner base. (Track weekly CFTC updates.) 🪙 Physical / Seasonal India Demand (festive/wedding season) and China retail demand can stabilize spot if discounts narrow and premiums re-emerge, but Kitco notes near-term tightness has eased versus the squeeze earlier in the rally. 📈 Base Case Outlook (Next 4–8 Weeks) Trend: We’re in a bull-market correction — momentum currently with sellers — inside a bigger, intact secular uptrend. WSJ + Kitco both frame it as a technical consolidation after a near-vertical ascent. Range Expectation: $3,500–$4,100 with whipsaws around $4k. The market likely tests $3,750 and could overshoot to $3,500 on negative macro surprises or persistent outflows before attempting a higher-low base. Bull Re-acceleration Triggers: (a) USD/real-yield rollover post-Refunding/Fed minutes (b) A visible reversal in ETF flows (c) Stabilization in Asia physical premiums (d) Fresh geopolitical shocks Bear Extension Risks: (a) Firmer real yields / stronger USD (b) Deeper ETF outflows and CTA/systematic supply (c) Evidence of slower central-bank demand than H1 (d) Soft physical uptake into dips ⚔️ Trade / Hedge Tactics If Underweight/Flat: Stagger bids $3,760 → $3,520, scale size smaller into weakness; insist on confirmation (stops above prior day’s high) before adding. If Long From Higher: Respect $3,750 — below it, tighten or partially hedge (short miners, long USD vs. FX beta, or buy short-dated puts) targeting $3,500 as a potential flush. If Momentum Trader: Let $4,000 decide regime. Sustained reclaims with rising on-balance volume/ETF creations = green light for a bounce to $4,080–$4,150; failure = fade rallies into $3,950–$3,980. 🧭 What I’m Watching Day-to-Day 1️⃣ Treasury refunding headlines (Nov 5) and term-premium reaction. 2️⃣ Fed minutes (Nov 19) and any shift in balance-of-risks language. 3️⃣ GLD/IAU flow tape (creations/redemptions). 4️⃣ Kitco/WSJ desk color on physical tightness and dealer inventories.🚨 GOLD MARKET CORRECTION: THE BULL PAUSES BUT NOT DEAD 🚨 💰 Gold peaked at $4,380, now sliding — momentum shifted to bears. 📉 Broke $4,000, spot near $3,920 — correction phase confirmed. 🔥 Overheated positioning + ETF outflows triggered the unwind. ⚙️ Next support: $3,750 → $3,500 key psychological zones. 🏦 Macro catalysts: Treasury refunding (Nov 5) & Fed minutes (Nov 19). 💵 Rising real yields / USD strength adding short-term pressure. 📊 ETF + COT flows will signal when washout ends. 🌏 India/China demand could stabilize spot in coming weeks. 🧭 Range view: $3,500–$4,100 over next 4–8 weeks. 🚀 Big picture: Still a bull market correction — reload zone coming soon.BREAK BELOW 3950/3960 USD EXPOSES FURTHER DOWNSIDE TARGETS TP1 3900 USD TP2 3850 USD. TP1 HIT ALREADY.
ProjectSyndicate
پیشبینی طلای هفته آینده: سطوح حیاتی حمایت و مقاومت برای معاملهگران
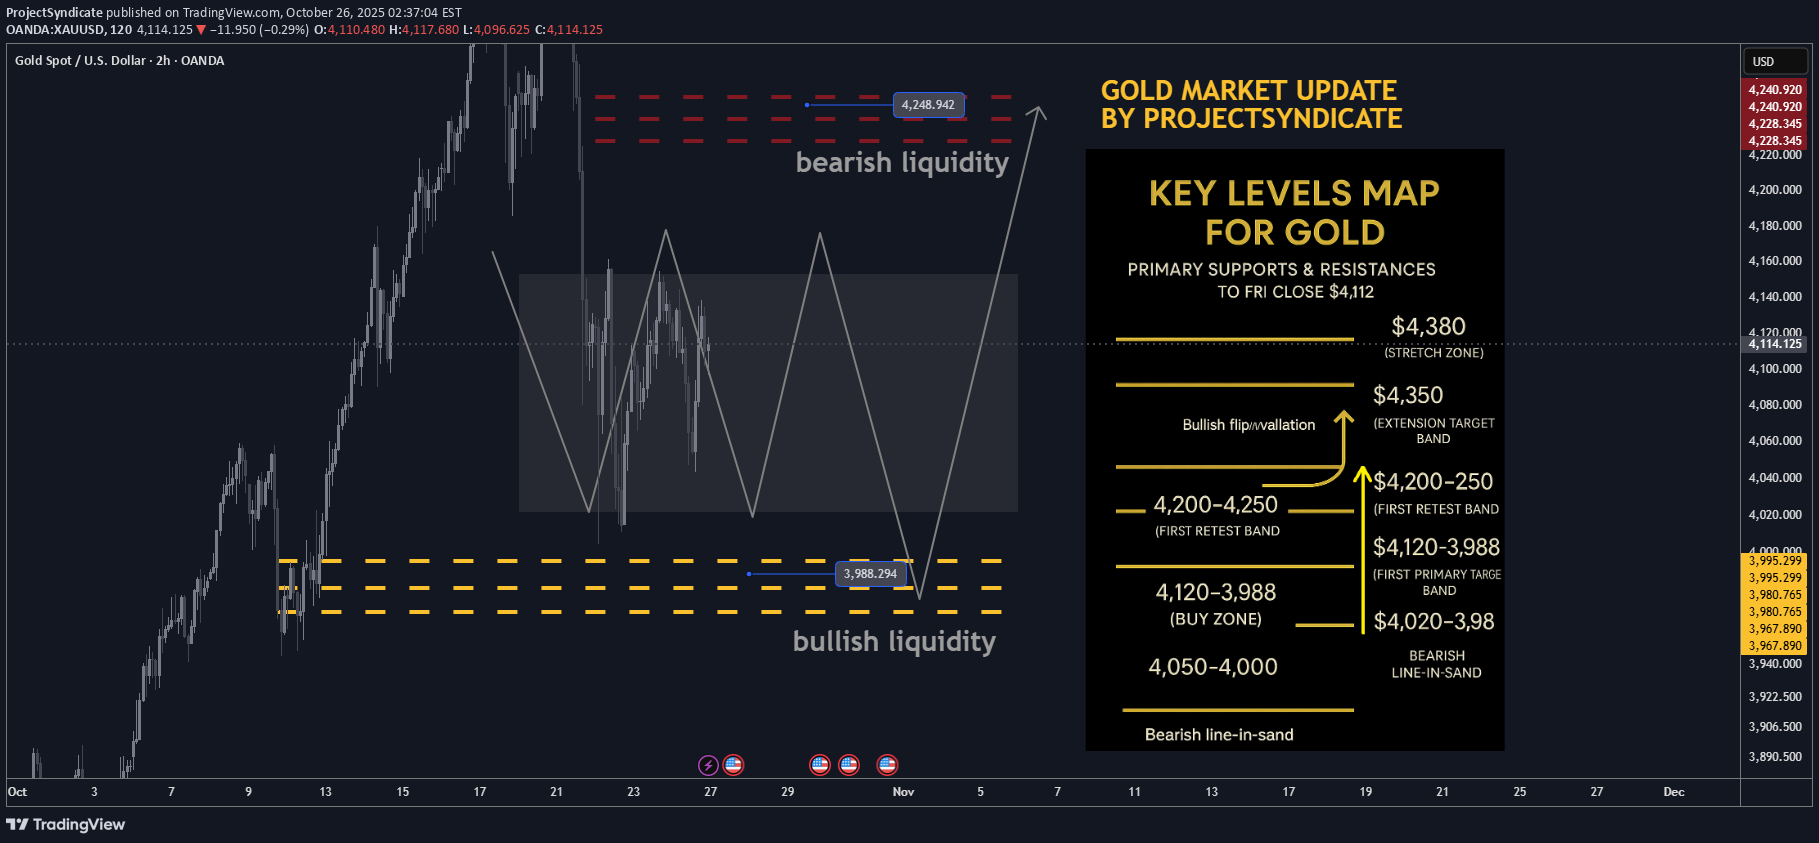
🔥 عکس هفتگی طلایی — توسط PROJECTSYNDICATE 🏆 بالا/بسته: 4380 دلار → 4112 دلار ← — بسته شدن پایین در محدوده. تکانه خنک شد اما دسته 4000 دلاری را نگه داشت. 📈 روند: روند صعودی دست نخورده > 4000 دلار؛ بیش از حد به 4.1 هزار دلار فروخته شد - راه اندازی به نفع جهش رفلکس است. 🛡 پشتیبانی: 4120-4080 دلار → 4020 تا 3988 دلار (نقدینگی صعودی) → 4000/3980 دلار باید حفظ شود. 🚧 مقاومت ها: 4200 دلار / 4250 دلار (نقد نزولی) / 4300 دلار → کشش 4350 تا 4380 دلار. 🧭 تعصب در هفته آینده: 4,020 تا 3,988 دلار با قیمت پایین بخرید. دوباره به دست آوردن مومنتوم بالای 4200 دلار اهداف 4250 دلار → 4300 تا 4350 دلار است. باطل شدن کمتر از 3980 دلار خطر افزایش عمق را به 3950 دلار دارد. 🌍 بادهای دنباله دار کلان: • خط مشی: کاهش بازده واقعی حمایتی در کاهش. • FX: لحن نرم تر USD = پس زمینه سازنده. • جریان: خرید بانک مرکزی + سود تاکتیکی ETF پشتوانه 4 هزار دلاری است. • ژئوپلیتیک: تجارت/تعرفه و تنش های منطقه ای پیشنهادات ایمنی را زنده نگه می دارد. 🎯 نمای خیابان: خانههای منتخب همچنان تا سال 2026 به قیمت 5000 دلار در هر اونس بر اساس روایتهای کاهش سیاست و تنوع ذخیرهسازی شناور هستند. _____________________________________ 🔝 مناطق مقاومت کلیدی • عرضه فوری 4200 تا 4230 دلار از بسته شدن هفتگی • نقدینگی نزولی 4250 دلاری / هدف اولیه • افزونه 4300 تا 4350 دلار band • 4,380 دلار سنبله قبلی بالا / کشش 🛡 مناطق پشتیبانی • 4,120 تا 4,080 دلار اولین آزمایش مجدد band در پایین بسته • منطقه خرید 4020 تا 3988 دلار (نقدینگی صعودی) • 4000 دلار / 3980 دلار قفسه ای که باید نگه دارید _____________________________________ ⚖️ سناریوی موردی پایه انتظار عقب نشینی به 4120 تا 4080 دلار و 4020 تا 3988 دلار را برای جذب خریداران داشته باشید و قیمت را به 4200 دلار و سپس 4250 دلار برگردانید. پذیرش بالای 4250 دلار باعث می شود که به 4300 تا 4350 دلار برسید. 🚀 محرک شکست فشار/پذیرش مداوم > ~ 4,250 دلار، 4,300 دلار → 4,350 دلار را باز می کند، در صورت تداوم حرکت، اتاق به 4380 دلار می رسد. 💡 رانندگان بازار • بازده واقعی drift کمتر (پسزمینه حمل حمایتی) • فلزات کمک کننده نرمی USD • انباشت CB در حال انجام. جریان ETF در شیب تثبیت می شود • ریسک اصلی (تجارت/ژئوپلیتیک) که تقاضای پناهگاه امن را حفظ می کند 🔓 خطوط ماشه گاو / خرس • صعودی بالاتر: 4020 تا 4100 دلار (خریداران از عقب نشینی ها دفاع می کنند) • نزولی زیر: 3980 دلار (ریسک افزایش می یابد؛ 3950 دلار را تهدید می کند) 🧭 استراتژی خرید پایین از نقدینگی صعودی (~ 3988 دلار) با هدف 4250 دلار. شرایط فروش بیش از حد به سود یک جهش قوی است. قدرت بالای 4200 دلار را به 4300 تا 4350 دلار اضافه کنید. ریسک را زیر 3980 تا 4000 دلار نگه دارید تا باطل شود. 🎁لطفاً دکمه لایک را بزنید و 🎁برای حمایت از تیم ما نظر خود را بنویسید! نظرات خود را در مورد موارد فوق در بخش نظرات به من بگویید. 2️⃣ روند: همچنان بالای 4000 دلار صعودی است. فروش بیش از حد = راه اندازی پرش. 3️⃣ پشتیبانی: 4,120 تا 4,080 دلار → 4,020 تا 3,988 دلار 💪 4️⃣ مقاومت ها: 4200 دلار / 4250 دلار / 4300 تا 4350 دلار 🚧 5️⃣ تعصب: نزول های نزدیک به 4020 تا 3988 دلار بخرید → 4250 تا 4350 دلار هدف گذاری کنید. 6️⃣ بی اعتباری: < 3980 دلار = ریسک نزولی ⚠️ 7️⃣ بادهای دنباله دار کلان: دلار نرم، بازدهی کمتر، خرید CB 🌍 8️⃣ شکست: > 4250 دلار باز 4300 تا 4380 دلار 🚀 9️⃣ نمای خیابان: 5000 دلار در هر اونس تا سال 2026 هنوز روی میز است 🎯 🔟 استراتژی: انباشت نزول ➕ نگه داشتن بیش از 4000 دلار 🧭
ProjectSyndicate
پیشبینی ریاضیاتی دقیق: کف بعدی بیت کوین کجاست؟ (احتمال ۹۵ هزار دلار)
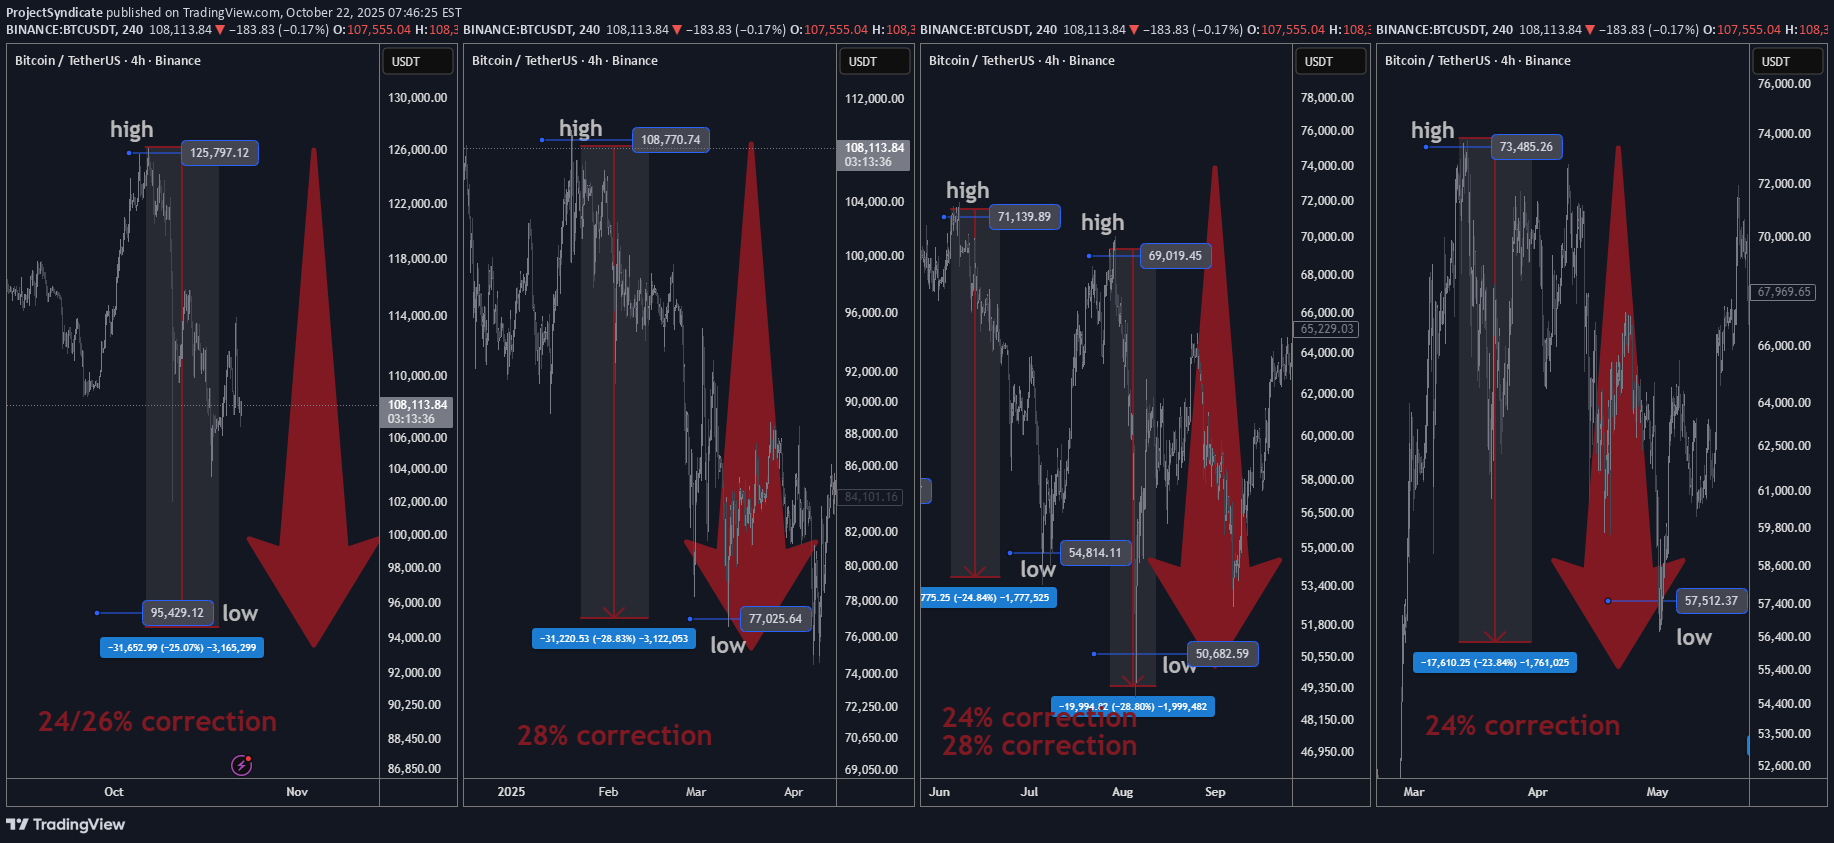
Bitcoin به طور مکرر ~ اواسط 20٪ در طول 12 تا 24 ماه گذشته اصلاح شده است. با استفاده از این نمایه کاهش تجربی، یک تصحیح پایه 25 درصدی از قیمت 126000 دلاری اخیر حاکی از **کمترین تصحیح احتمالی نزدیک به 94500 تا 95000 دلار است. این یک پیش بینی با احتمال بالا بر اساس ریاضیات و آمار واقعی است، نه علم داستان بدون مثلث در حال گسترش، تعداد موج الیوت، الگوهای گرگ و اژدها. Bitcoin بر اساس کتاب درسی معامله نمی شود. این TA دنیای واقعی توسط یک معامله گر pro است. دیدگاه تاکتیکی: در صورت تایید ساختار بازار و شرایط نقدینگی، انتظار یک تراز نهایی به سمت ~ 95000 دلار را داشته باشید، سپس یک بازگشت / جهش داشته باشید. اعتماد: بسیار بالا - ثبات الگو قابل توجه است، اما رمزارز همچنان به سرفصل و نقدینگی حساس است. از کنترل های ریسک منضبط استفاده کنید. 🧠 2) اصلاحات اخیر (12 تا 24 ماه گذشته) #بالا → کم درصد کاهش 1$72,000 → $54,00025% 2 $108,000 → $76,00028% 3 $70,000 → $50,00028% 4 $74,000 → $56,00024% کاهش میانگین تجربی: (25+28+28+24)÷4 = 26.25%. ما از 25% به عنوان فرض پایه استفاده کرد (محافظه کارانه در مقابل میانگین 26.25%). ✅ پیش بینی برای اصلاح فعلی بالاترین مرجع: 126000 دلار موارد پایه (25%) کم: 126000 دلار × (1 − 0.25) = 94500 دلار میانگین تجربی (26.25%) کم: 126000 دلار × (1 − 0.2625) = 92925 دلار منطقه خرید پیش بینی شده: 92.9 هزار دلار تا 95 هزار دلار، نزدیک به 95 هزار دلار. 🎯 نظرات خود را در مورد موارد بالا در بخش نظرات به من اطلاع دهید 🔥🏧🚀🎁لطفا دکمه لایک را بزنید و 🎁برای حمایت از تیم ما نظر بدهید! Bitcoin عظیم نهنگ 122,000,000 دلار را آغاز می کند BTC کوتاه dailyhodl.com/2025/10/21/massive-bitcoin-whale-initiates-whopping-122000000-btc-short/No BTC با 100k معکوس نمی شود، زیرا کسی به شما گفته است X یا معامله گران TikTokpro از MACDW RSI و غیره استفاده نمی کنند useless معامله bitcoin را فراموش کنید که نتیجه نمی دهد، تجزیه و تحلیل قبلی خود را در زیر منفجر کرد. الان فصل bitcoin نیست. الان فصل خرس است به روز رسانی بازار گاو طلا و چشم انداز Q4 2025 / Q1 2026 پسران ماه کجا هستند؟
سلب مسئولیت
هر محتوا و مطالب مندرج در سایت و کانالهای رسمی ارتباطی سهمتو، جمعبندی نظرات و تحلیلهای شخصی و غیر تعهد آور بوده و هیچگونه توصیهای مبنی بر خرید، فروش، ورود و یا خروج از بازارهای مالی نمی باشد. همچنین کلیه اخبار و تحلیلهای مندرج در سایت و کانالها، صرفا بازنشر اطلاعات از منابع رسمی و غیر رسمی داخلی و خارجی است و بدیهی است استفاده کنندگان محتوای مذکور، مسئول پیگیری و حصول اطمینان از اصالت و درستی مطالب هستند. از این رو ضمن سلب مسئولیت اعلام میدارد مسئولیت هرنوع تصمیم گیری و اقدام و سود و زیان احتمالی در بازار سرمایه و ارز دیجیتال، با شخص معامله گر است.