
yagizatokersoy
@t_yagizatokersoy

What symbols does the trader recommend buying?
Purchase History
پیام های تریدر
Filter
Signal Type
yagizatokersoy
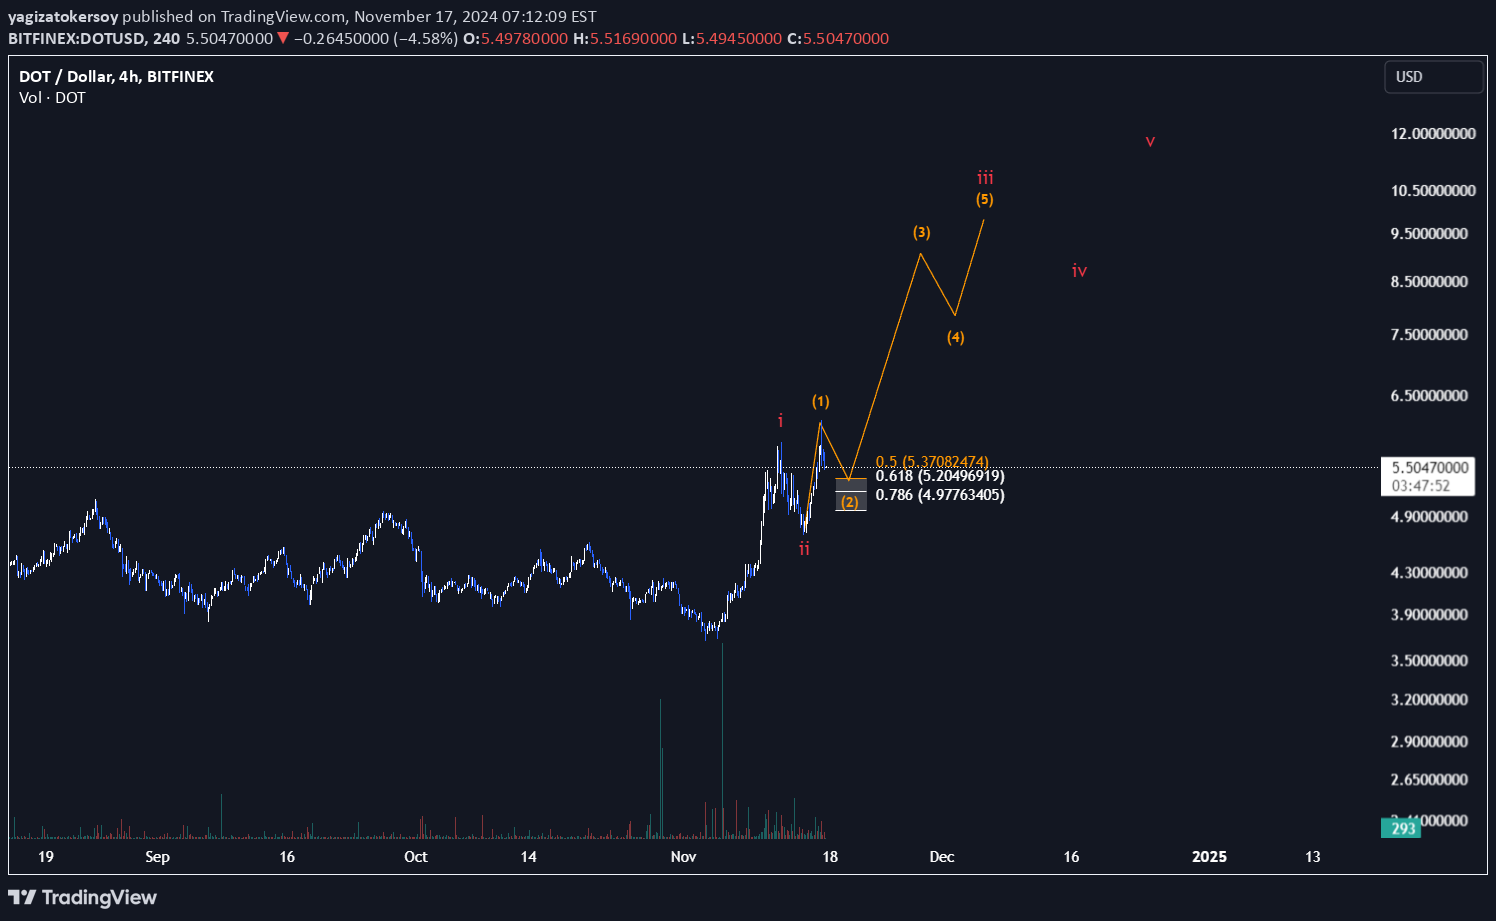
Polkadot (DOT) - Elliott Wave Subwave AnalysisIn Polkadot's short-term analysis, the current price action suggests that the market is forming the 2nd corrective subwave of a larger impulsive wave structure. This subwave is part of the initial stages of an Elliott Wave sequence.Once this correction concludes, the next phase is anticipated to be the 3rd subwave, which is typically characterized by strong upward momentum within the wave hierarchy. If this scenario plays out, the 3rd subwave could potentially test or break key resistance levels.Disclaimer: This analysis is purely for educational and informational purposes and should not be considered financial advice. Please conduct your own research or consult a professional before making any trading decisions.Seems that orange (2) is nearly completed or one last little dump to start a huge impulsive to the upside :)
yagizatokersoy

The initial signs of an alt season are now emerging, and this aligns with my primary Elliott Wave scenario for CHAINLINK's price movement. This is not financial advice, but I'll continue updating the chart as the scenario progresses.
yagizatokersoy

I do not truly believe that this alternative count will materialize, but it remains a valid possibility. Please check my charts and follow the price actions.Enjoy :)
yagizatokersoy

The main bullish count is shown on the chart. We are forming a wedge pattern unless the fifth wave expands to the level highlighted on the chart. I will also share an alternative idea for LINK.
yagizatokersoy
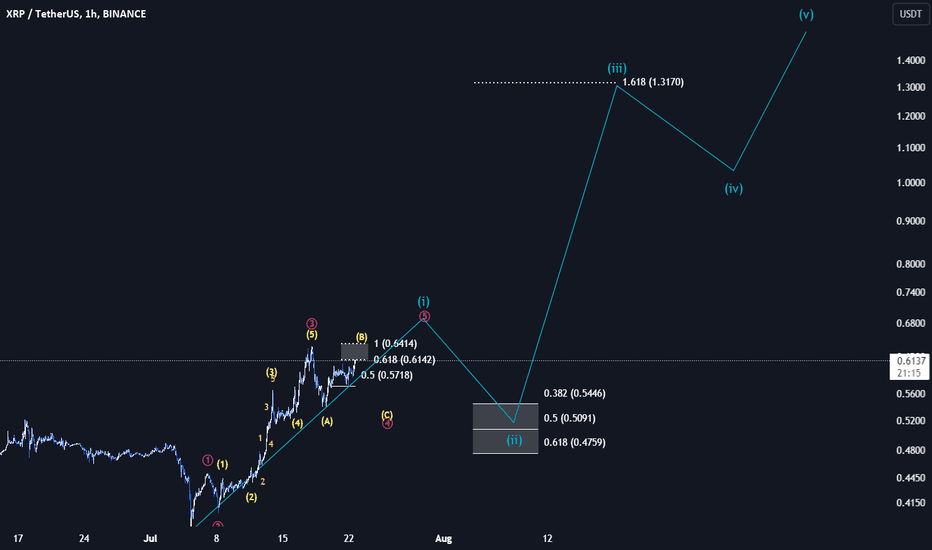
Bullish IdeaCorrective waves often occur in complex patterns. It is uncertain whether they will form a triangle, double zigzag, or flat variation. However, if we observe a clear five-wave upward movement, we can conclude that a bullish setup is emerging for XRP after a prolonged period.I will upload the alternate count soon as well:
yagizatokersoy

As previously mentioned, I anticipated the price to reach approximately 10.6 levels when it was trading around 14 dollars. Today, LINK has reached 11 dollars, which may represent the bottom. The head and shoulders pattern has not yet been confirmed and appears more likely to be manipulative.
yagizatokersoy

If we check smaller timeframes, we can see only two options from my point of view. One is the orange option, and the alternative is the red option. That is why I will wait for 2-3 days to see the count from the bottom. I have already bought some spot but still need confirmation that I am correct.
yagizatokersoy

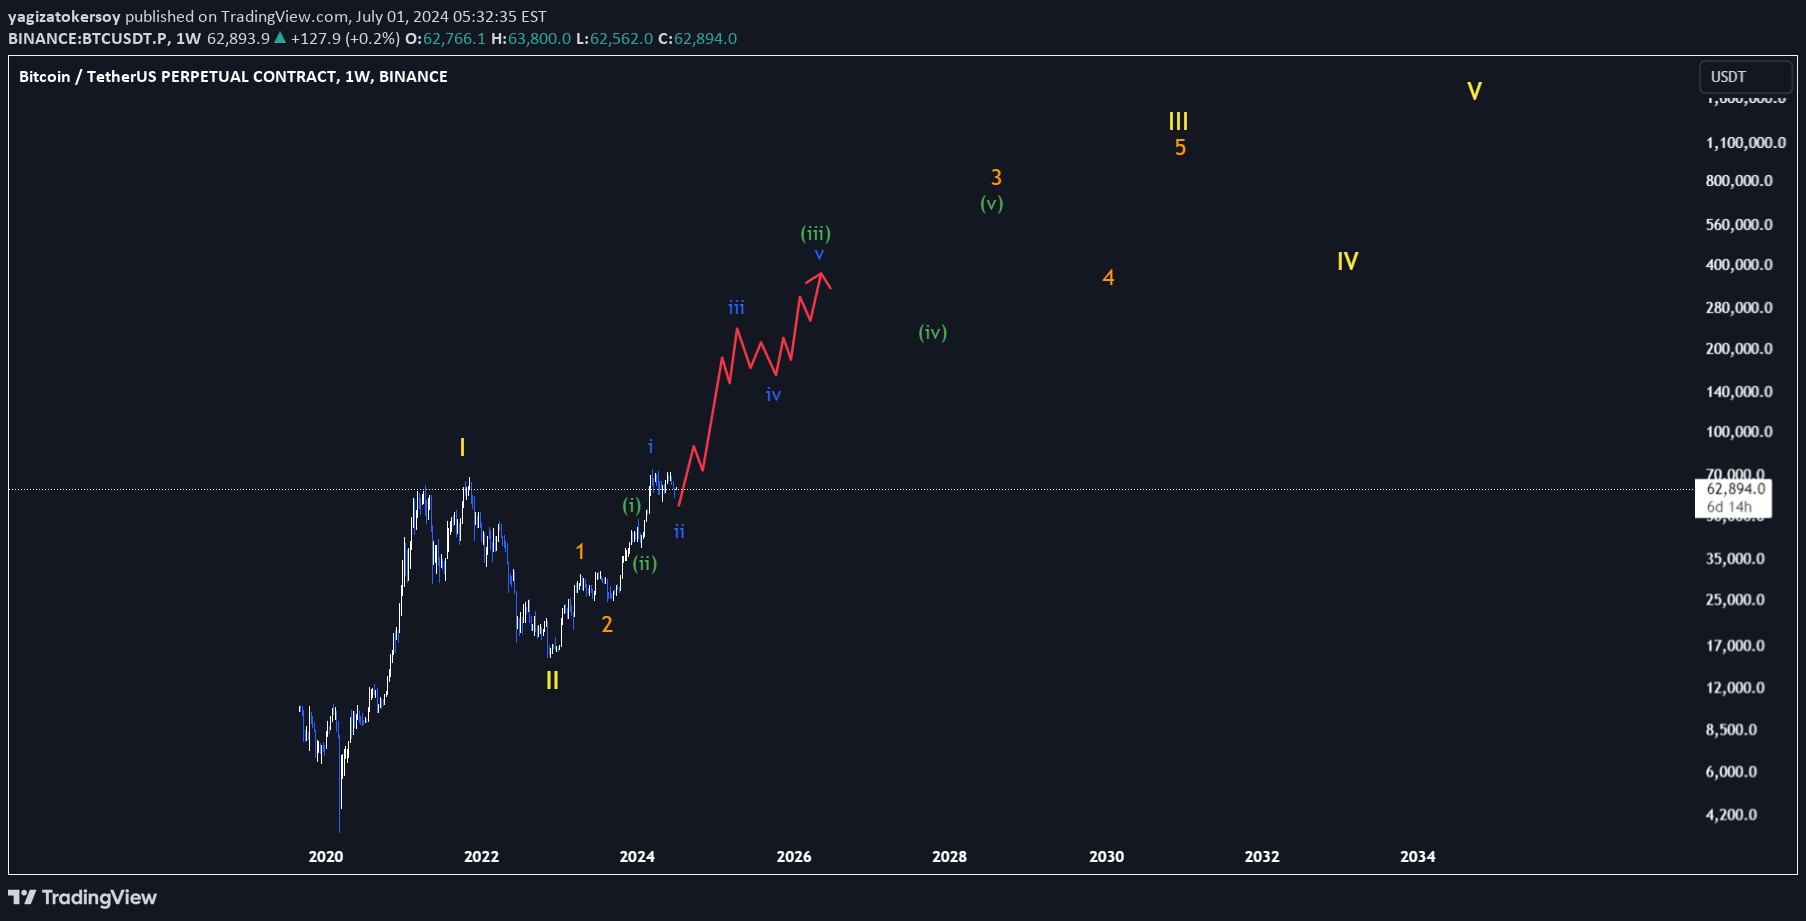
check the analysis I have mentioned last week on BTC. The Chart is progressing exactly as I drew it. We are close to bottom or the bottom is already in.Not a financial advice.
yagizatokersoy
My main count is shown in the chart. It is not a financial advice and I did not give the exact targets for those because need to watch little more but the structure is likely to happen.Good luck
yagizatokersoy

The Bottom Area Of Second Wave 8.9-10.5$ Thırd Wave Target Wıll Be 121$ As The Lowest.The Approxımate Date For The End Of Second Wave Is Between 27th Of July- 28th Of August
Disclaimer
Any content and materials included in Sahmeto's website and official communication channels are a compilation of personal opinions and analyses and are not binding. They do not constitute any recommendation for buying, selling, entering or exiting the stock market and cryptocurrency market. Also, all news and analyses included in the website and channels are merely republished information from official and unofficial domestic and foreign sources, and it is obvious that users of the said content are responsible for following up and ensuring the authenticity and accuracy of the materials. Therefore, while disclaiming responsibility, it is declared that the responsibility for any decision-making, action, and potential profit and loss in the capital market and cryptocurrency market lies with the trader.