
vs_sayin
@t_vs_sayin

What symbols does the trader recommend buying?
Purchase History
پیام های تریدر
Filter
vs_sayin
تحلیل تکنیکال HYPE: سیگنال انفجاری با الگوی سر و شانه معکوس!
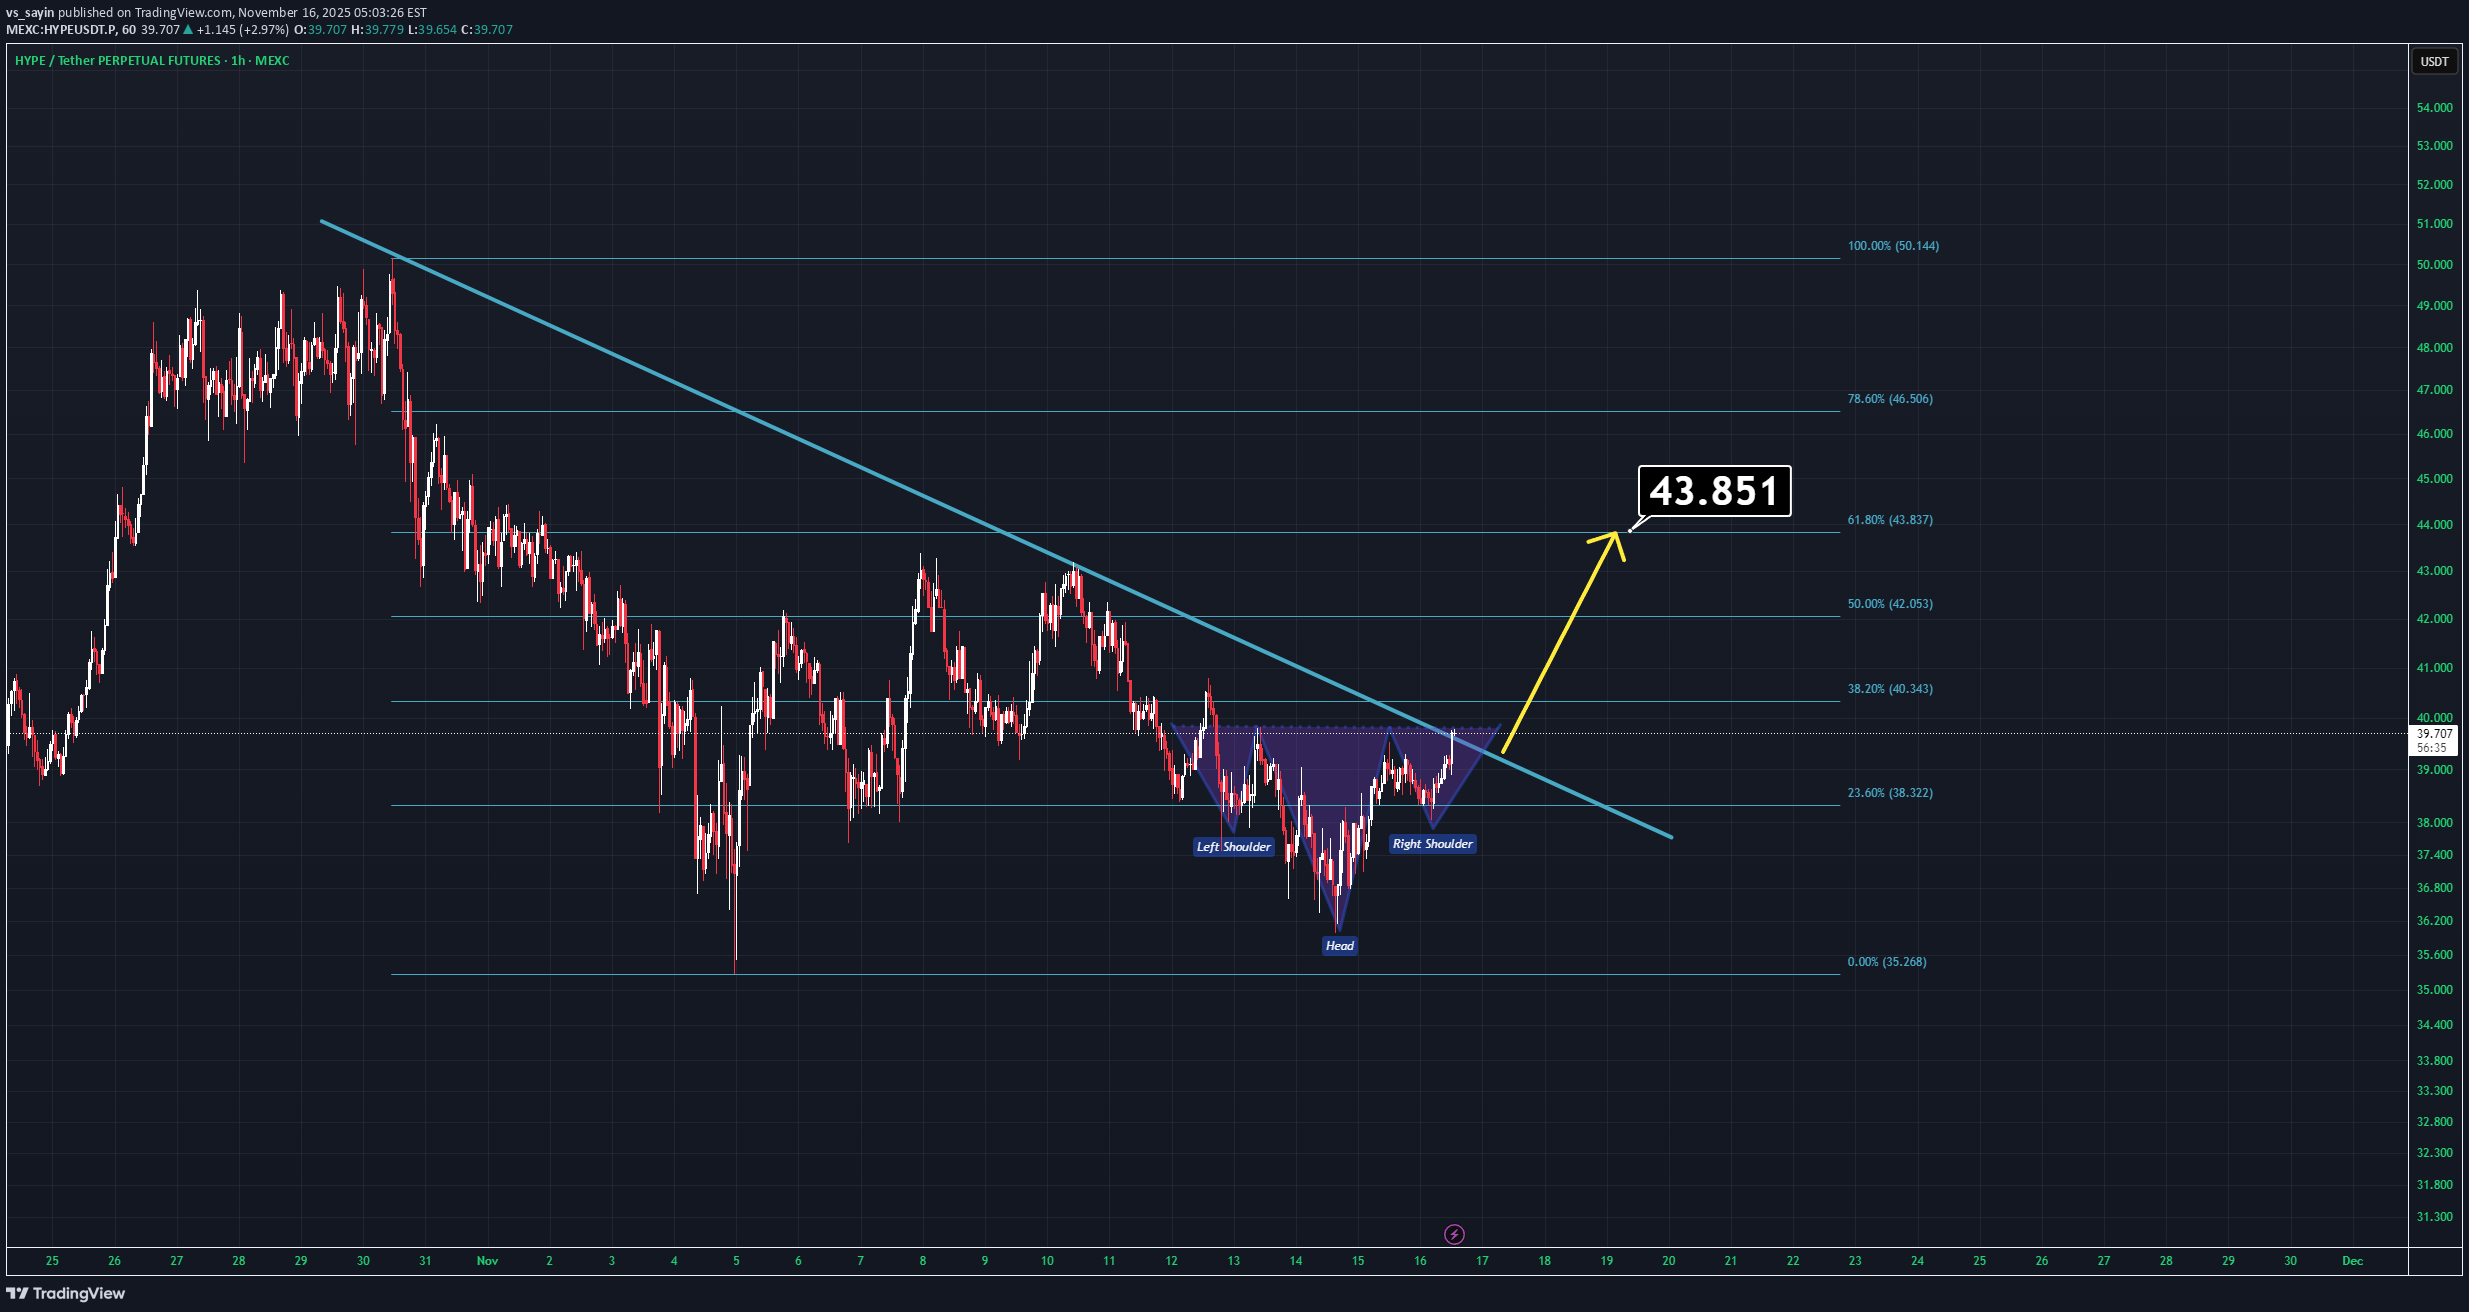
Very basic PA pattern has formed on HYPE/USDT short term chart. Trendline is about to be gone and there is inverse head and shoulders pattern which is going to be broken very soon. I believe the target must be around 0.618 retracement levels. Have a good day.
vs_sayin
تحلیل بیت کوین: تأیید مجدد ریزش؛ آماده خونریزی در بازار باشید!
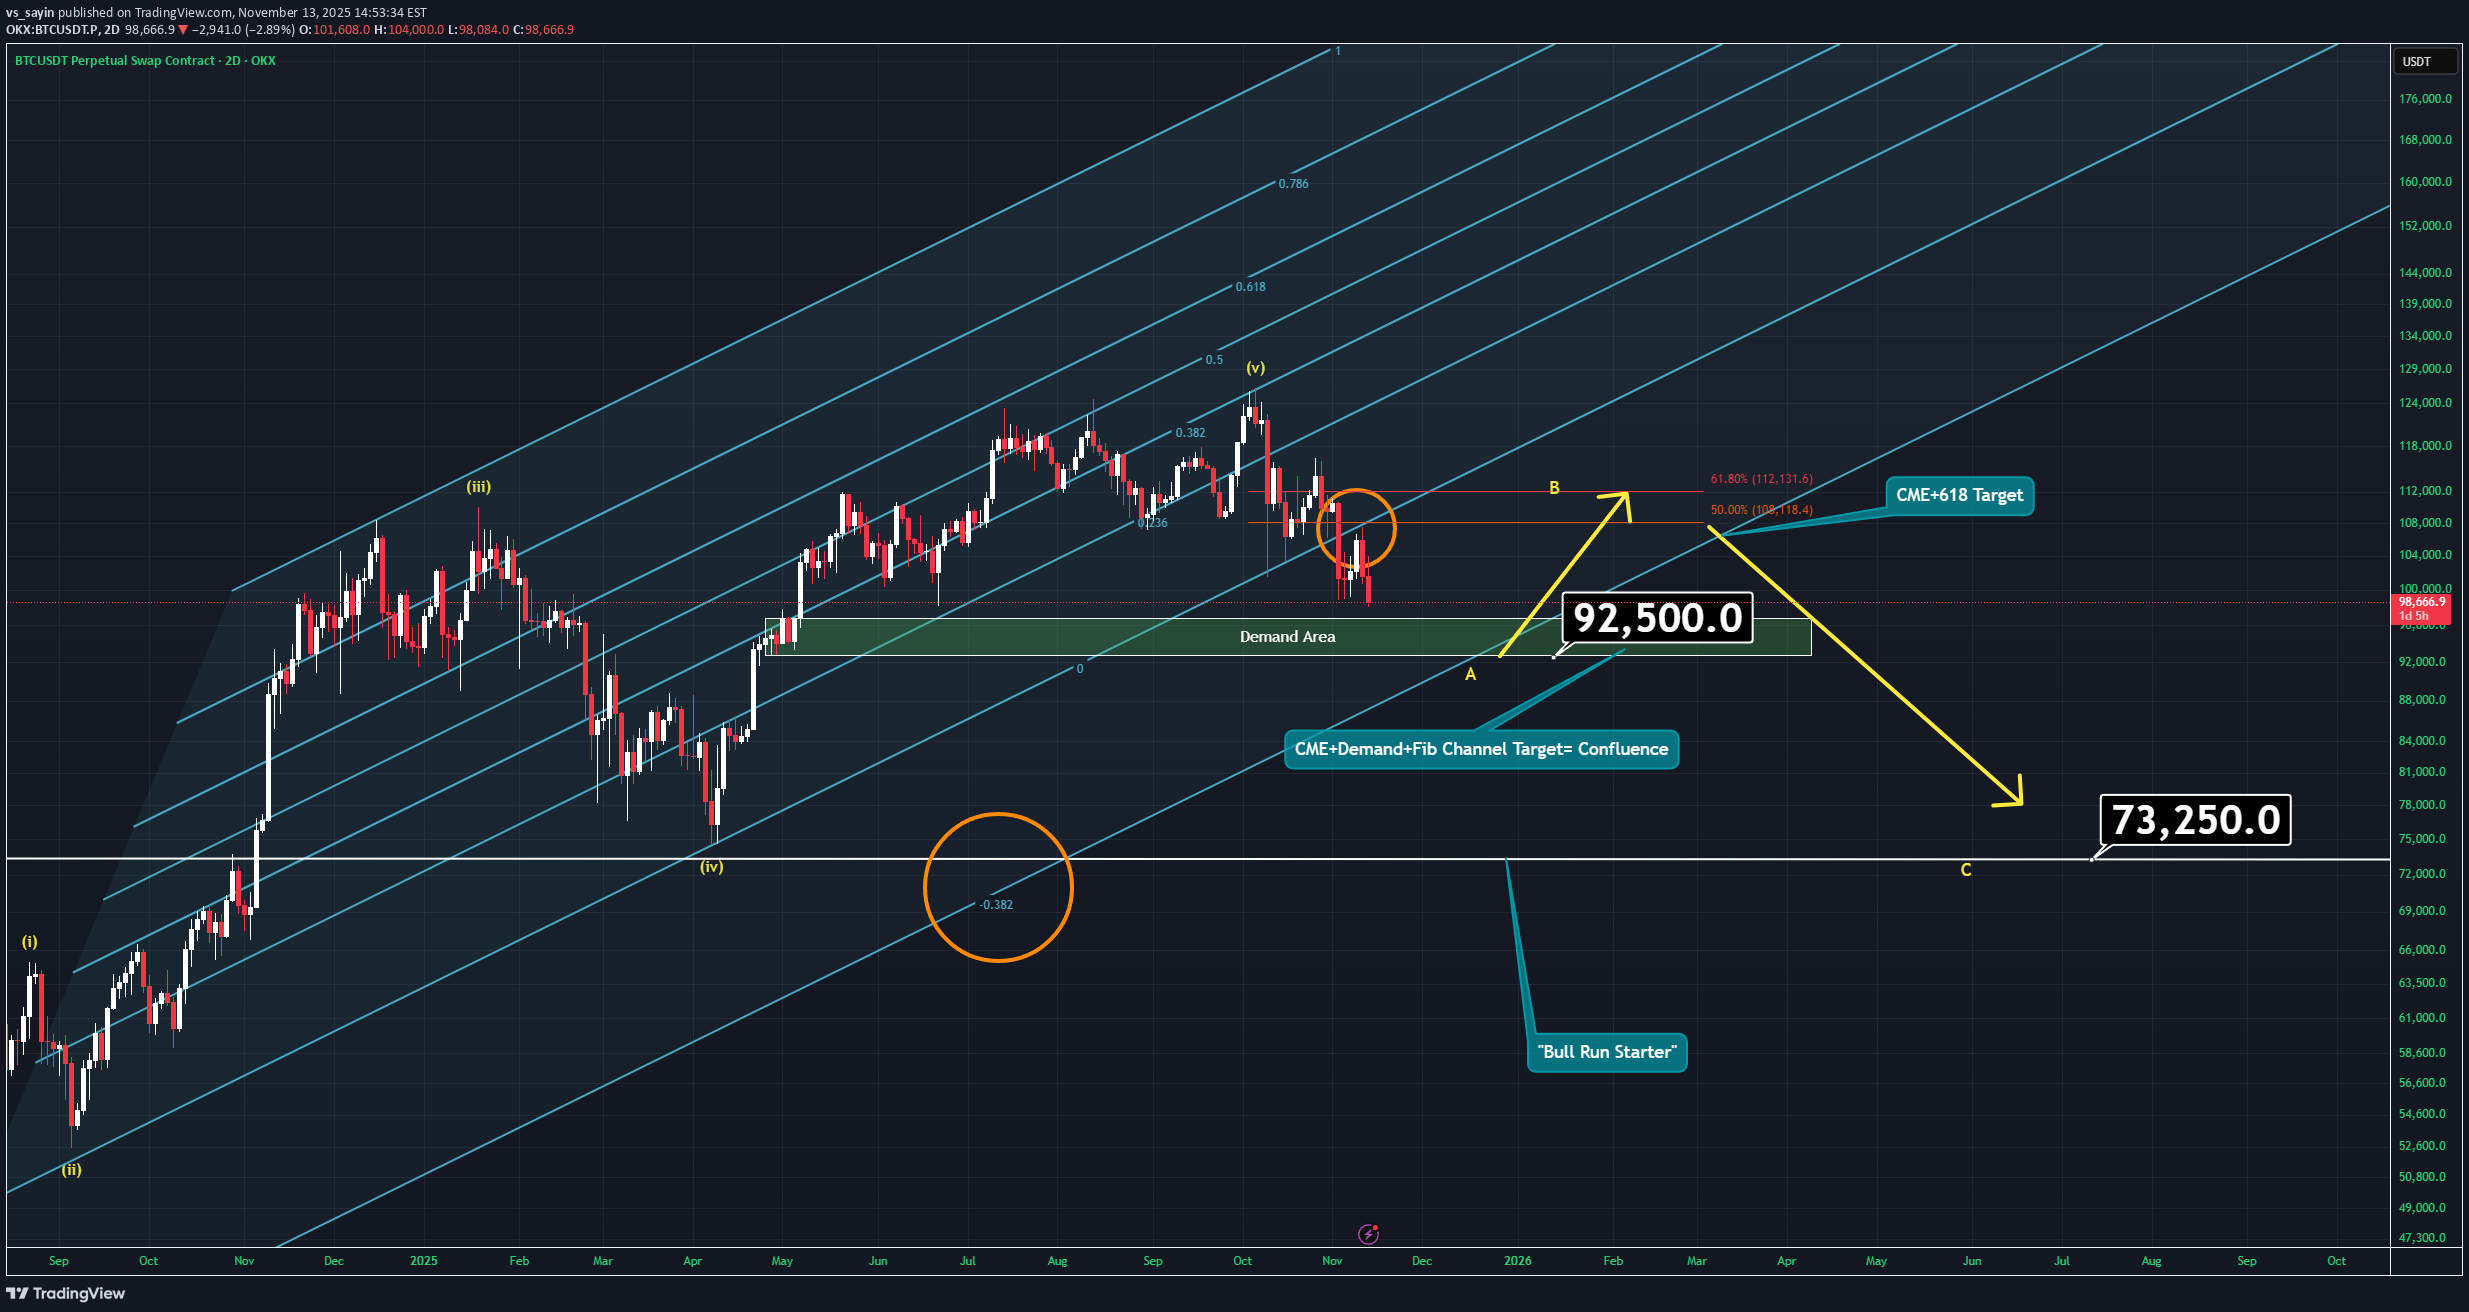
Hello everyone. I must say that it's not very easy to say it loud but for a short period of time, the Bulls have lost the fight. According to several factors, the next two months will be blood-colored in the entire market. Get ready to bleed. Because your portfolio will. So will you. Okay, but why? Let's see; Fundamental Factors: -The USA is still creating more tension around the globe. Only last week, the USA has operated a huge campaign over the Caribbean Sea. And yes, if you ARE a trader, you'll follow these kinds of events because this market is not a playground for kids. -The USA has finished its recession today but for the first time in history it took a lot of time for them to solve the problems. During the "solving" phase, the market has already calculated the fair prices for so-called "bullish news". By “bullish”, I mean reopening the USA, which is not actually bullish at all because it was never meant to be happening in the first place anyway. -Today the USA senate has talked about another export restriction for China. This actually is the trigger for today’s red candles. -The FED is still telling people the same story about inflation. Their utopian targets for inflation are not realistic and they know it as well. Powell has marked that there might be no rate cuts in December after all. Personal thoughts: There will be. In the short term? BEARISH. -Another thing to consider is the ETFs. Remember what happened in the market when BTC and ETH ETFs were listed? This is what's happening at the moment. History just repeats itself again and again. Many altcoin ETFs will be approved during this month. This will trigger another event called "accumulation". Hedge funds and other customers will seek to buy the dip. Therefore, they will push the prices of ETF-listed altcoins to the bottom so they can buy at lower prices while your portfolio melts. CEXs will also help them do so by letting them manipulate the order book via fake resistance orders. Sorry, but this is how it works. Now the fun part. Let's talk about the Technical Factors: -For this time I'll start with USDT dominance. There is not much to talk about but I'll leave a link so you can examine. The entire market will remain bearish as long as this parameter stays above 5.2%. https://www.tradingview.com/x/nyXxb4KA/ -Another thing to keep an eye on is the S&P index, which is looking very bearish due to uncertainty around the globe and for the most part the US. -Let's get back to BTC. In previous analysis, I already explained to you what might be coming soon and we might actually have been at the end of wave 5. Well, sadly that analysis worked. Yes, sadly because I want this market to grow. At the moment we are going to see an A-B-C correction pattern and it will take a few weeks to complete. During this era, you need to be careful about two things: Don’t even think that getting a swing long position to hold for 2 years will work. You will see a correction through 110K soon but it will only be wave B. So, if you're carrying long-term hedge positions, you'll need to watch for an ENGULFING daily candle in Bitcoin around 92K. That's where the CME gap was left — also a demand area and moreover, there is Fib channel confluence. Before that “engulf” happens, I'd not suggest lowering breakeven in losing positions. The wave 5 also will be a perfect trap for newcomers and for people who don't know much about the market. Many will jump into altcoins when they're cheap, but most likely they will be cheaper around March 2026. Bitcoin has already completed its retest after breaking the lower boundary of this Fib channel. No need to overthink it. As long as Bitcoin stays below 110K, don't look for any “BULL RUN.” And if somehow Bitcoin reaches around 110K, wait for a weekly candle close. That will both confirm and trigger bullish momentum. Don't worry, you won't miss the move — you'll just confirm it. Thanks for reading, Get ready.Let's see if the demand zone will hold or not. Invalidation: Below 88K.
vs_sayin
تحلیل طلای هفتگی: راز صعود قیمت تا ۶۶۰۰ دلار با دو ابزار فیبوناچی!
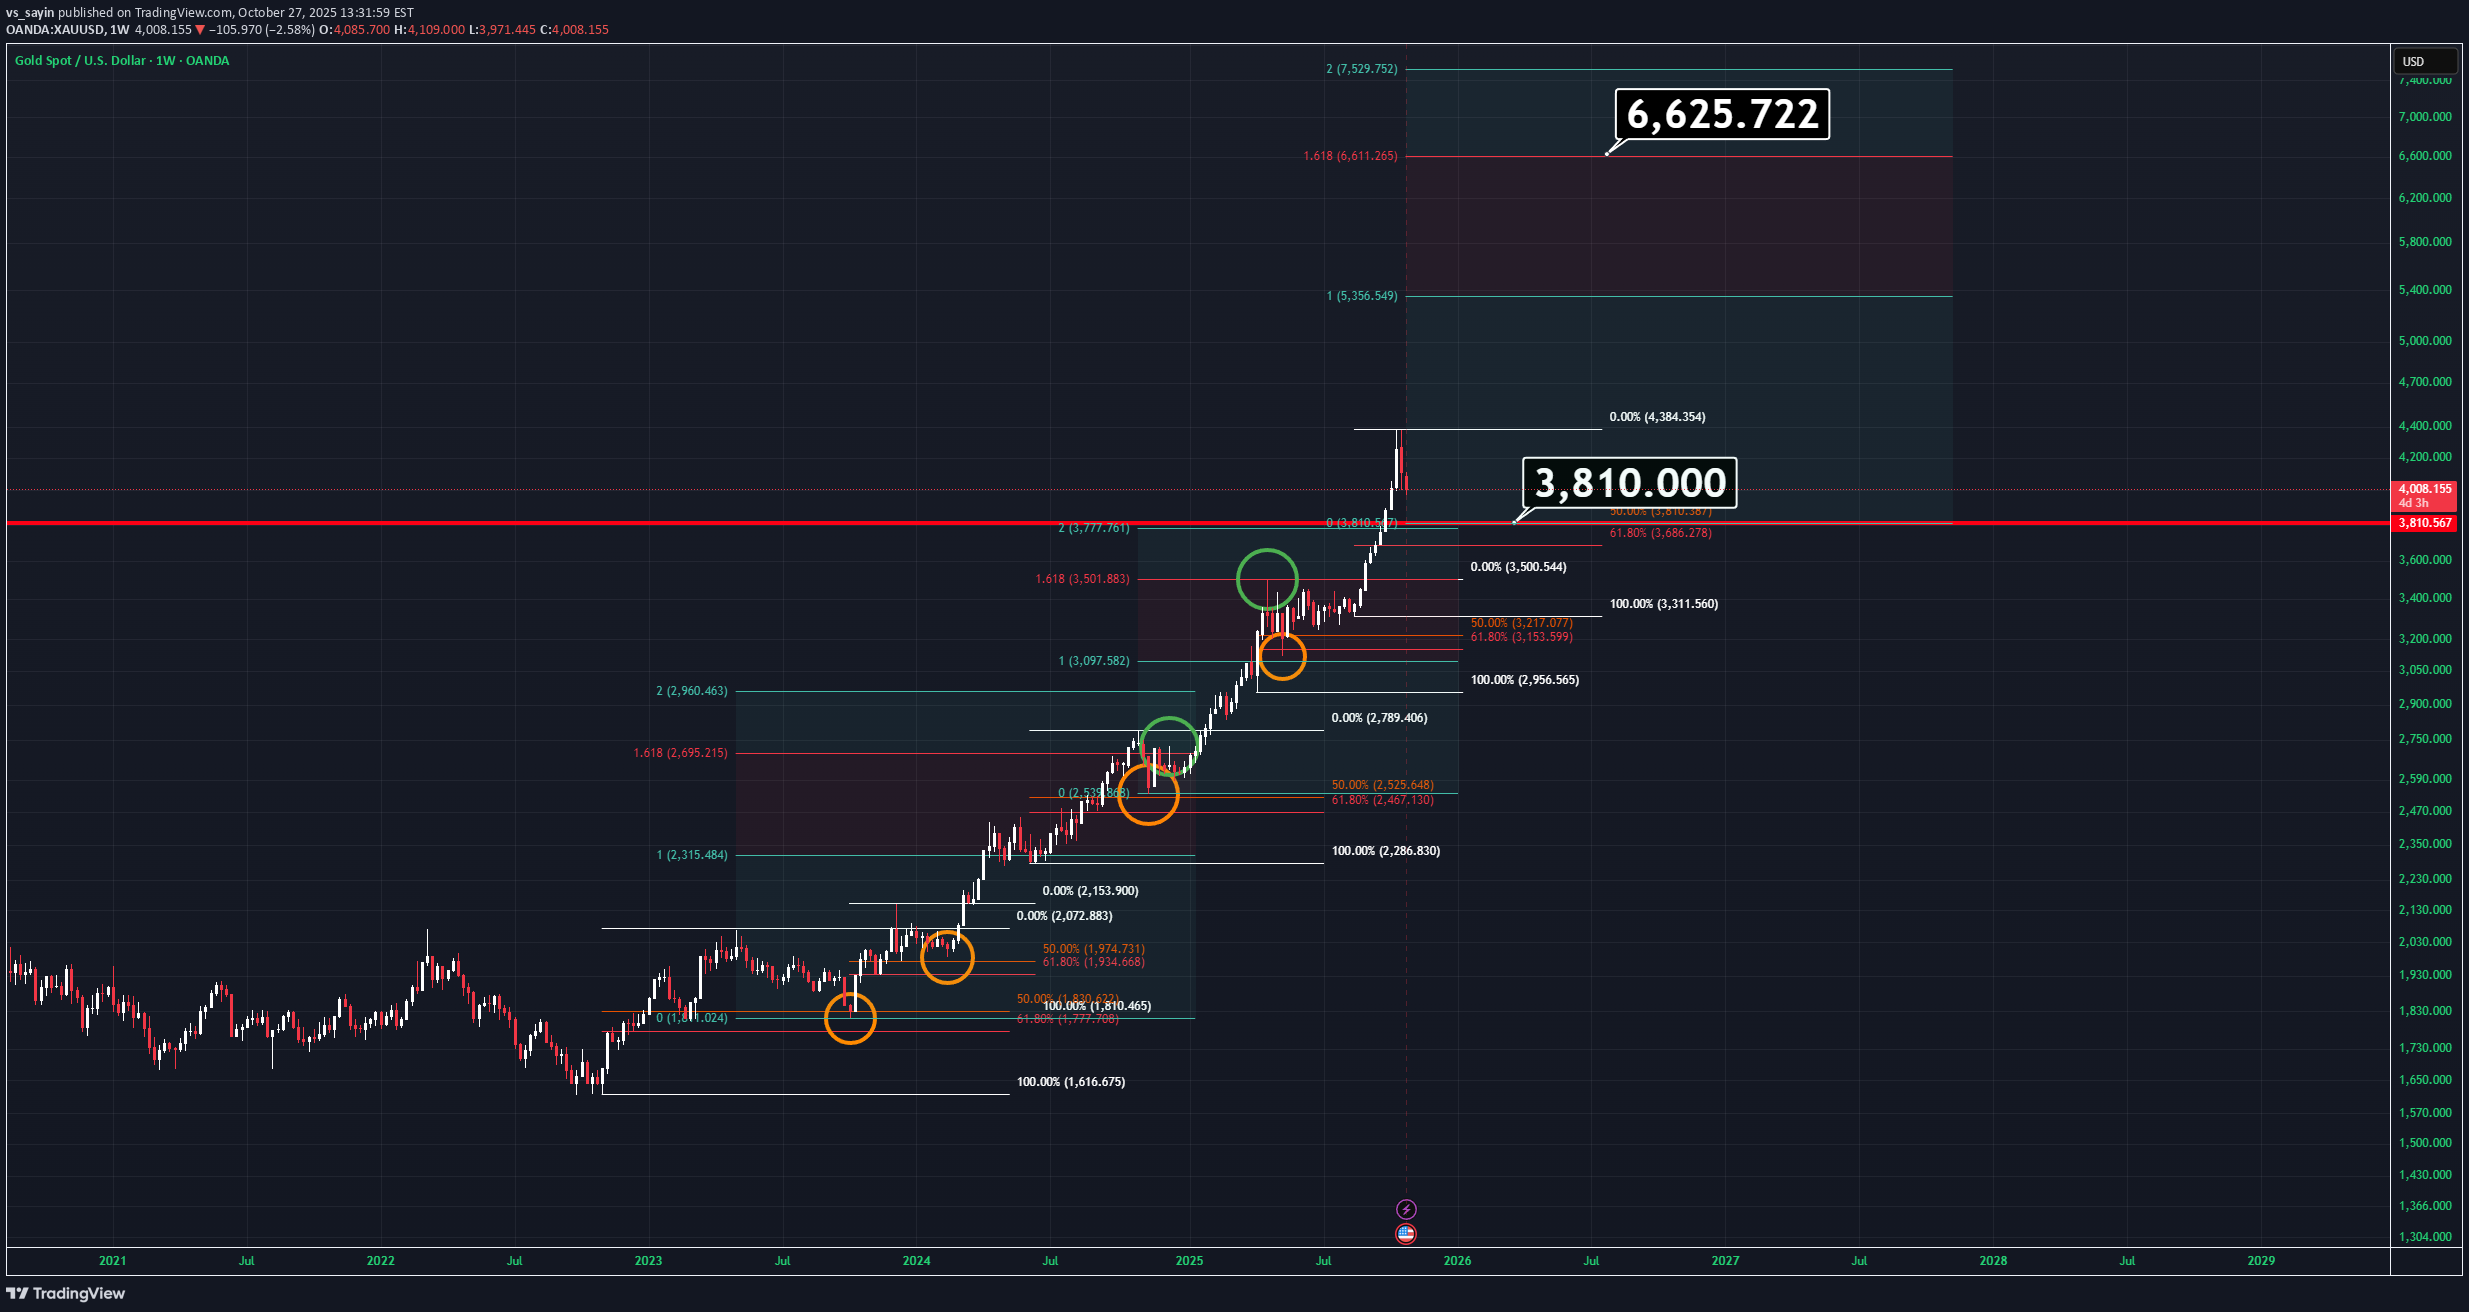
To understand the psychology in Gold, I use only two tools: Fibonacci retracement, Trend-based Fibonacci extension. We will use these two tools to measure the weekly cycles. Since November 2022, Gold has been forming a pattern that can only be explained by Fibonacci principles. Using Fibonacci retracement for each swing high and low, you'll realize that each retracement equals around 50%. In only one example, we see that a higher low reaches the 61.8% level, which is also acceptable. After these retracements, the next leg of the impulsive move always reaches around the 1.618 Fibonacci extension. According to these two basic technical factors, Gold should first reach around $3,800, and then aim for the $6,600 level during the next impulsive leg in the coming years. I’m not even going to list all the reasons why Gold tends to go up over time. Most people reading this analysis are already aware of the fundamentals behind Gold’s long-term bullish nature. Thanks for reading.
vs_sayin
لحظه سرنوشت بیت کوین: خیز برای صعود یا سقوط زیر ۱۰۰ هزار دلار؟ (تحلیل کامل)
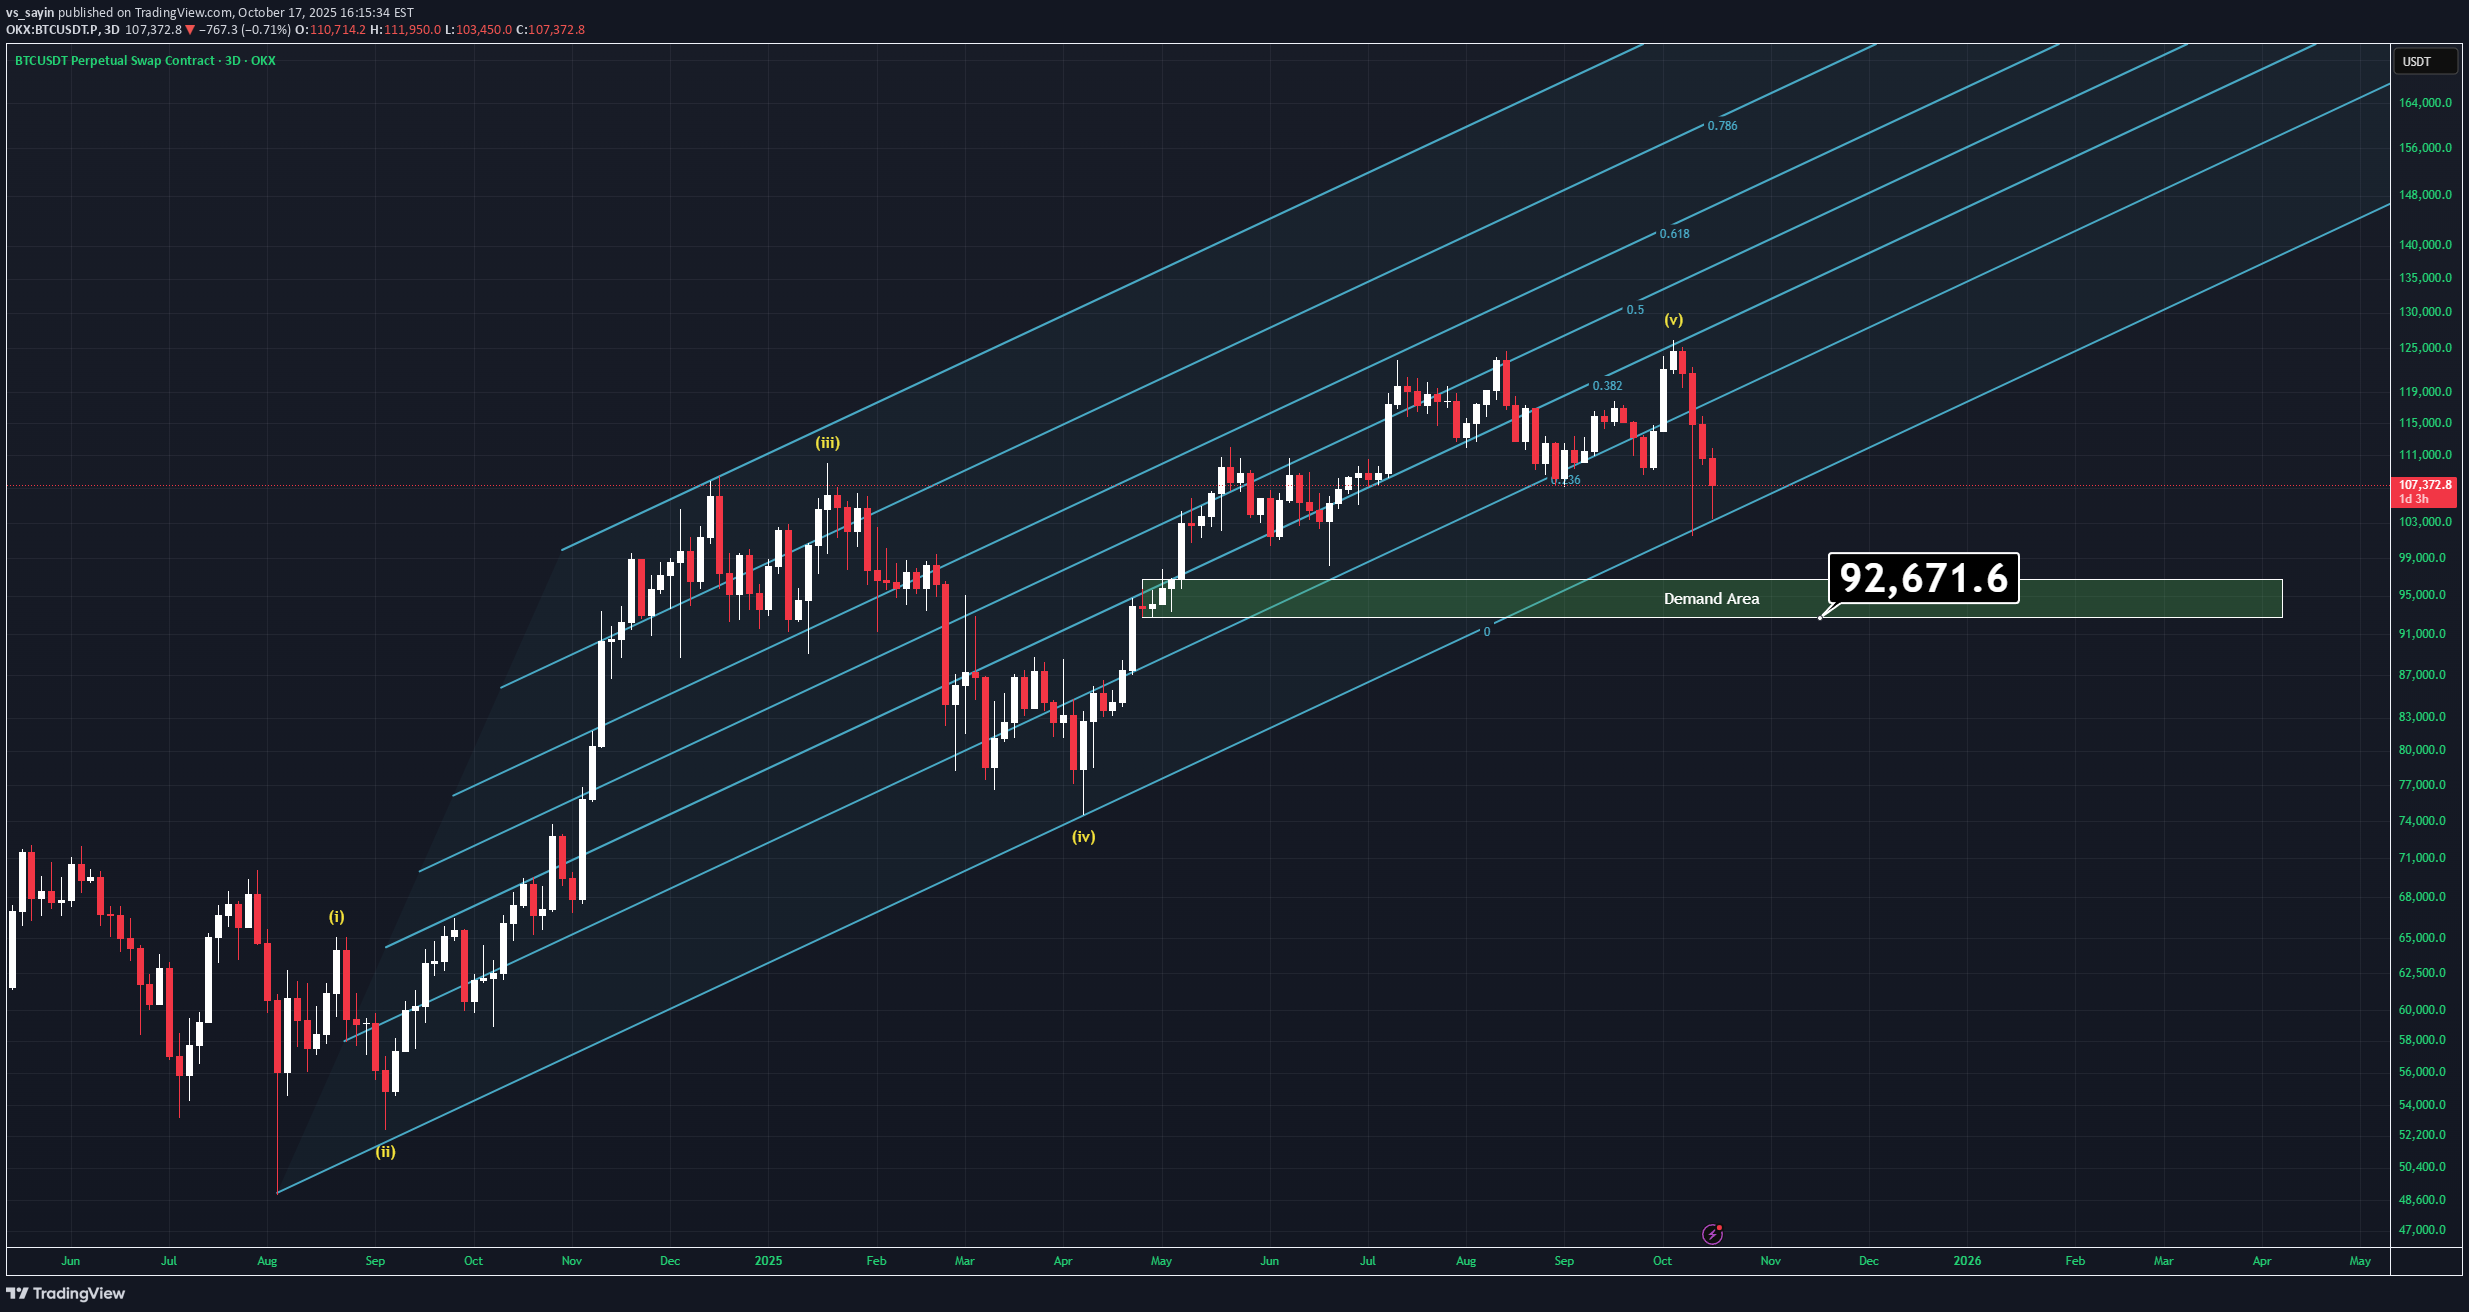
There are many reasons to go up but also going down is starting to look way more charming than ever right now. Let's examine what we have; -FED is about to cut rates for a second time but we'll most likely to see another rate cut in december which is bullish af. -All companies are keeping buying Bitcoin more and more which is kinda good but might be a problem for decentrlation of Bitcoin. -US is more likely to bring more regulations about stablecoins which will effect positivly Bitcoin. On the other hand; -China and US are still faceing a trade war even if they state othervise. -ETF's are not buying Bitcoin as much as they did last year. -US and Venezuela might have a conflit very soon. -Israel-Hamas and Russo-Ukraine wars hasn't actually over yet. -Gold is going on god mode. -DXY is trying to recover in weekly timeframe but is less likely due to rate cuts. -Elliot wave theory tells us that we might actually be in the A-B-C correction cycle. -Volume is decreasing, which is bad and supports the Elliot waves. - Trendline support is about to be lost (Tried to break it twice in a week). -There is a CME gap left around $92K Well, all we have to do is, combining the factors. If BTC breaks below the supportive trendline we will most likely drop through demand zone which is highlited in the chart. If US and China makes peace (less likely), Bitcoin actually has real reasons to try a new all time high. The main point is simple: Wait for one of two things to happen: Either the trendline will be broken and we'll see below the $100K, which will give us new opportuinites. Or, Bitcoin recovers $118400 and the entire bearish senario would be invalidated and Bitcoin goes like crayz again. Thank you for reading.Perfectly Bounced from the dip of the channel. In the coming days, market will face both with the FED and BOJ in a row. Be careful.
vs_sayin
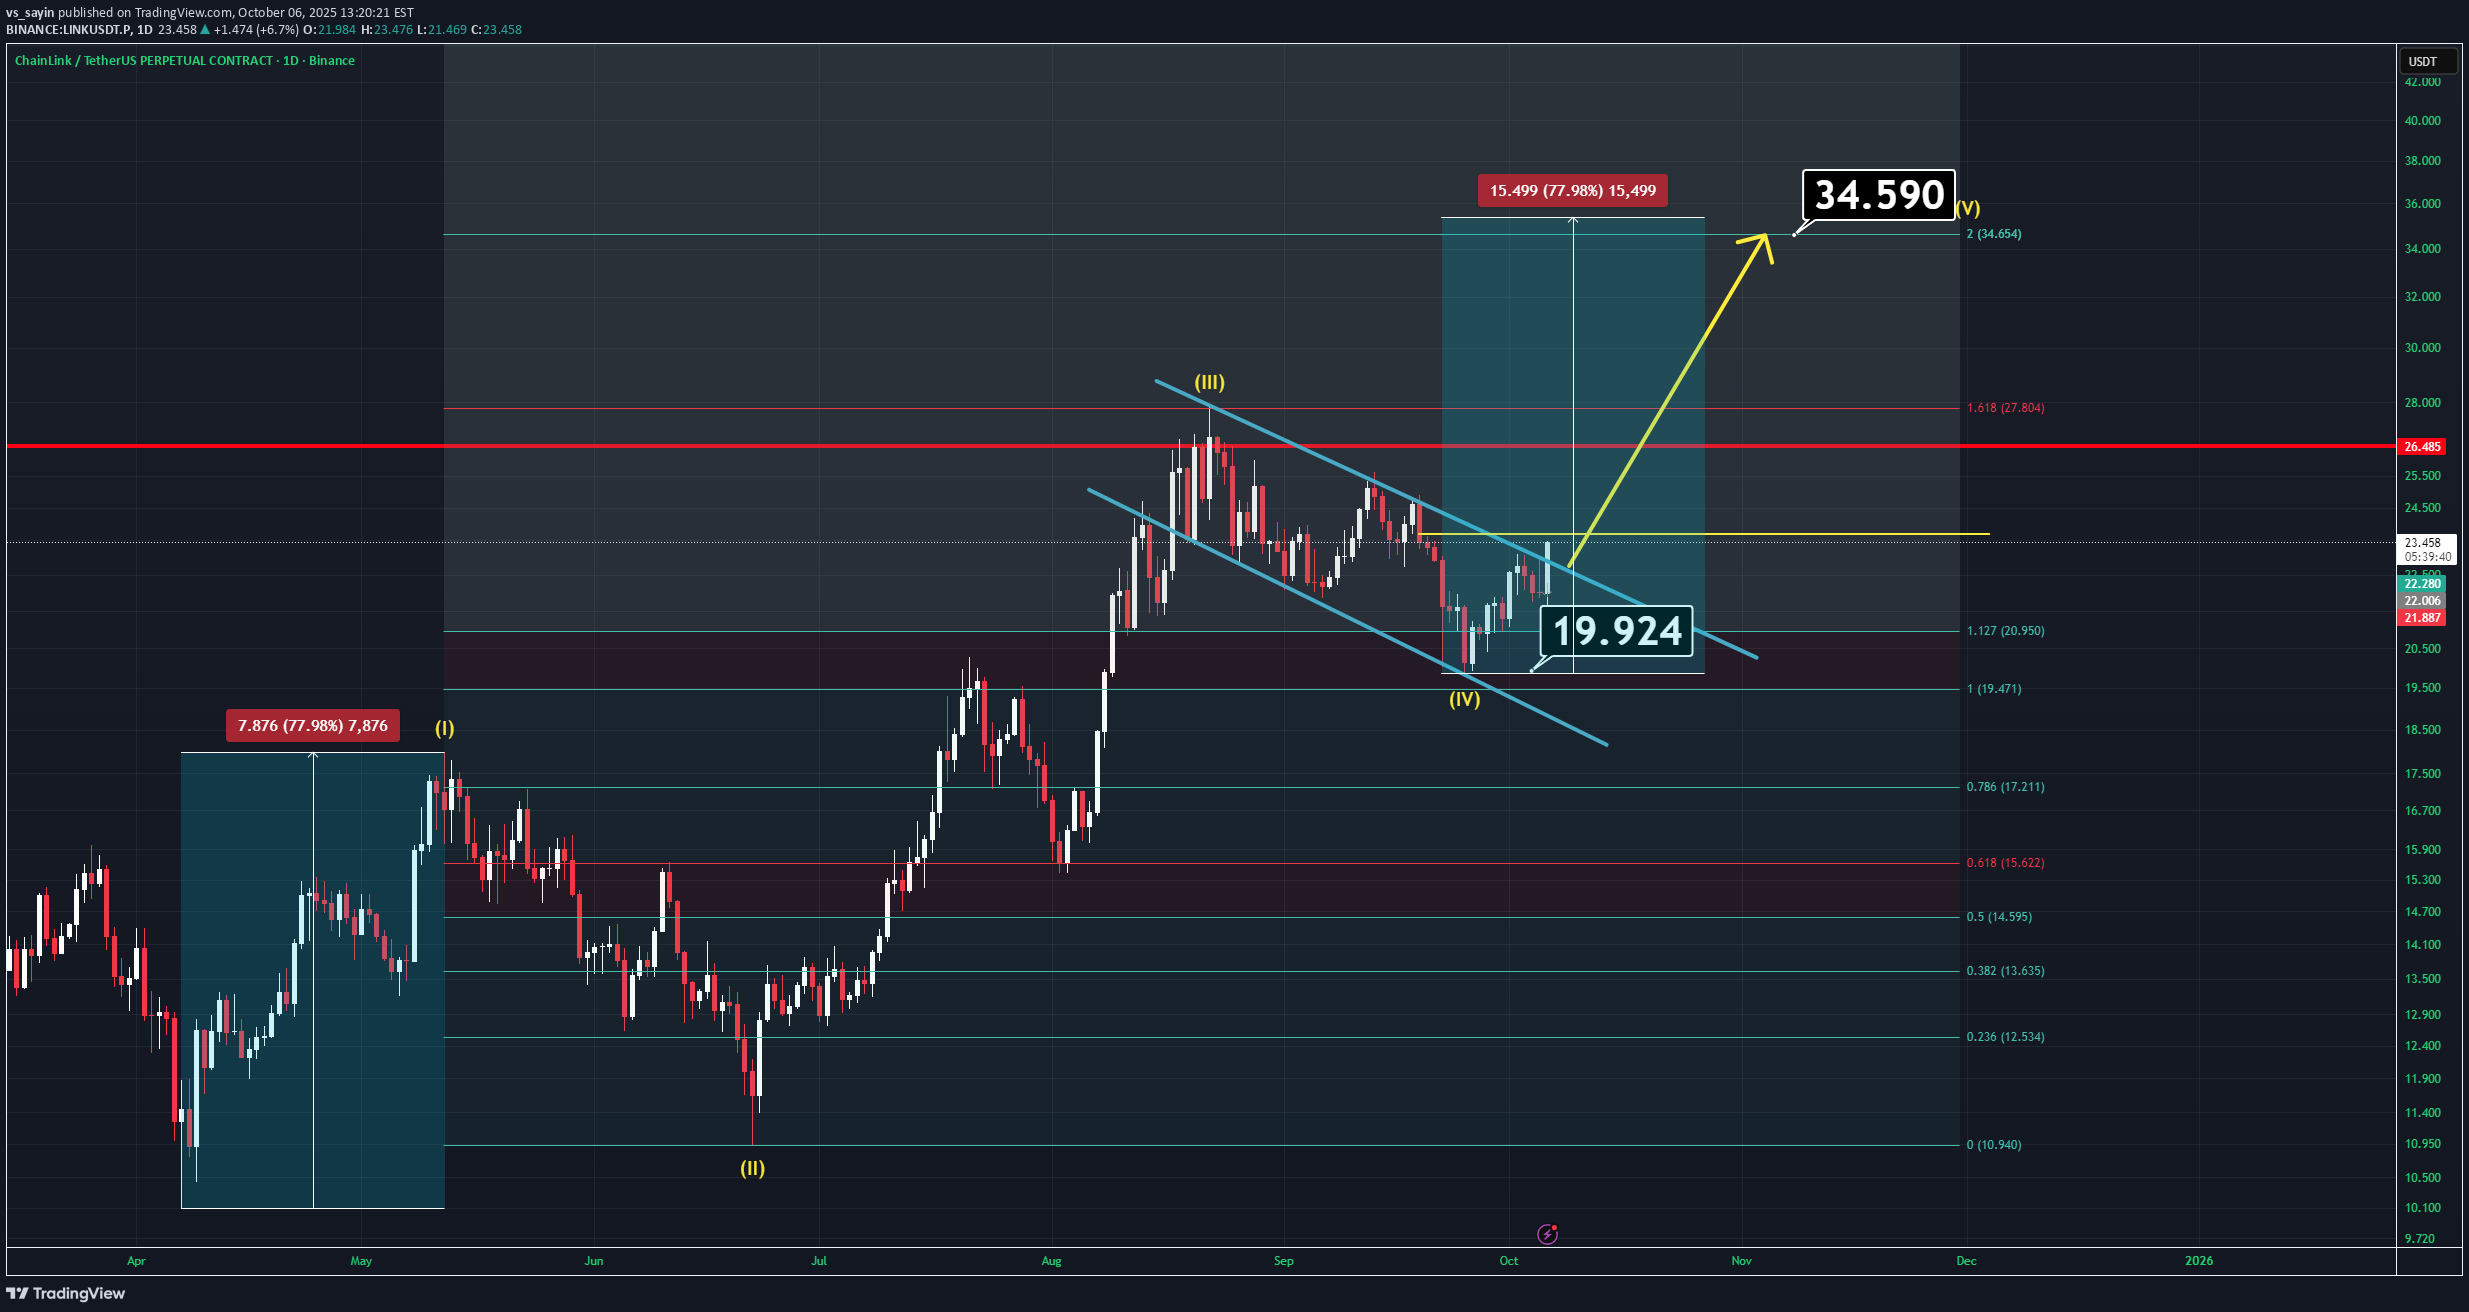
لینک در آستانه جهش بزرگ؟ پایان انباشت و شروع موج پنجم (تحلیل قیمت ۳۴ دلاری)
vs_sayin
سولانا در نقطه حساس: آیا ریزش سنگین در راه است یا صعود به ۲۷۰؟
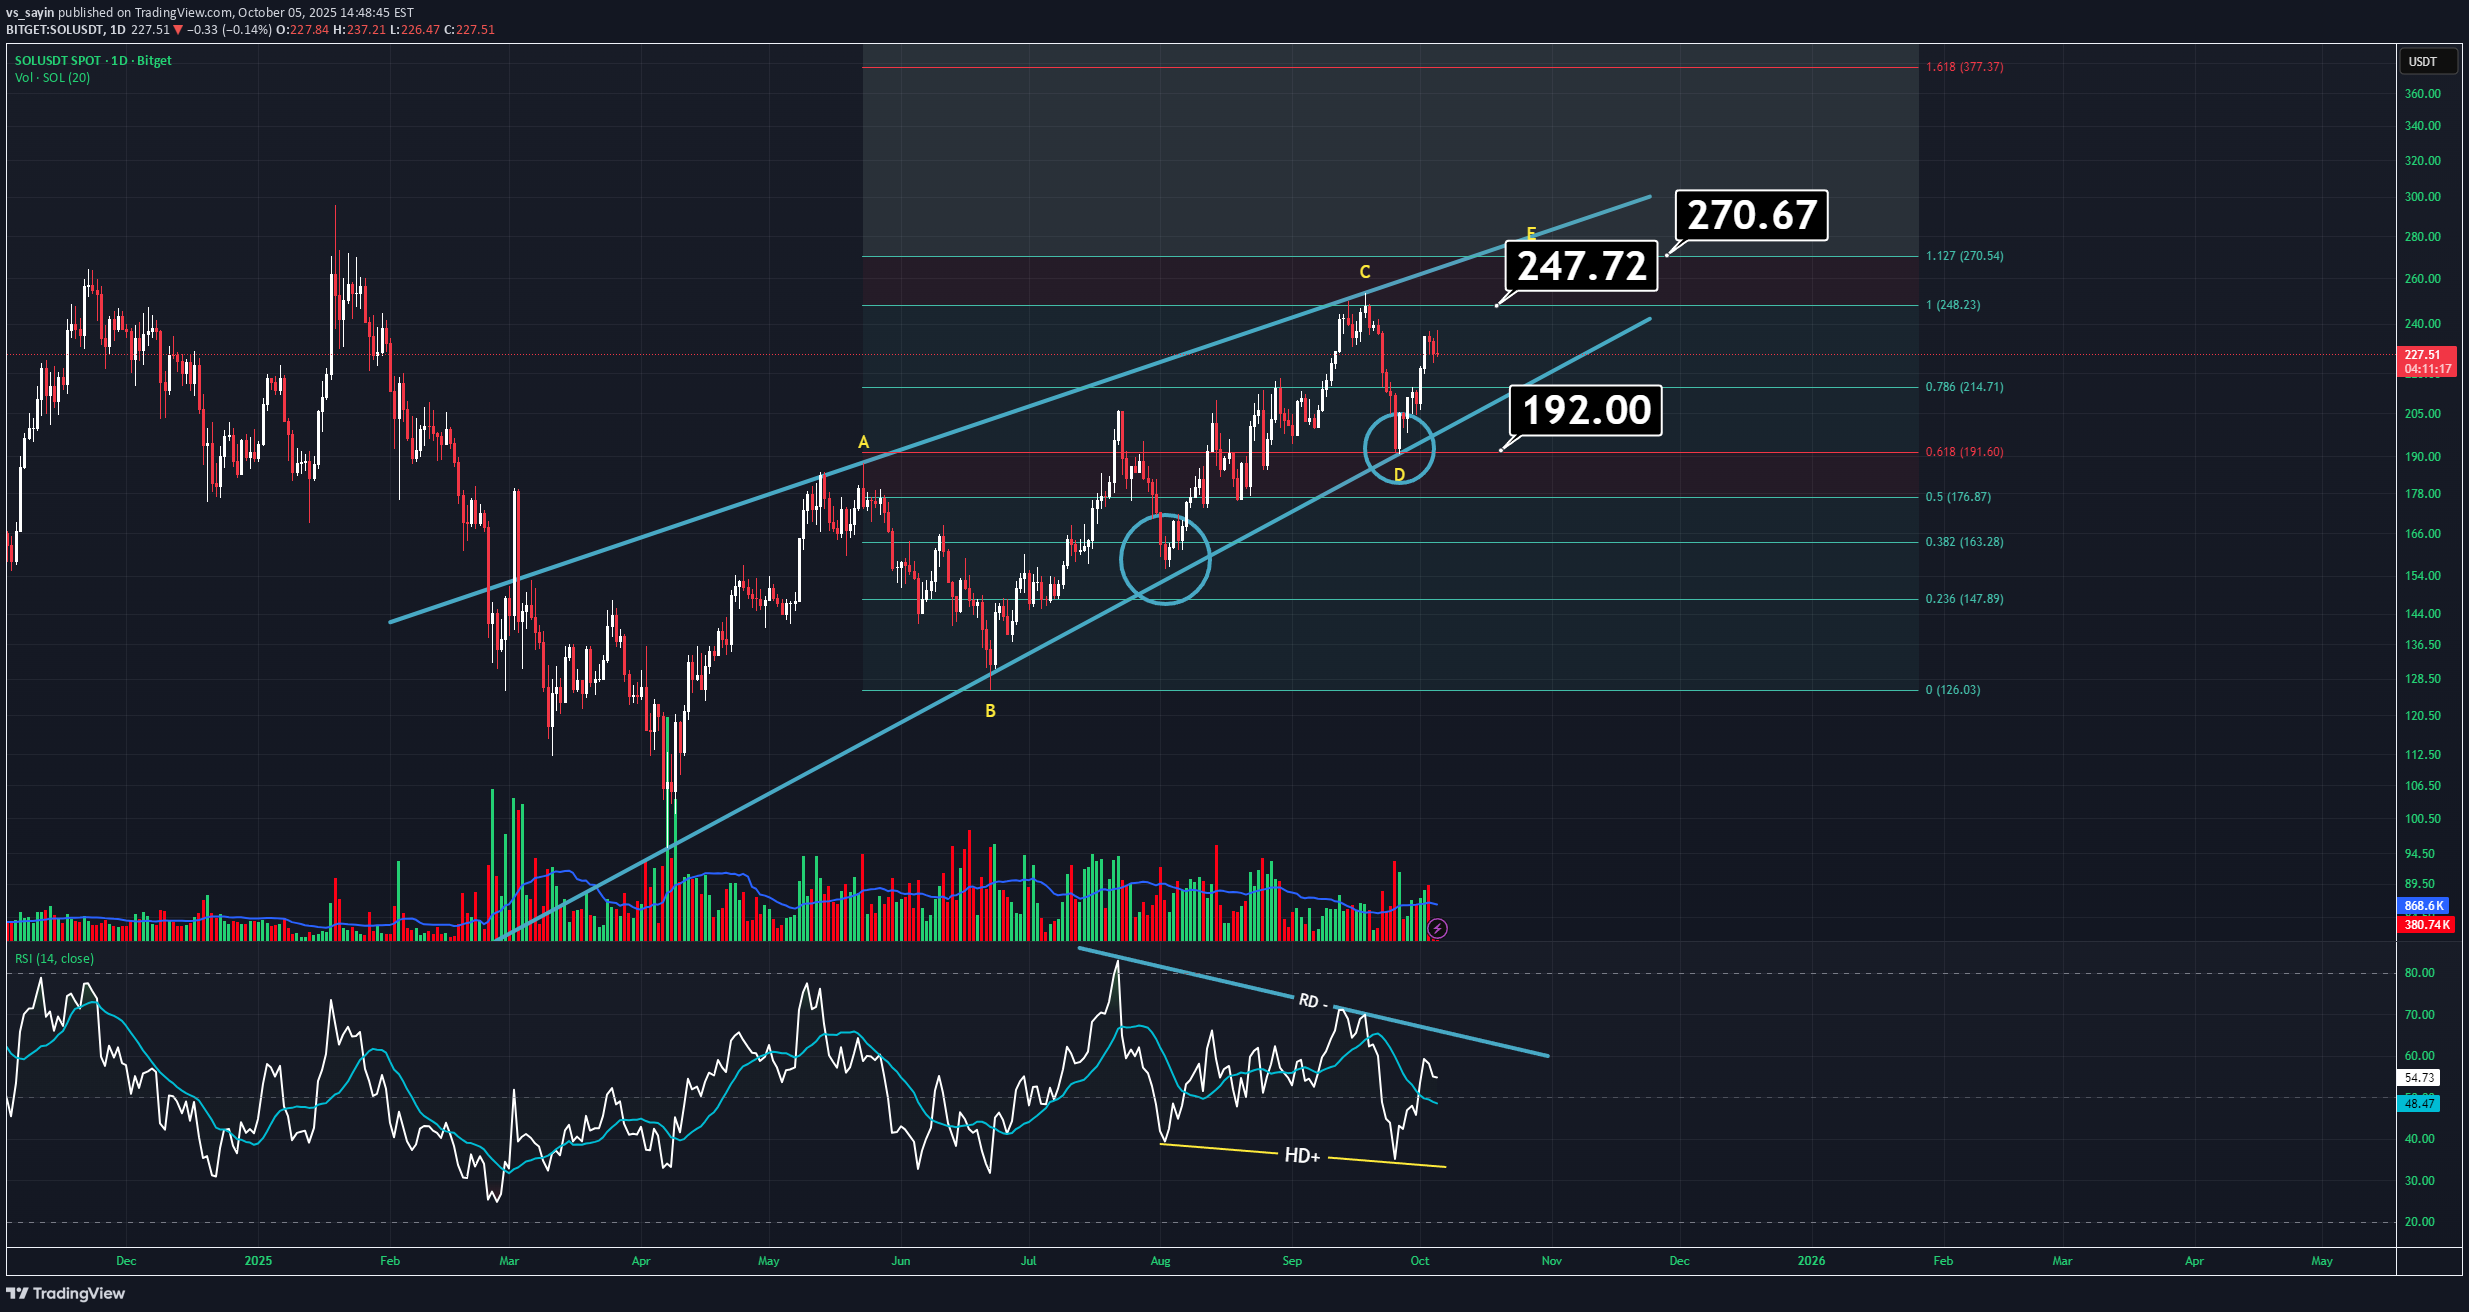
SOL is currently at a decision point, mainly due to both the ongoing recession and the delayed ETF approvals. On the daily chart, it’s getting squeezed inside a large wedge pattern. Normally, it should make one more top before breaking down. However, just to be clear — if price drops below 192, there’s a strong possibility of a sharp sell-off. That’s where both the character shift and wedge breakdown would occur. Some additional details: Volume is flat and indecisive. It’s moving in line with the wedge, which isn’t a great sign. Typically, this kind of volume behavior is seen during wedge formations. The RSI looks unusual — there are both negative and hidden bullish divergences. If you’re wondering which one matters more, it’s the hidden bullish divergence — it’s the stronger signal here. If the recent high is broken, we could see SOL climbing towards the 270 region, after which we’ll know whether the wedge remains valid. However, in general, the outlook doesn’t look too strong at the moment.
vs_sayin
UNI UPDATE (4H)
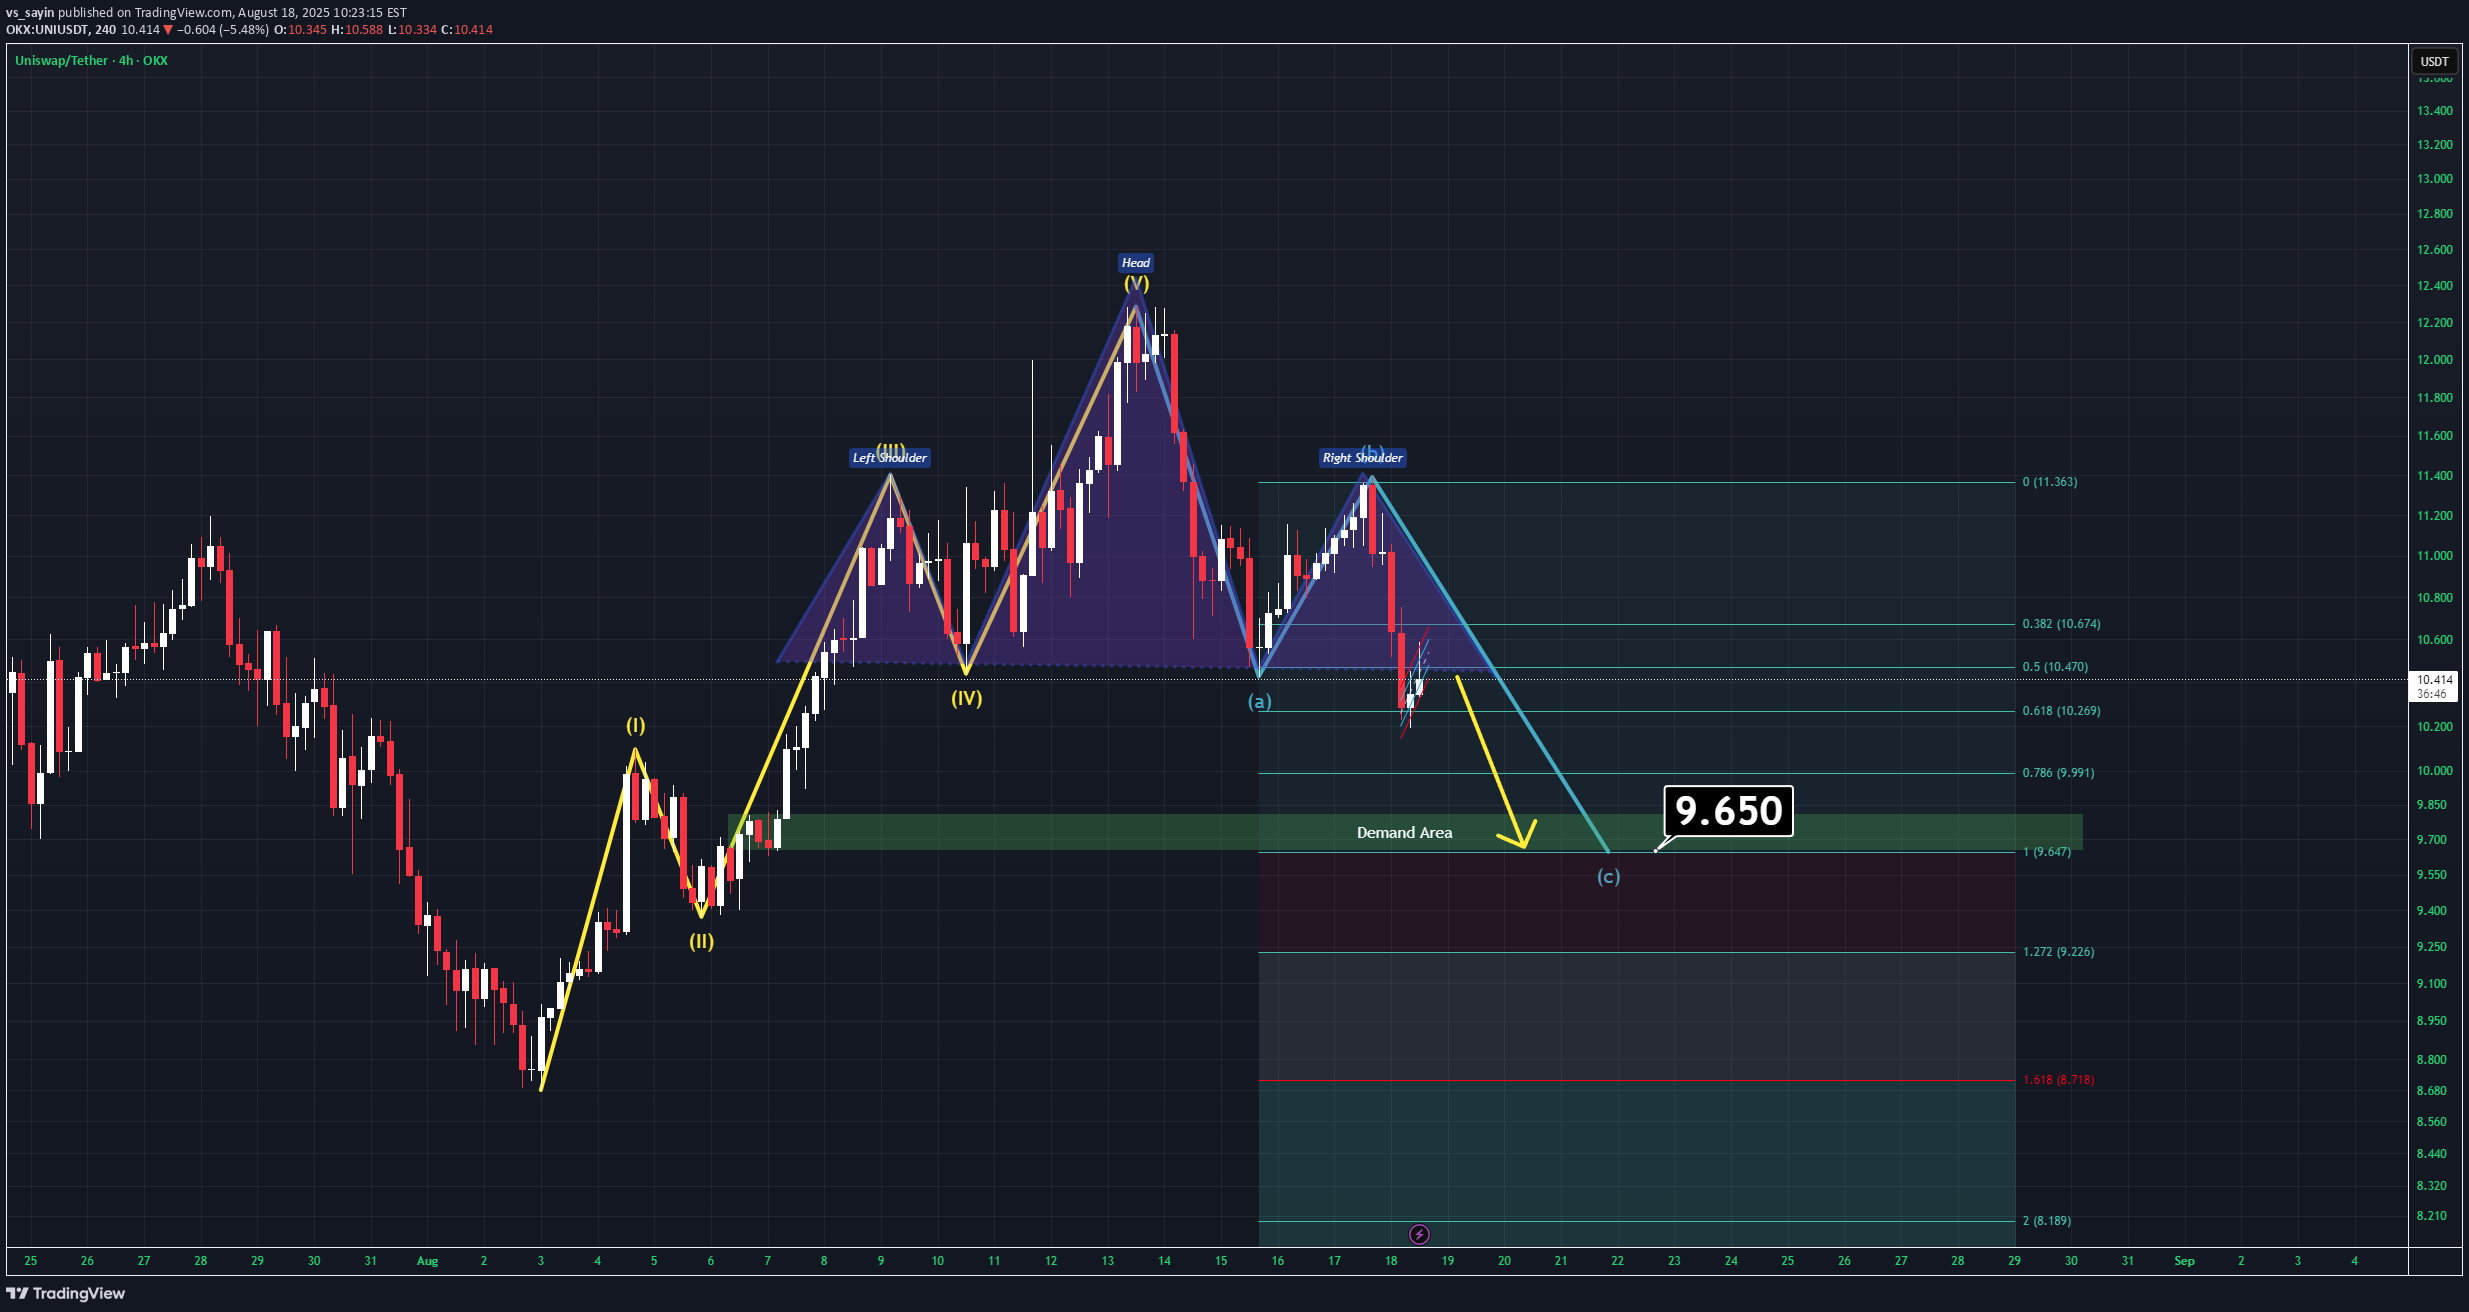
After completing a five-wave impulsive move to the upside, UNI now appears to have entered a corrective A–B–C pattern. Additionally, a head and shoulders formation has already broken down and been retested, further confirming bearish momentum. All signals currently point toward a downward continuation. On the 15-minute timeframe, a mini bear flag has also formed, which strengthens this bearish outlook. Good Luck.Breakeven activated before main TP.
vs_sayin
FIL ANALYSIS (8H)
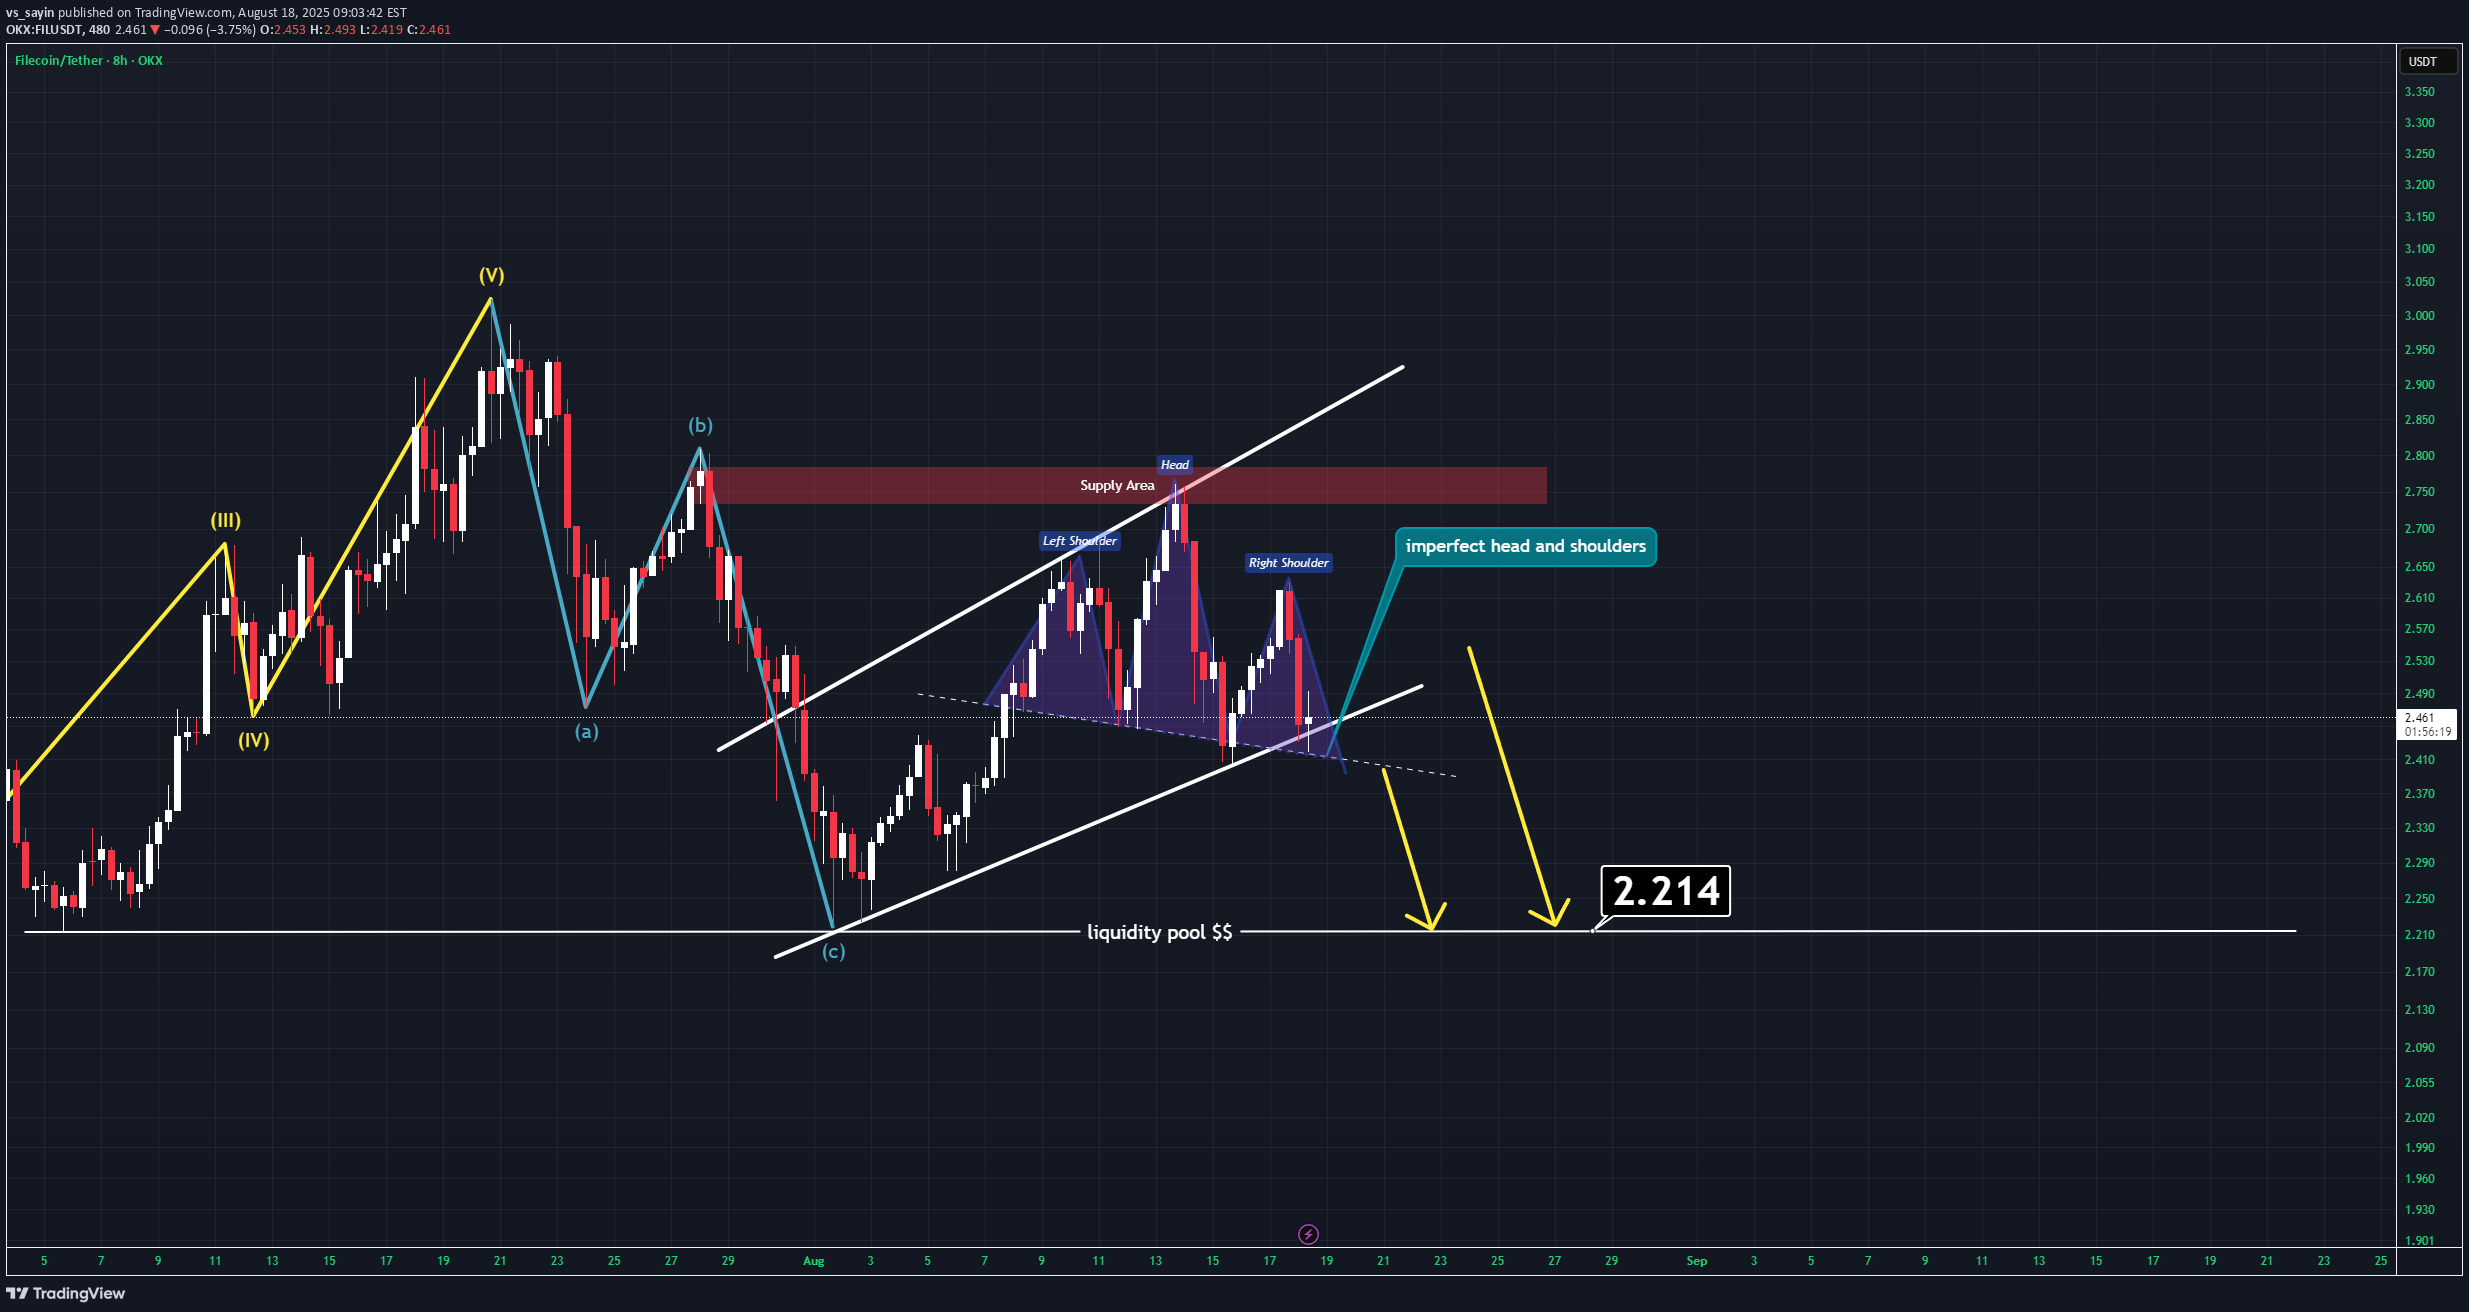
After hitting a major supply line, FIL has entered a corrective wave. Similar to the other setups I shared earlier today, this one is showing very comparable price action. Currently, FIL is trading below all key moving averages (such as the 200 SMA and 50 EMA). On top of that, an imperfect head and shoulders formation is in play. With the recent breakout, it seems likely that FIL will attempt to grab the lower liquidity pool, which sits around $2.2. Thanks for reading.
vs_sayin
AAVE ANALYSIS (4H)
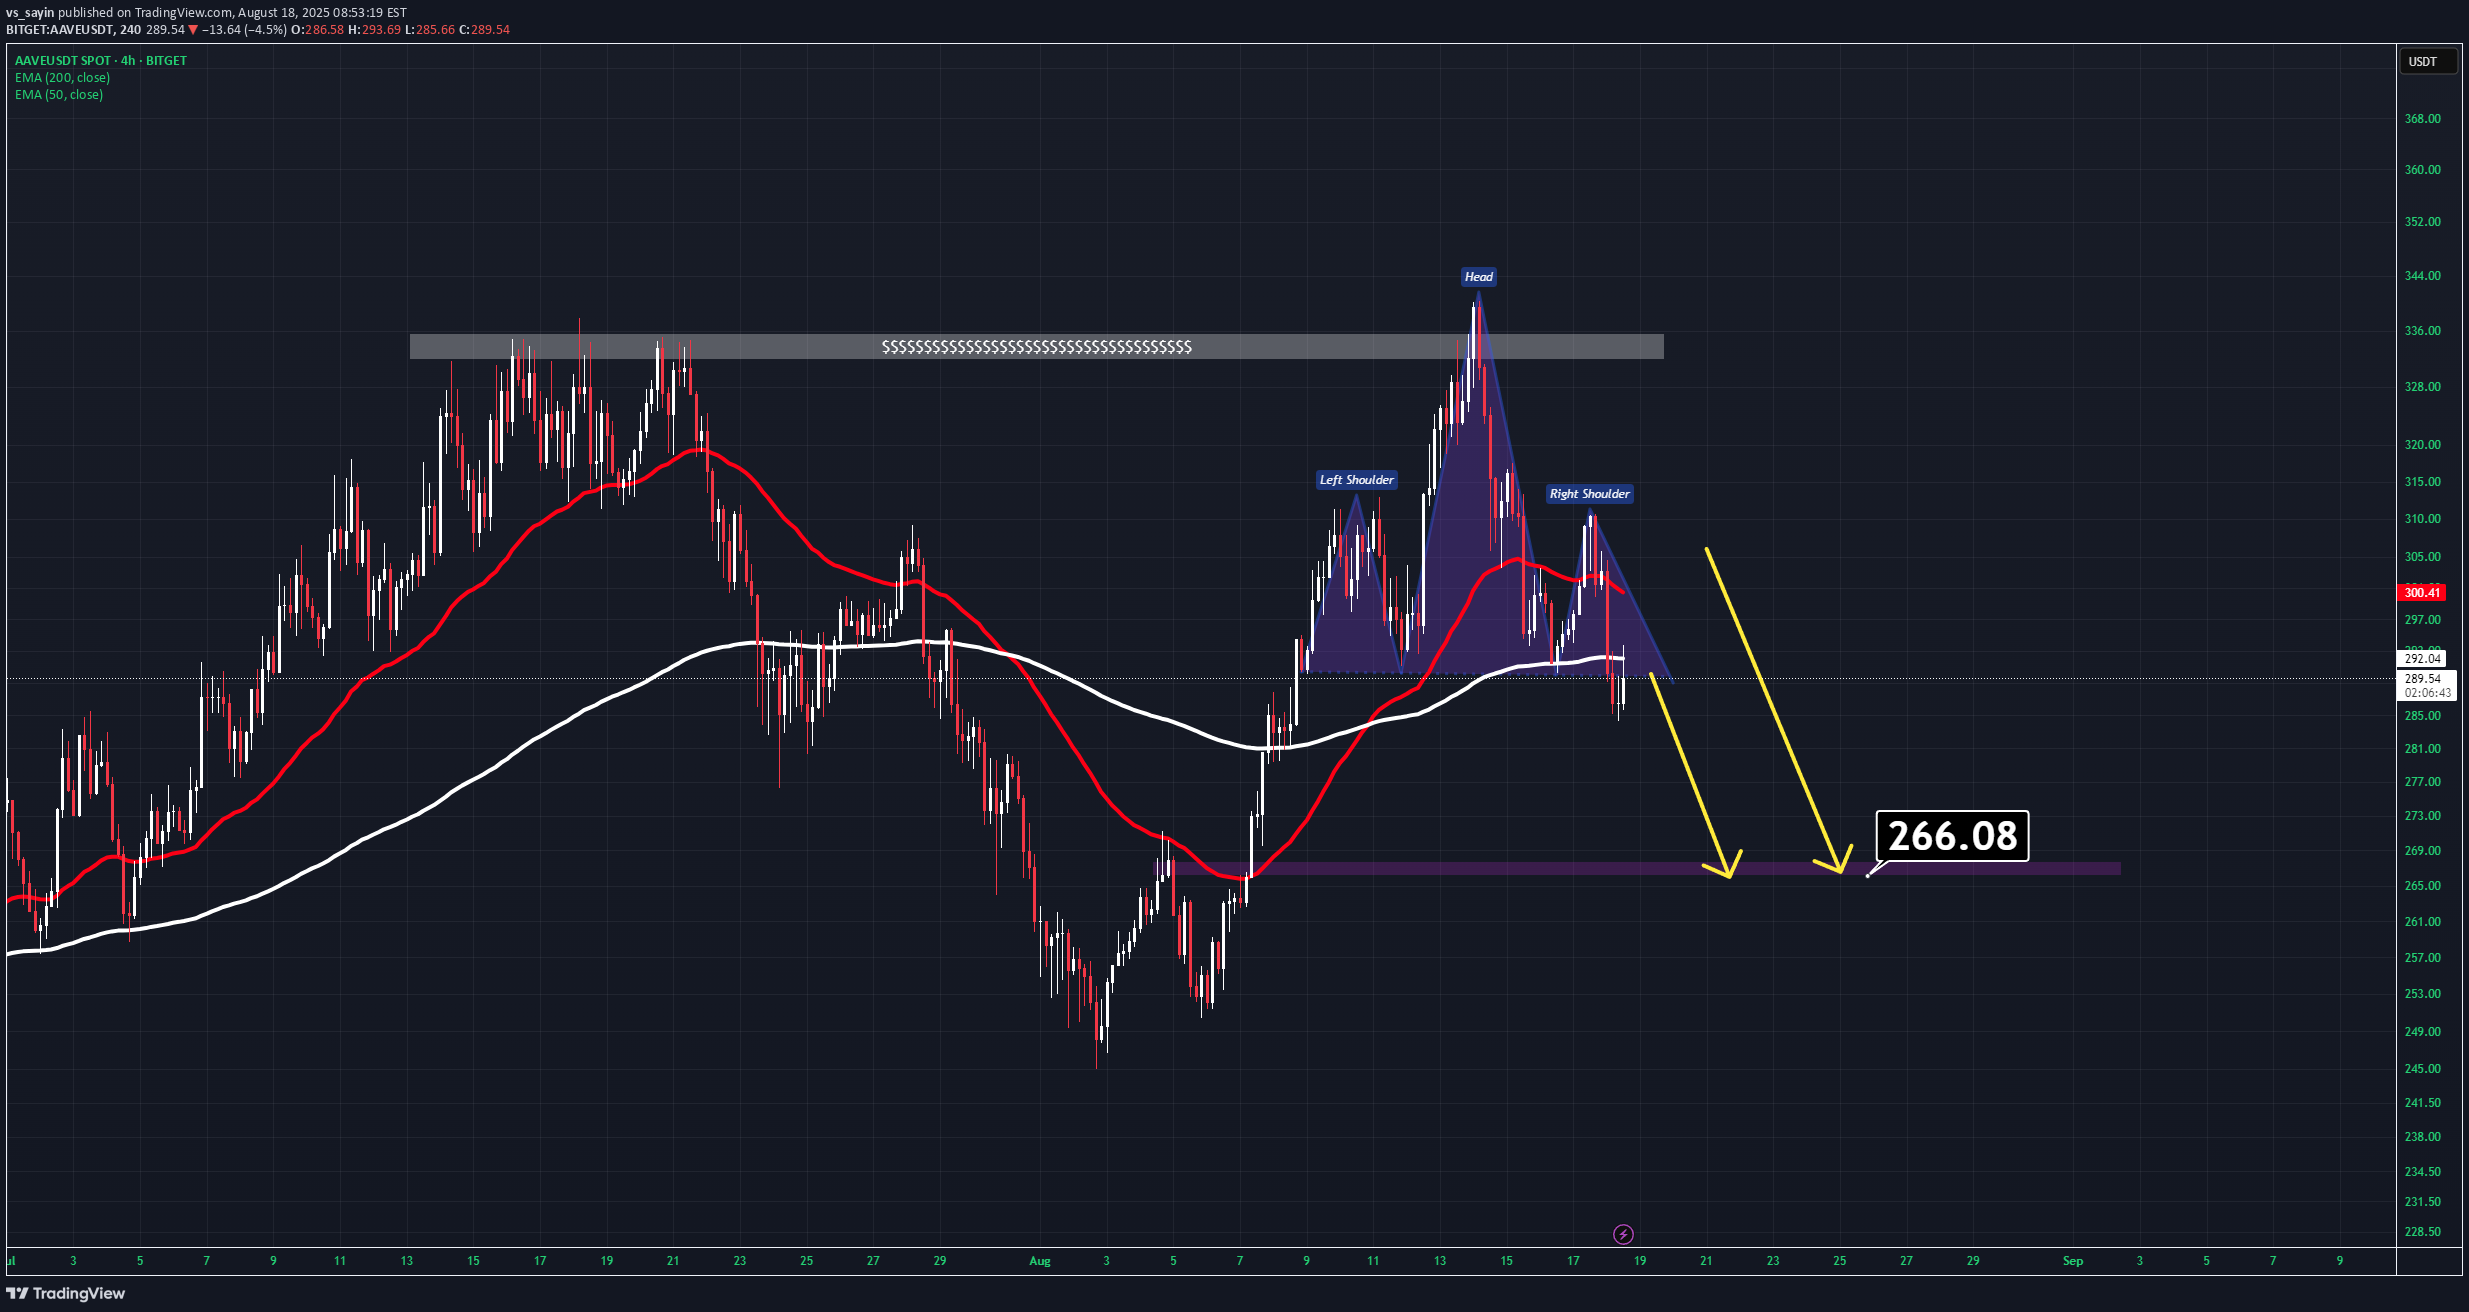
After grabbing the upper liquidity pool, AAVE has shifted into a bearish structure. Currently, the price is trading below both the 50 EMA and the 200 EMA. Additionally, we can clearly identify a textbook Head & Shoulders pattern on the chart. With these confirmations, AAVE remains bearish, and the downside target should be around $270 – $266. Thanks for reading.Take half profit and move your stoploss to breakeven.I made a warning signal in notes 3 days ago to take profit and move stoploss to breakeven. So it's a win.
vs_sayin
SEI ANALYSIS (1D)

SEI is currently moving into a channel which is providing a very specific outlook. At the moment, it is hard to determine if the outlook is bullish or bearish in the mid term. If we ignore BTC and the possible altcoin bull run to cut out the noise, I believe this asset is either getting ready to pump 10x or is on a one-way ticket to hell. The orange arrow on the chart represents the most likely path for this asset for now. Thanks for reading.
Disclaimer
Any content and materials included in Sahmeto's website and official communication channels are a compilation of personal opinions and analyses and are not binding. They do not constitute any recommendation for buying, selling, entering or exiting the stock market and cryptocurrency market. Also, all news and analyses included in the website and channels are merely republished information from official and unofficial domestic and foreign sources, and it is obvious that users of the said content are responsible for following up and ensuring the authenticity and accuracy of the materials. Therefore, while disclaiming responsibility, it is declared that the responsibility for any decision-making, action, and potential profit and loss in the capital market and cryptocurrency market lies with the trader.