
suleymankumyol
@t_suleymankumyol

What symbols does the trader recommend buying?
Purchase History
پیام های تریدر
Filter
suleymankumyol
ETHEREUM
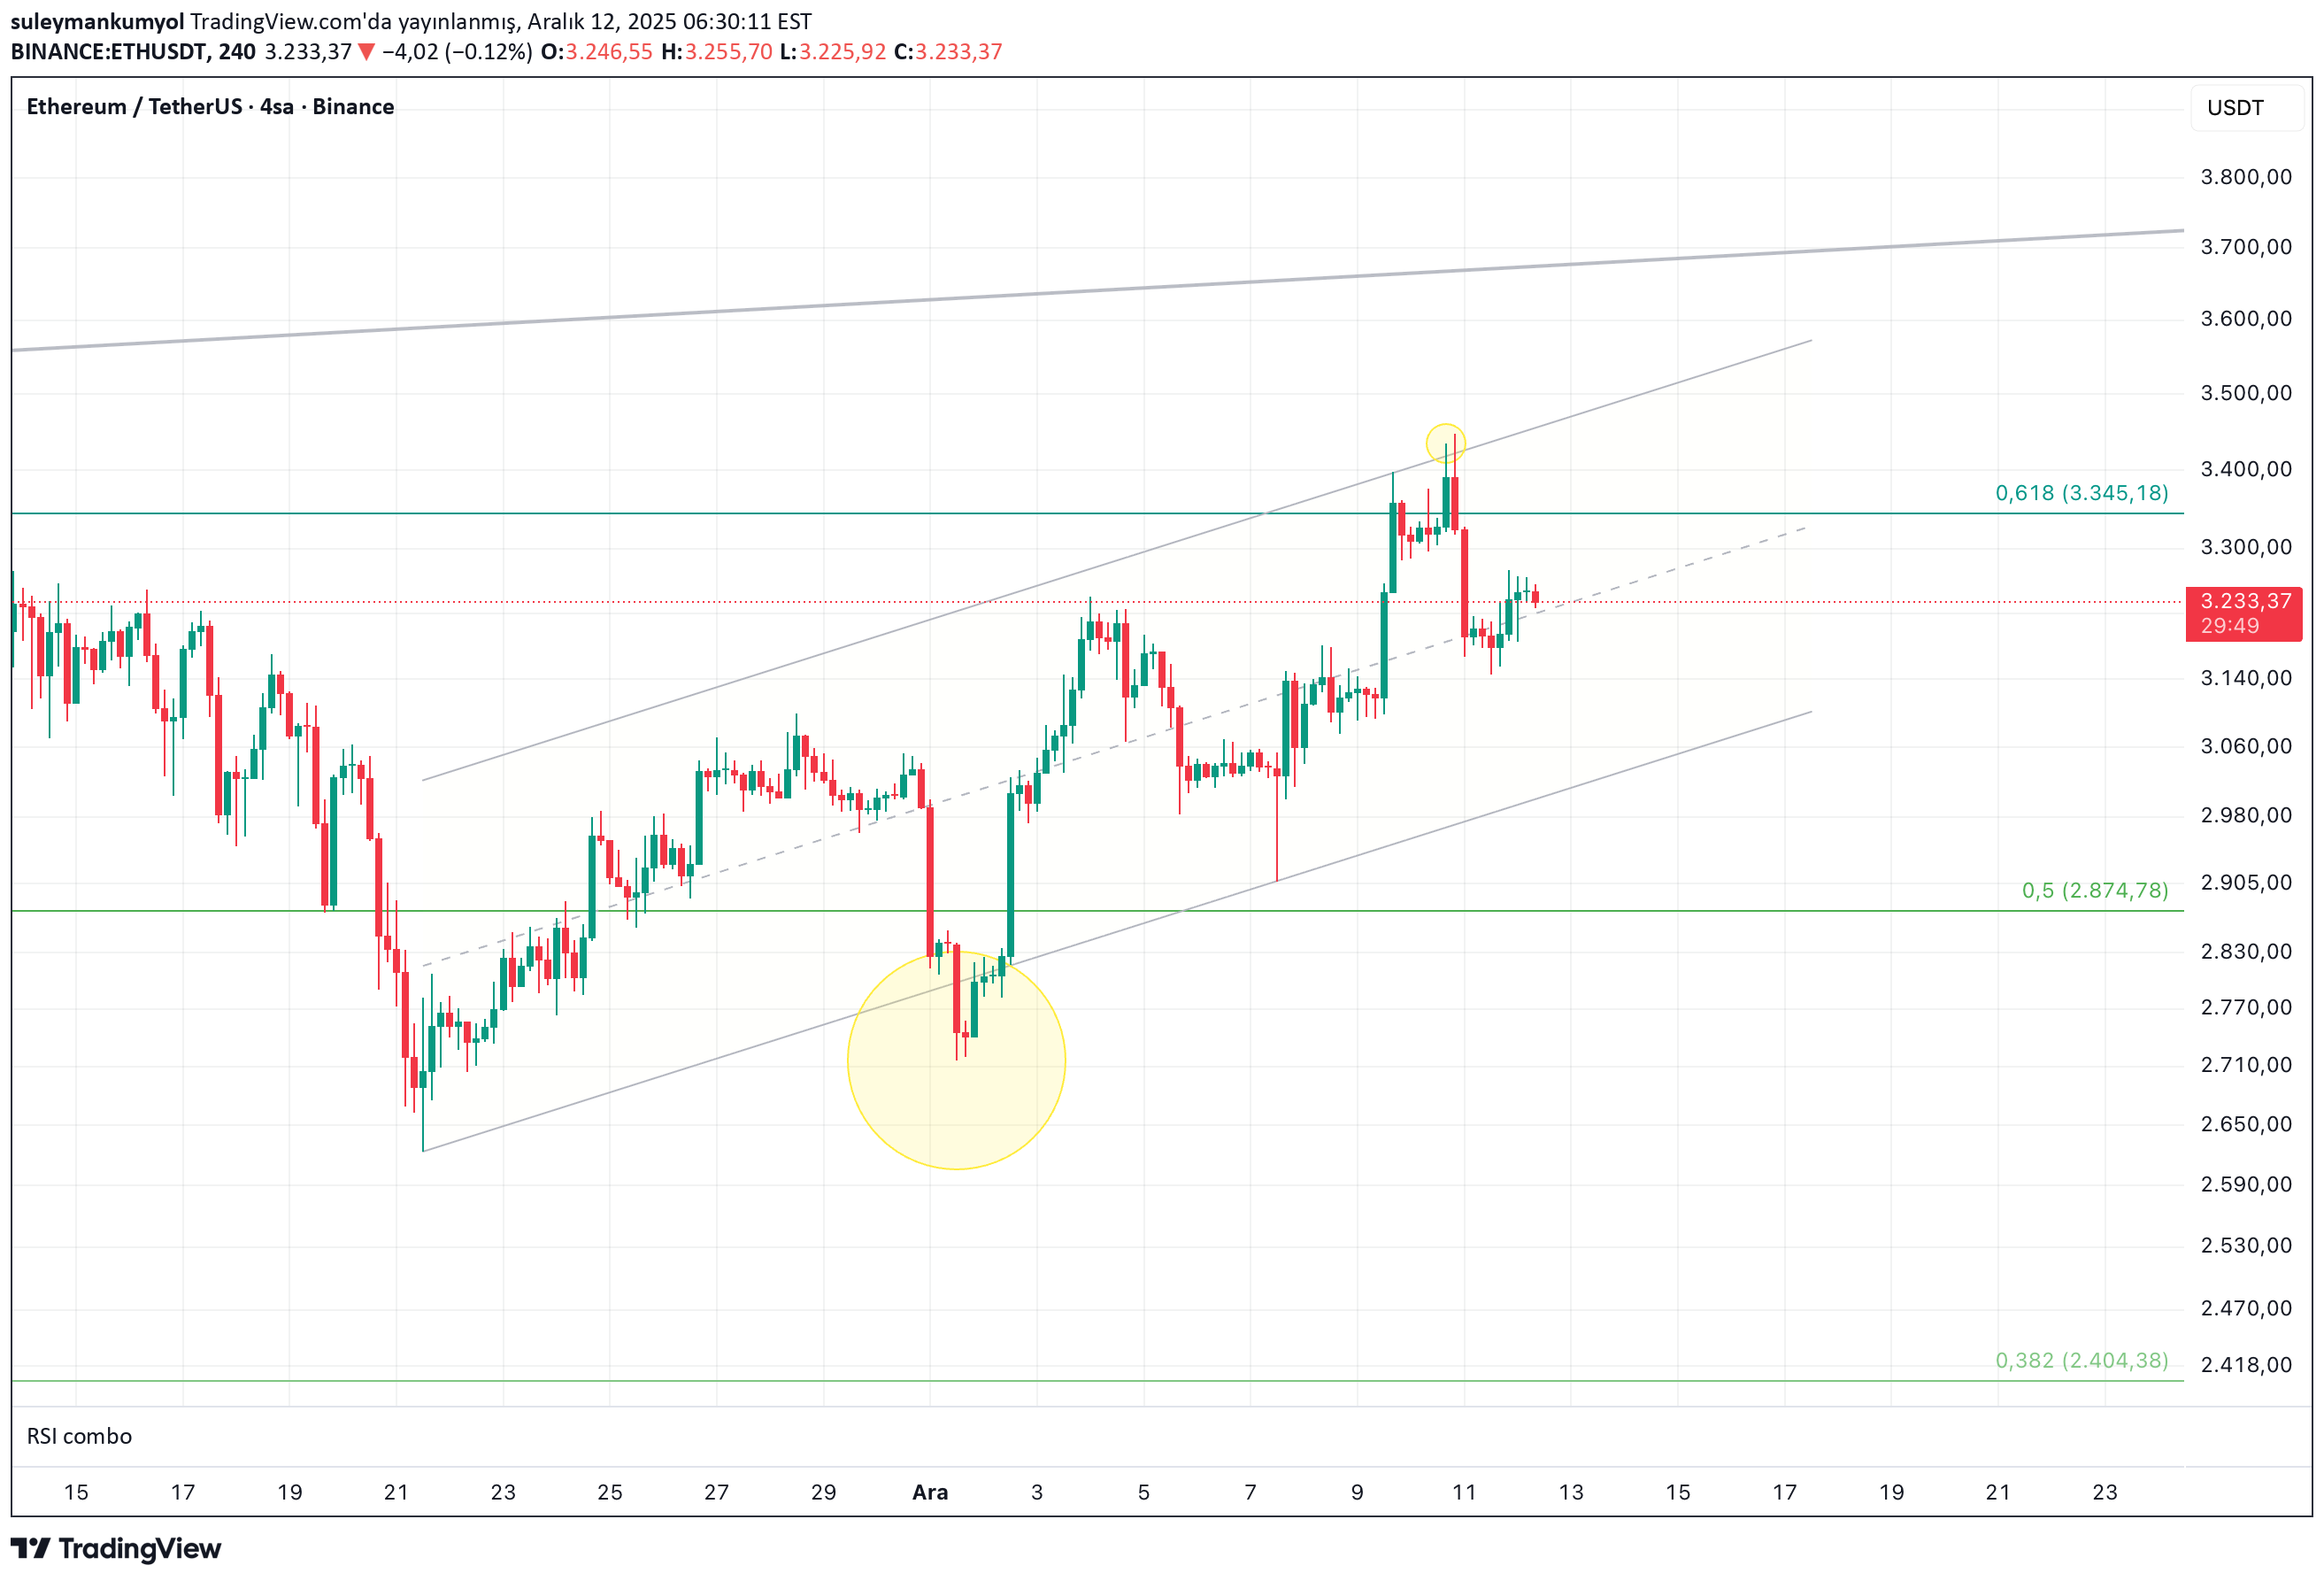
ETHUSDT Chart Commentary It is possible to say that ETH is oscillating within a channel on the short-term chart. We may encounter positive pricing when it is above the middle line of the channel, and unfortunately negative pricing when it is below it. The levels to pay attention to are as follows: We should not go below $ 3060. Above this level is positive. $3304 appears as a resistance line. The $3210 band, that is, the channel middle line, will act as support. If there is any unusual movement, I try to interpret it. I wish everyone good luck. It is not investment advice.
suleymankumyol
تحلیل تکنیکال بیت کوین (BTCUSDT): آیا موج صعودی جدید در راه است؟
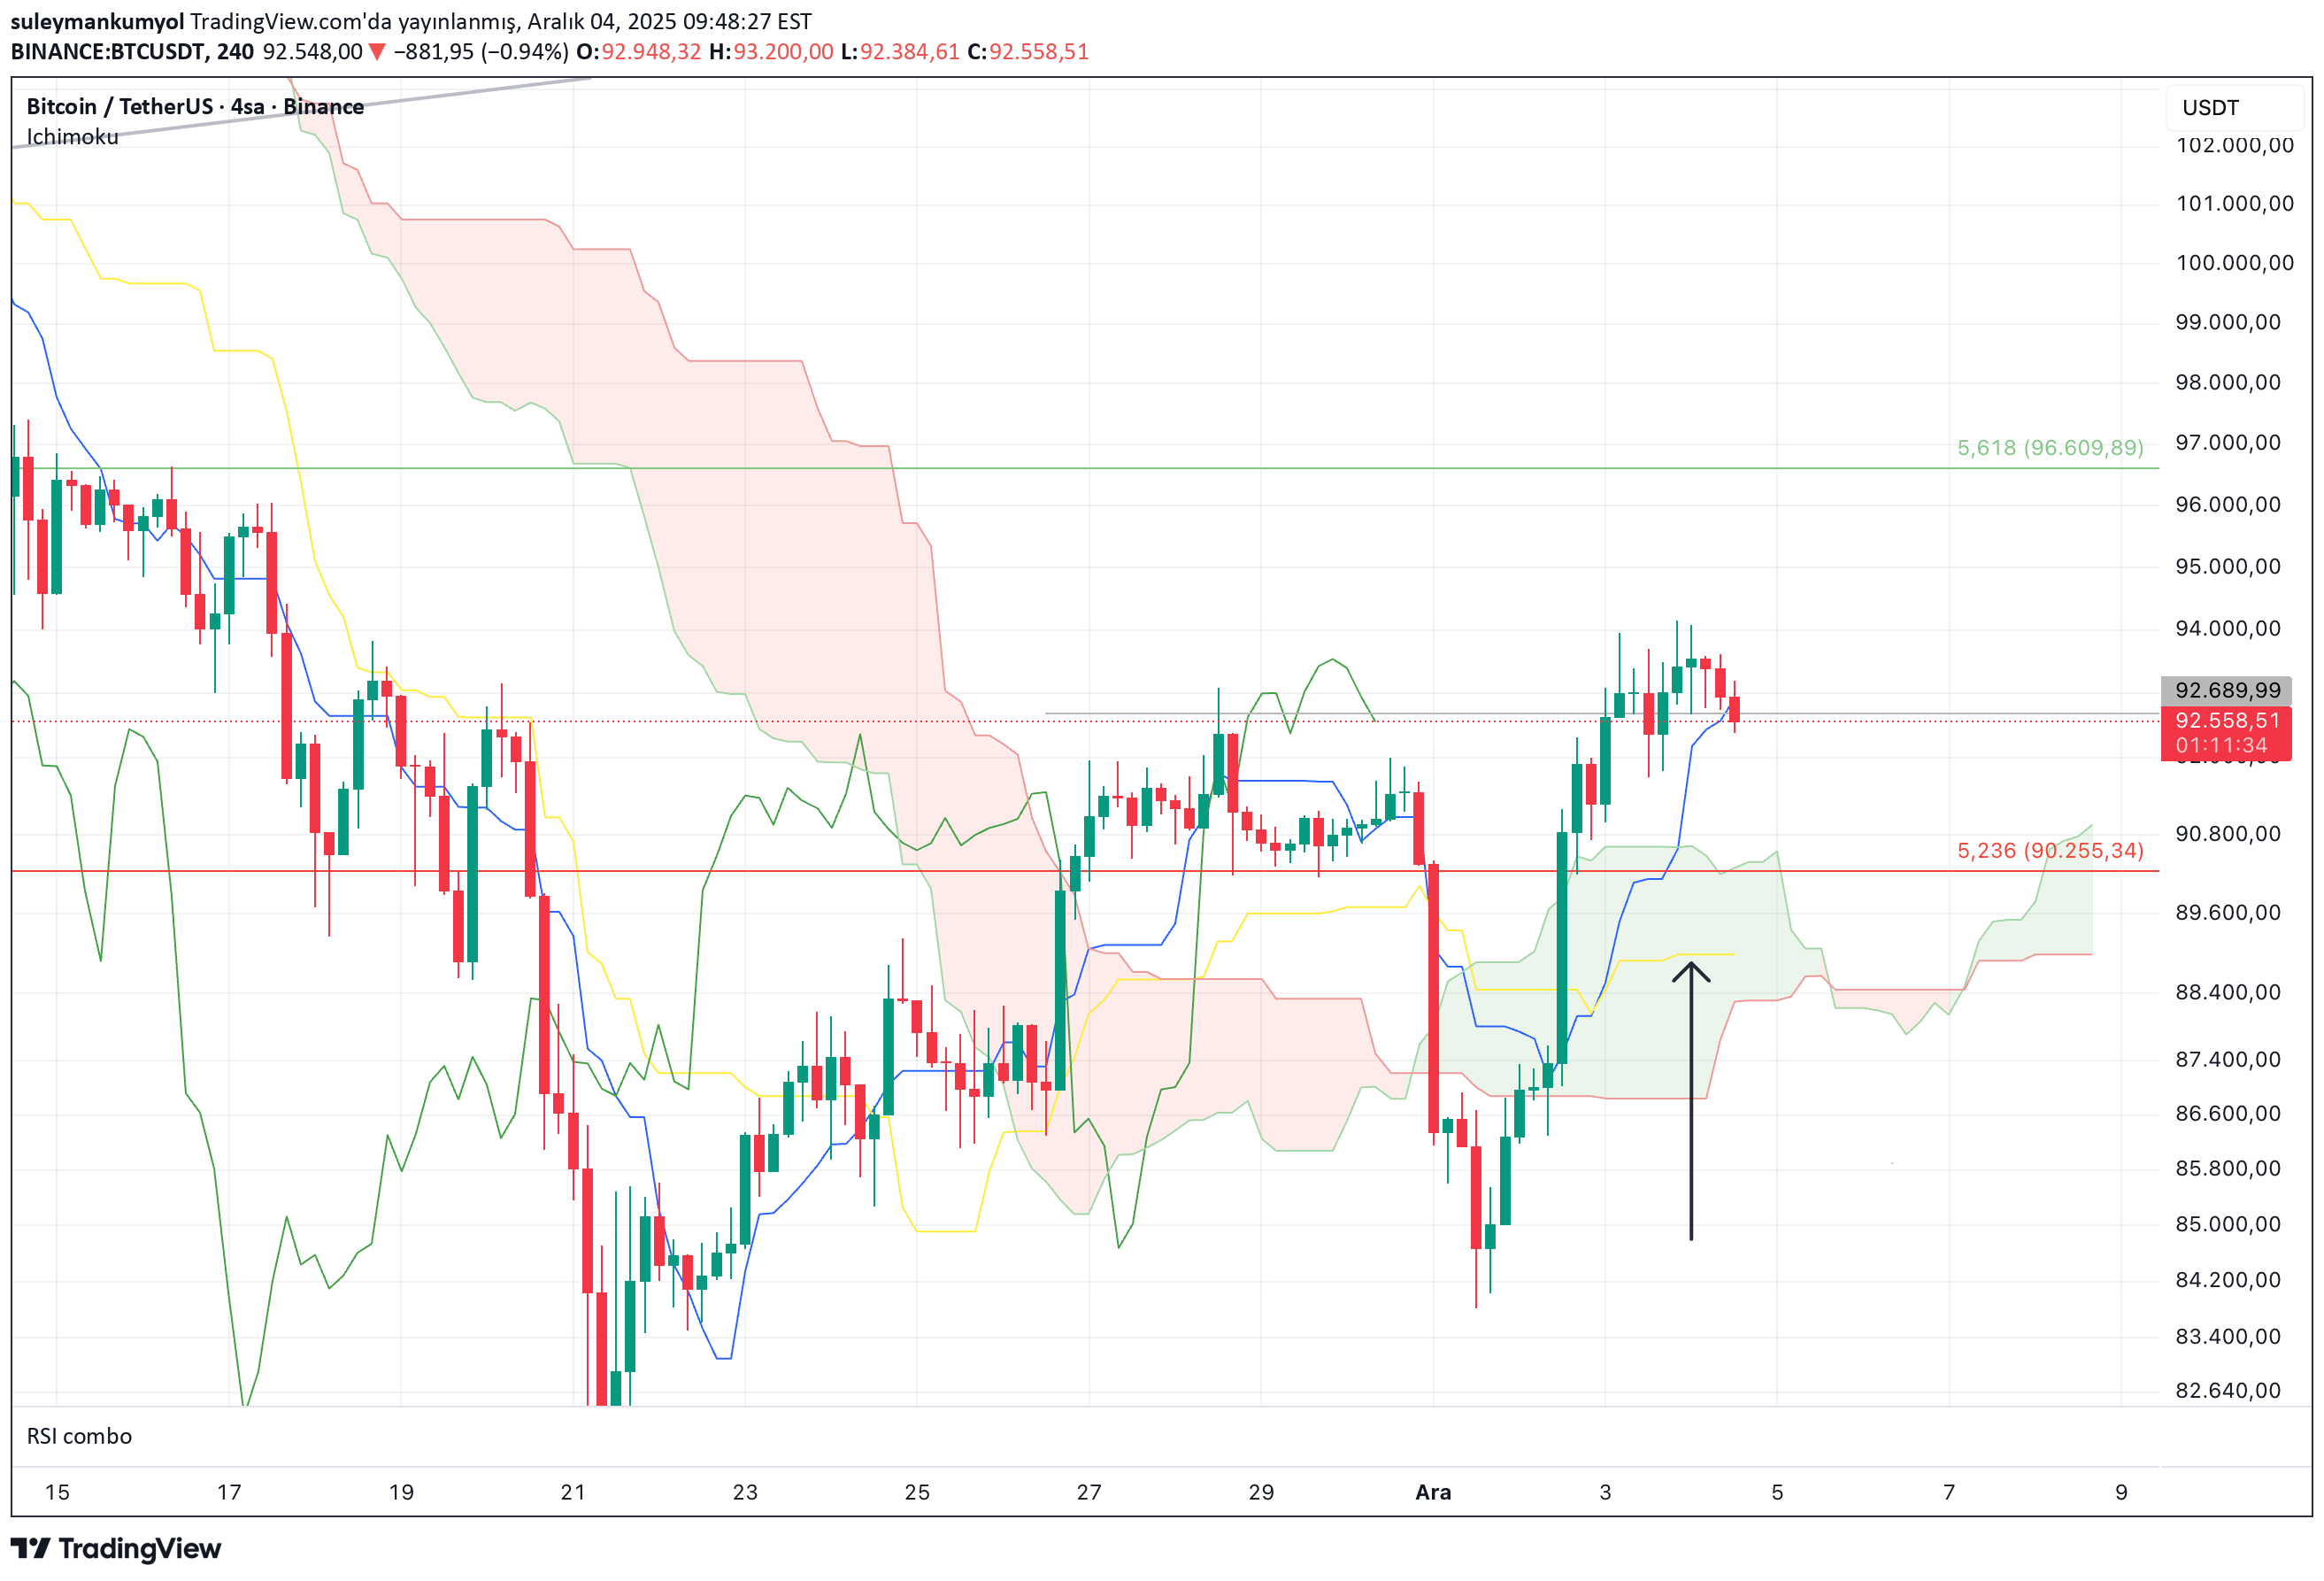
Bitcoin - Short Term When the yellow line I showed with the arrow goes above the cloud, BTC starts to move upwards. Ichimoku is not an analysis method I use all the time. But technical analysts know. There is such a thing as reaching consistency. It seemed to me that it had reached its consistency. Day closes below $90000 may deepen the decline. I wish everyone good luck. It is not investment advice.
suleymankumyol
پیشبینی کوتاه مدت بیت کوین: سناریوهای صعودی و حمایتی (تحلیل SMA)
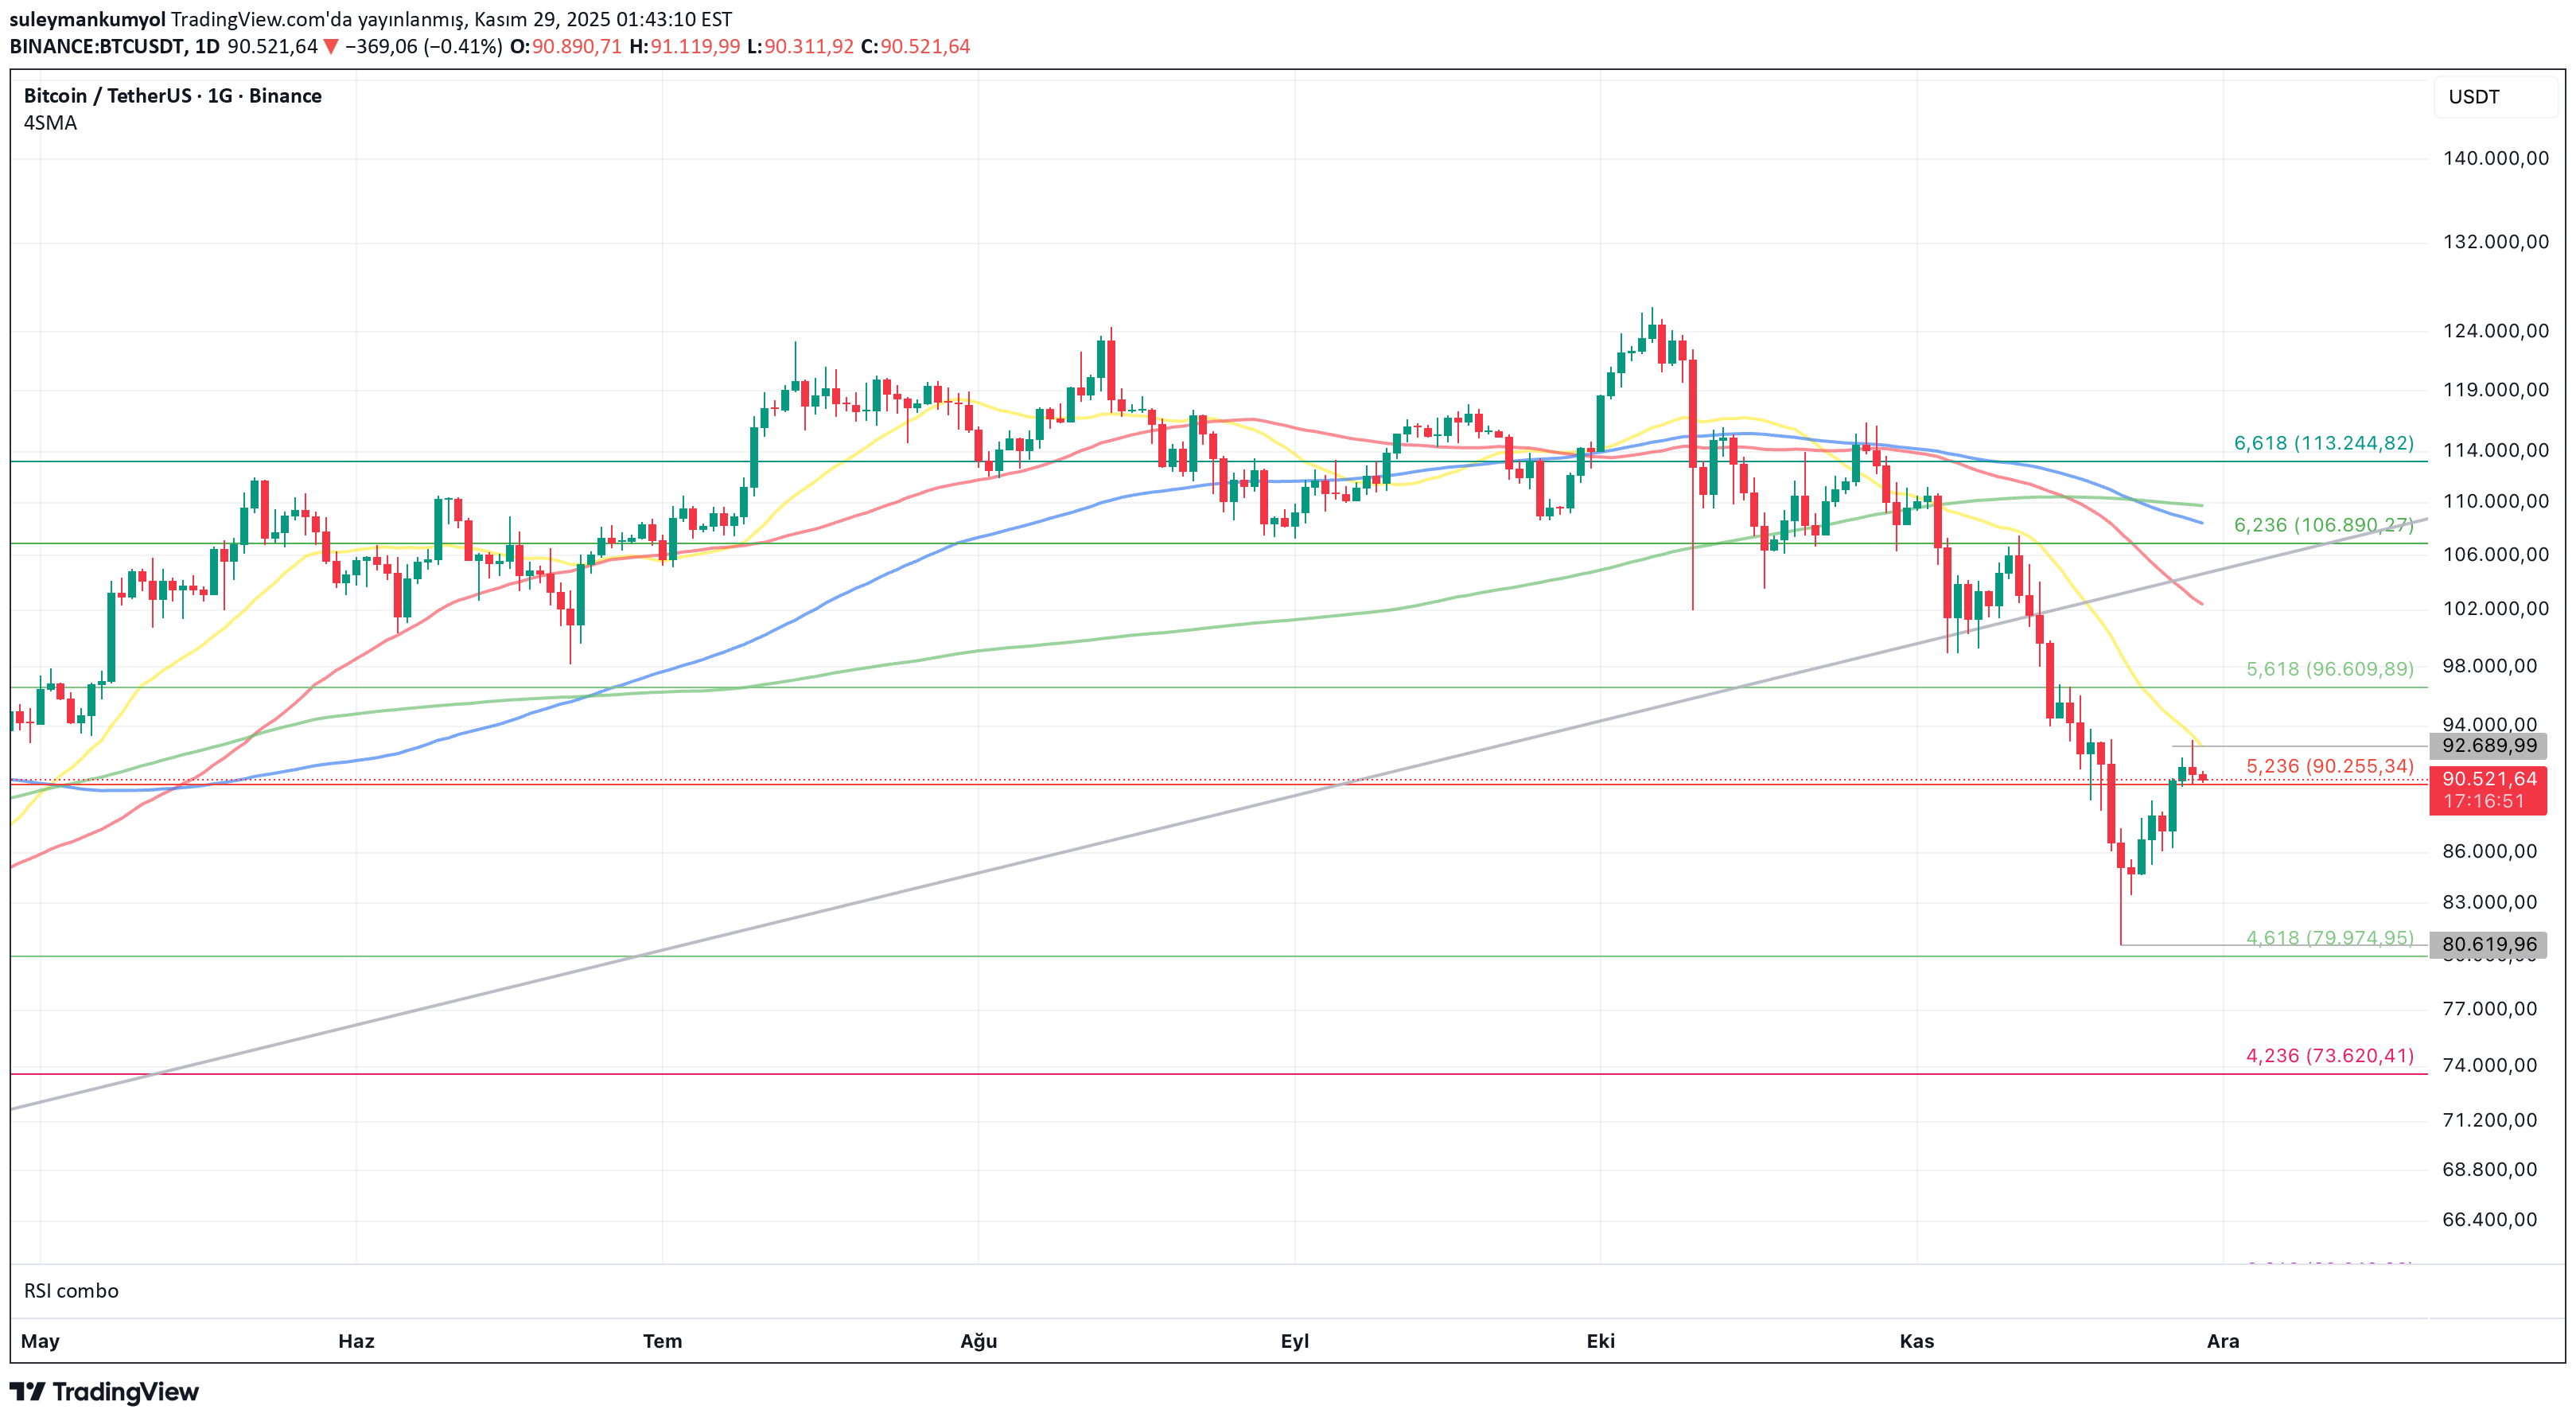
BTCUSDT Chart Commentary When making short-term comments on BTC, instead of looking at complex indicators, I look directly at the relative situation of SMA20, 50, 100 and 200 on the 4-hour chart. Likewise, on the 1-day chart, I determine possible price targets according to SMA20, 50, 100 and 200. This approach, which allows me to quickly answer when I am asked "What will happen to BTC?", works successfully when there is no unusual decline or rise. To interpret the graph, BTC; The rise we expect will not start without a daily close above $92700. If it closes above this level for a few days, it will potentially move to the $96-97000 band. It lingers there and the rise to $102000 begins. If the $92700 close is not reached, the distractions may continue. Here, $87700 will act as support. If the downward trend continues, it is necessary to comment again. But I don't think it will break below $80,000. In summary, there is a BTC oscillating between $88 and $102000. If we make a general evaluation, there is NO bull at the moment. It is not investment advice. I wish everyone good luck.
suleymankumyol
تحلیل OMGUSDT: آیا پادشاه سابق به قعر سقوط کرده است؟ (اهداف و زمان خرید)
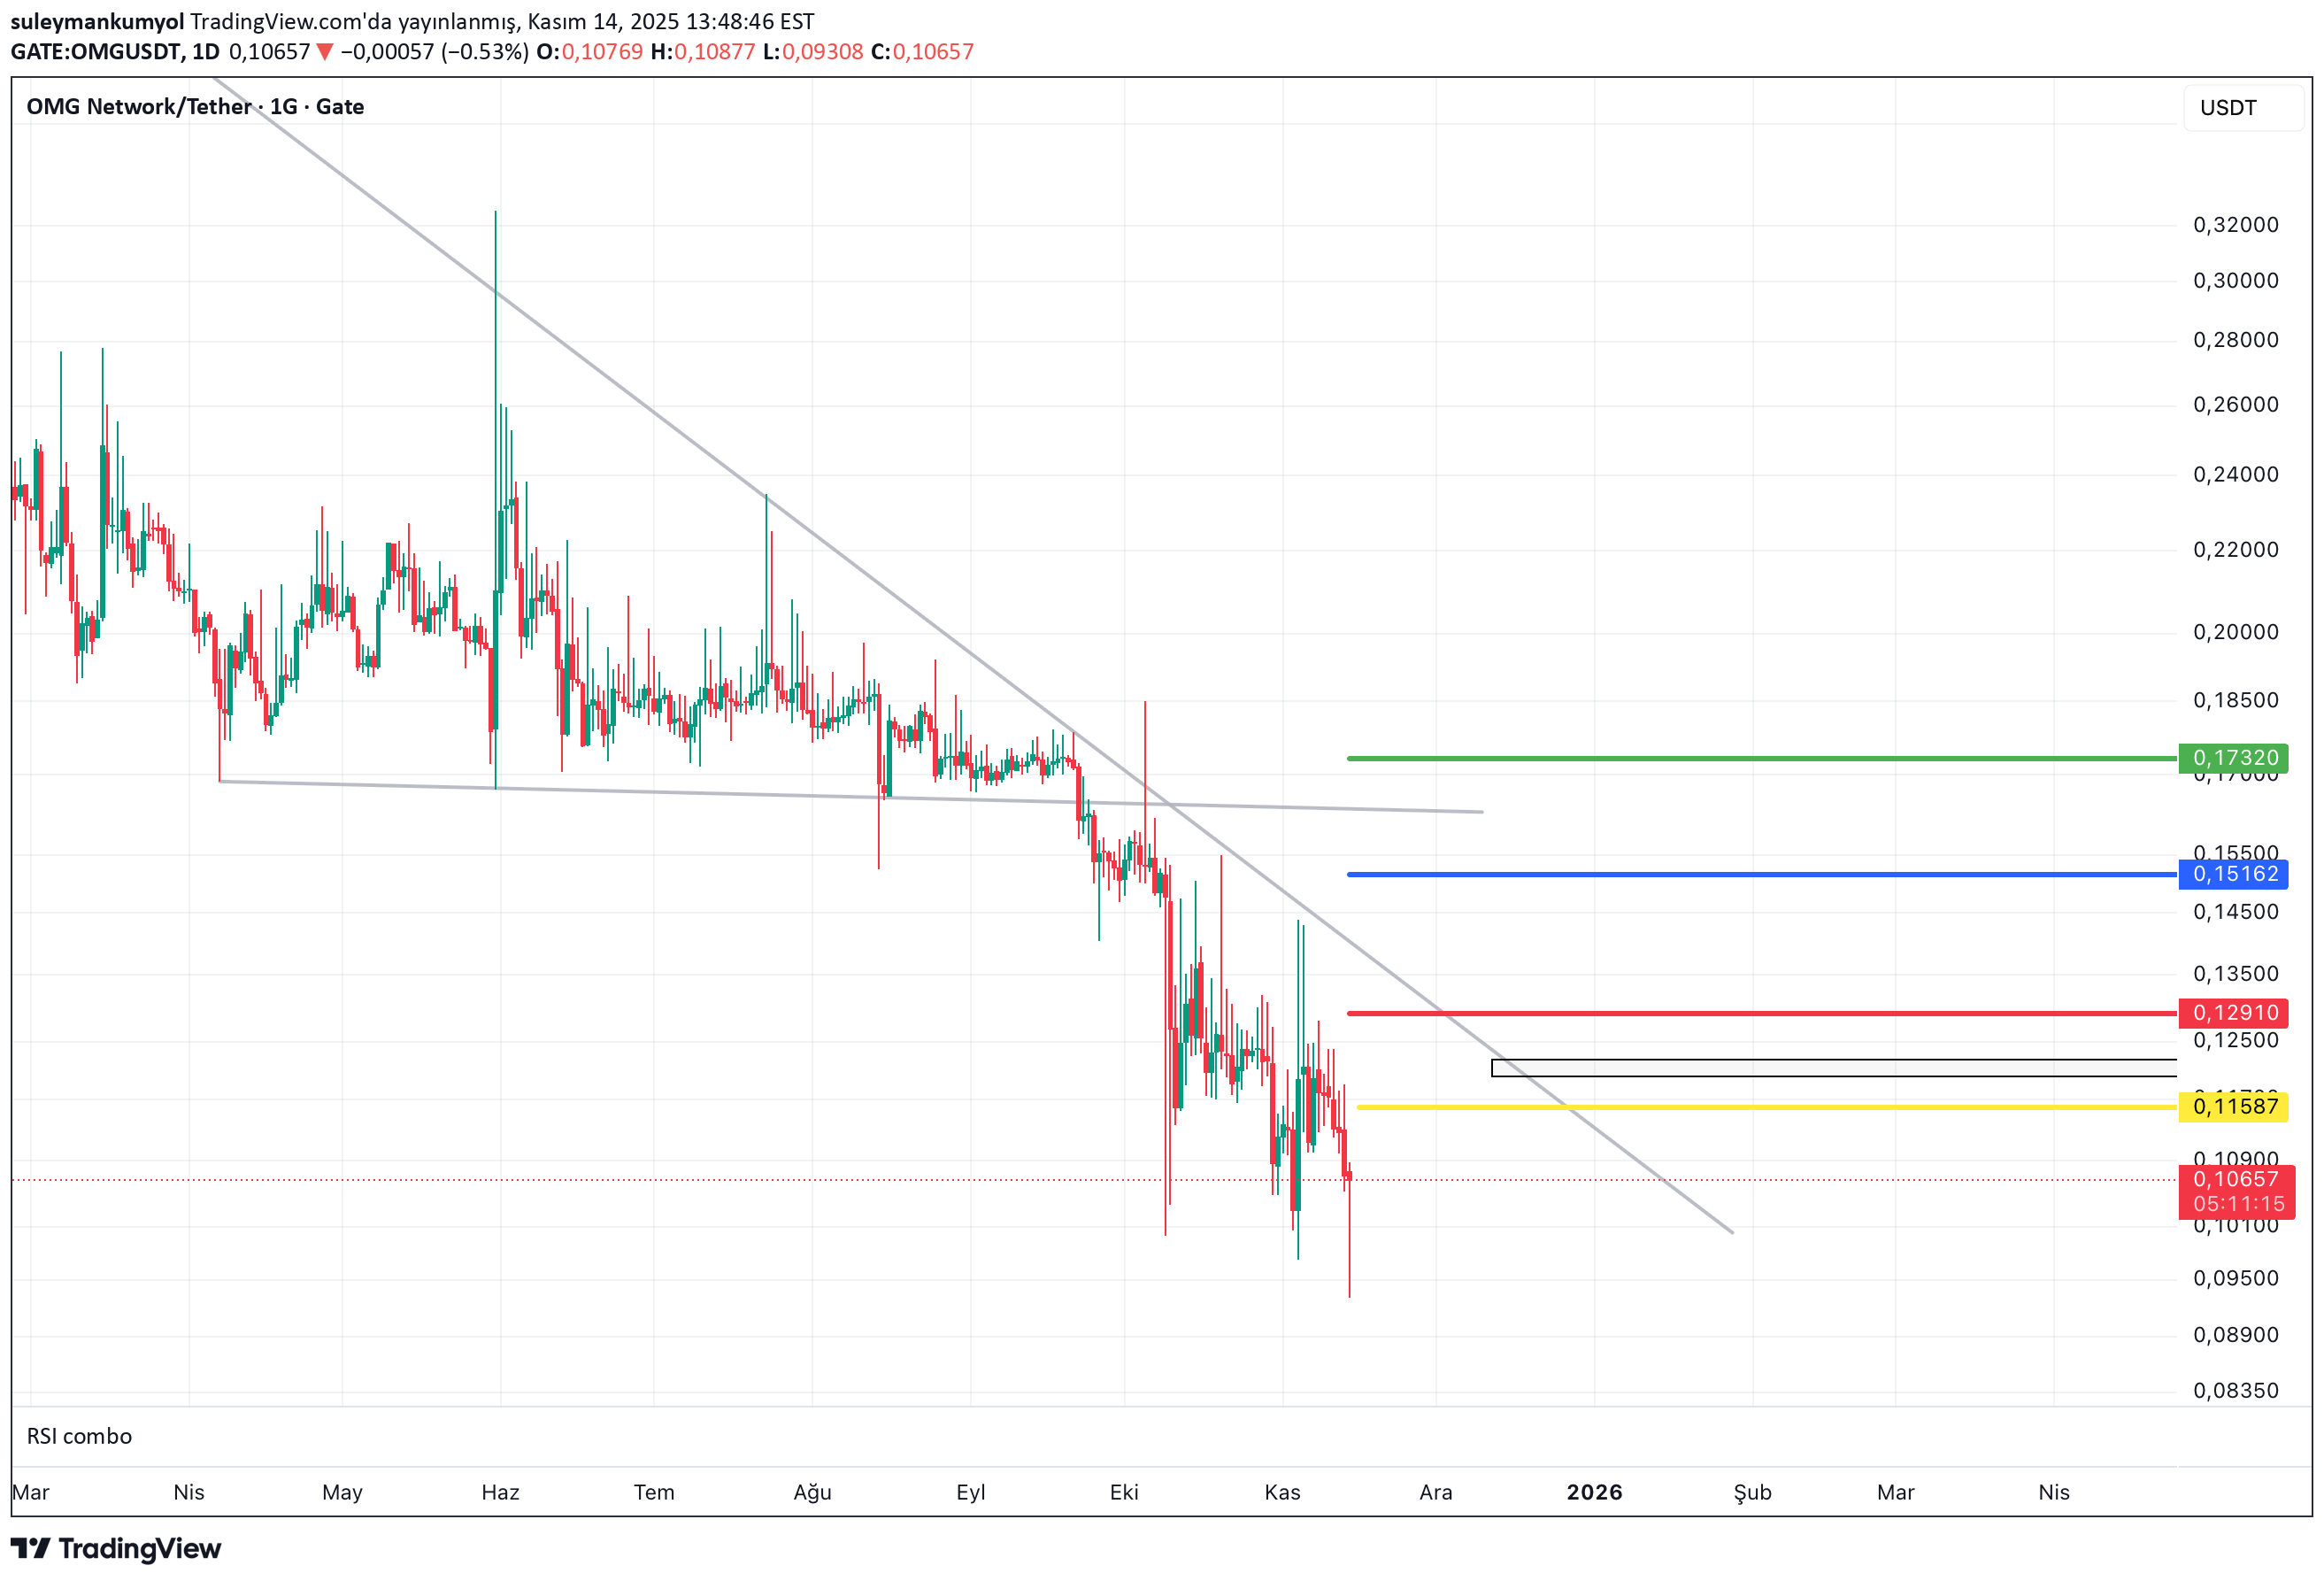
OMGUSDT Chart Commentary The turning point for the OMG coin was, of course, its delisting from Binance on June '24. When we examine the graph, we see this. OMG After the delist process, it tried to resist for a while, but it constantly created needle candles, especially on the daily chart. This situation can be interpreted in two ways. The first of these is as follows: The volume shrank, traders bought and sold on exchanges other than Binance. Secondly, the developers of the coin or the investor who had high expectations from this coin made small swaps. We can think about this. Some people bought it, others sold it and sold more and a needle was formed, and vice versa. In other words, the big holder sold his possessions little by little. I can also say that the market sensitivity of the coin increased after the Binance delist. In other words, when the market fell, it fell a lot and when it rose, it rose a lot. In short, he has an unstable situation. I marked sequential targets on the chart. Although it is an old coin, the fact that it remained in a constant decline after the '21 bull and formed new lows can be interpreted as being suitable for futures trading. I think OMG and similar coins need to go through a plateau phase to recover. This means: It should spend time in horizontal pricing and this should be perceived by the investor as the bottom. We also need to see full candles, that is, candles that do not have a needle and whose price movement is as balanced as possible. I cannot predict where it will fall in a possible decline. Because it is already at the lowest level in its history and continues to fall. When should I consider buying this coin? It will be on my radar after $0.13 and I will consider trading upside after $0.18. It is not a coin that I would keep in my portfolio, but it is a coin that can give good trading opportunities during the day. I know I made a slightly negative comment, but the market is not in a good situation anyway. For those who are left behind in this coin, the right time to exit will probably come in the new year. I believe that if the loss is closed, we should not be too insistent on this coin. What I write here are my opinions. It is not investment advice. I would not recommend that you direct your investments based on what you read here. I wish everyone good luck.
suleymankumyol
تحلیل SNX/USDT: آیا این کوین برای ترید مناسب است یا سرمایهگذاری؟ (بررسی سطوح کلیدی)
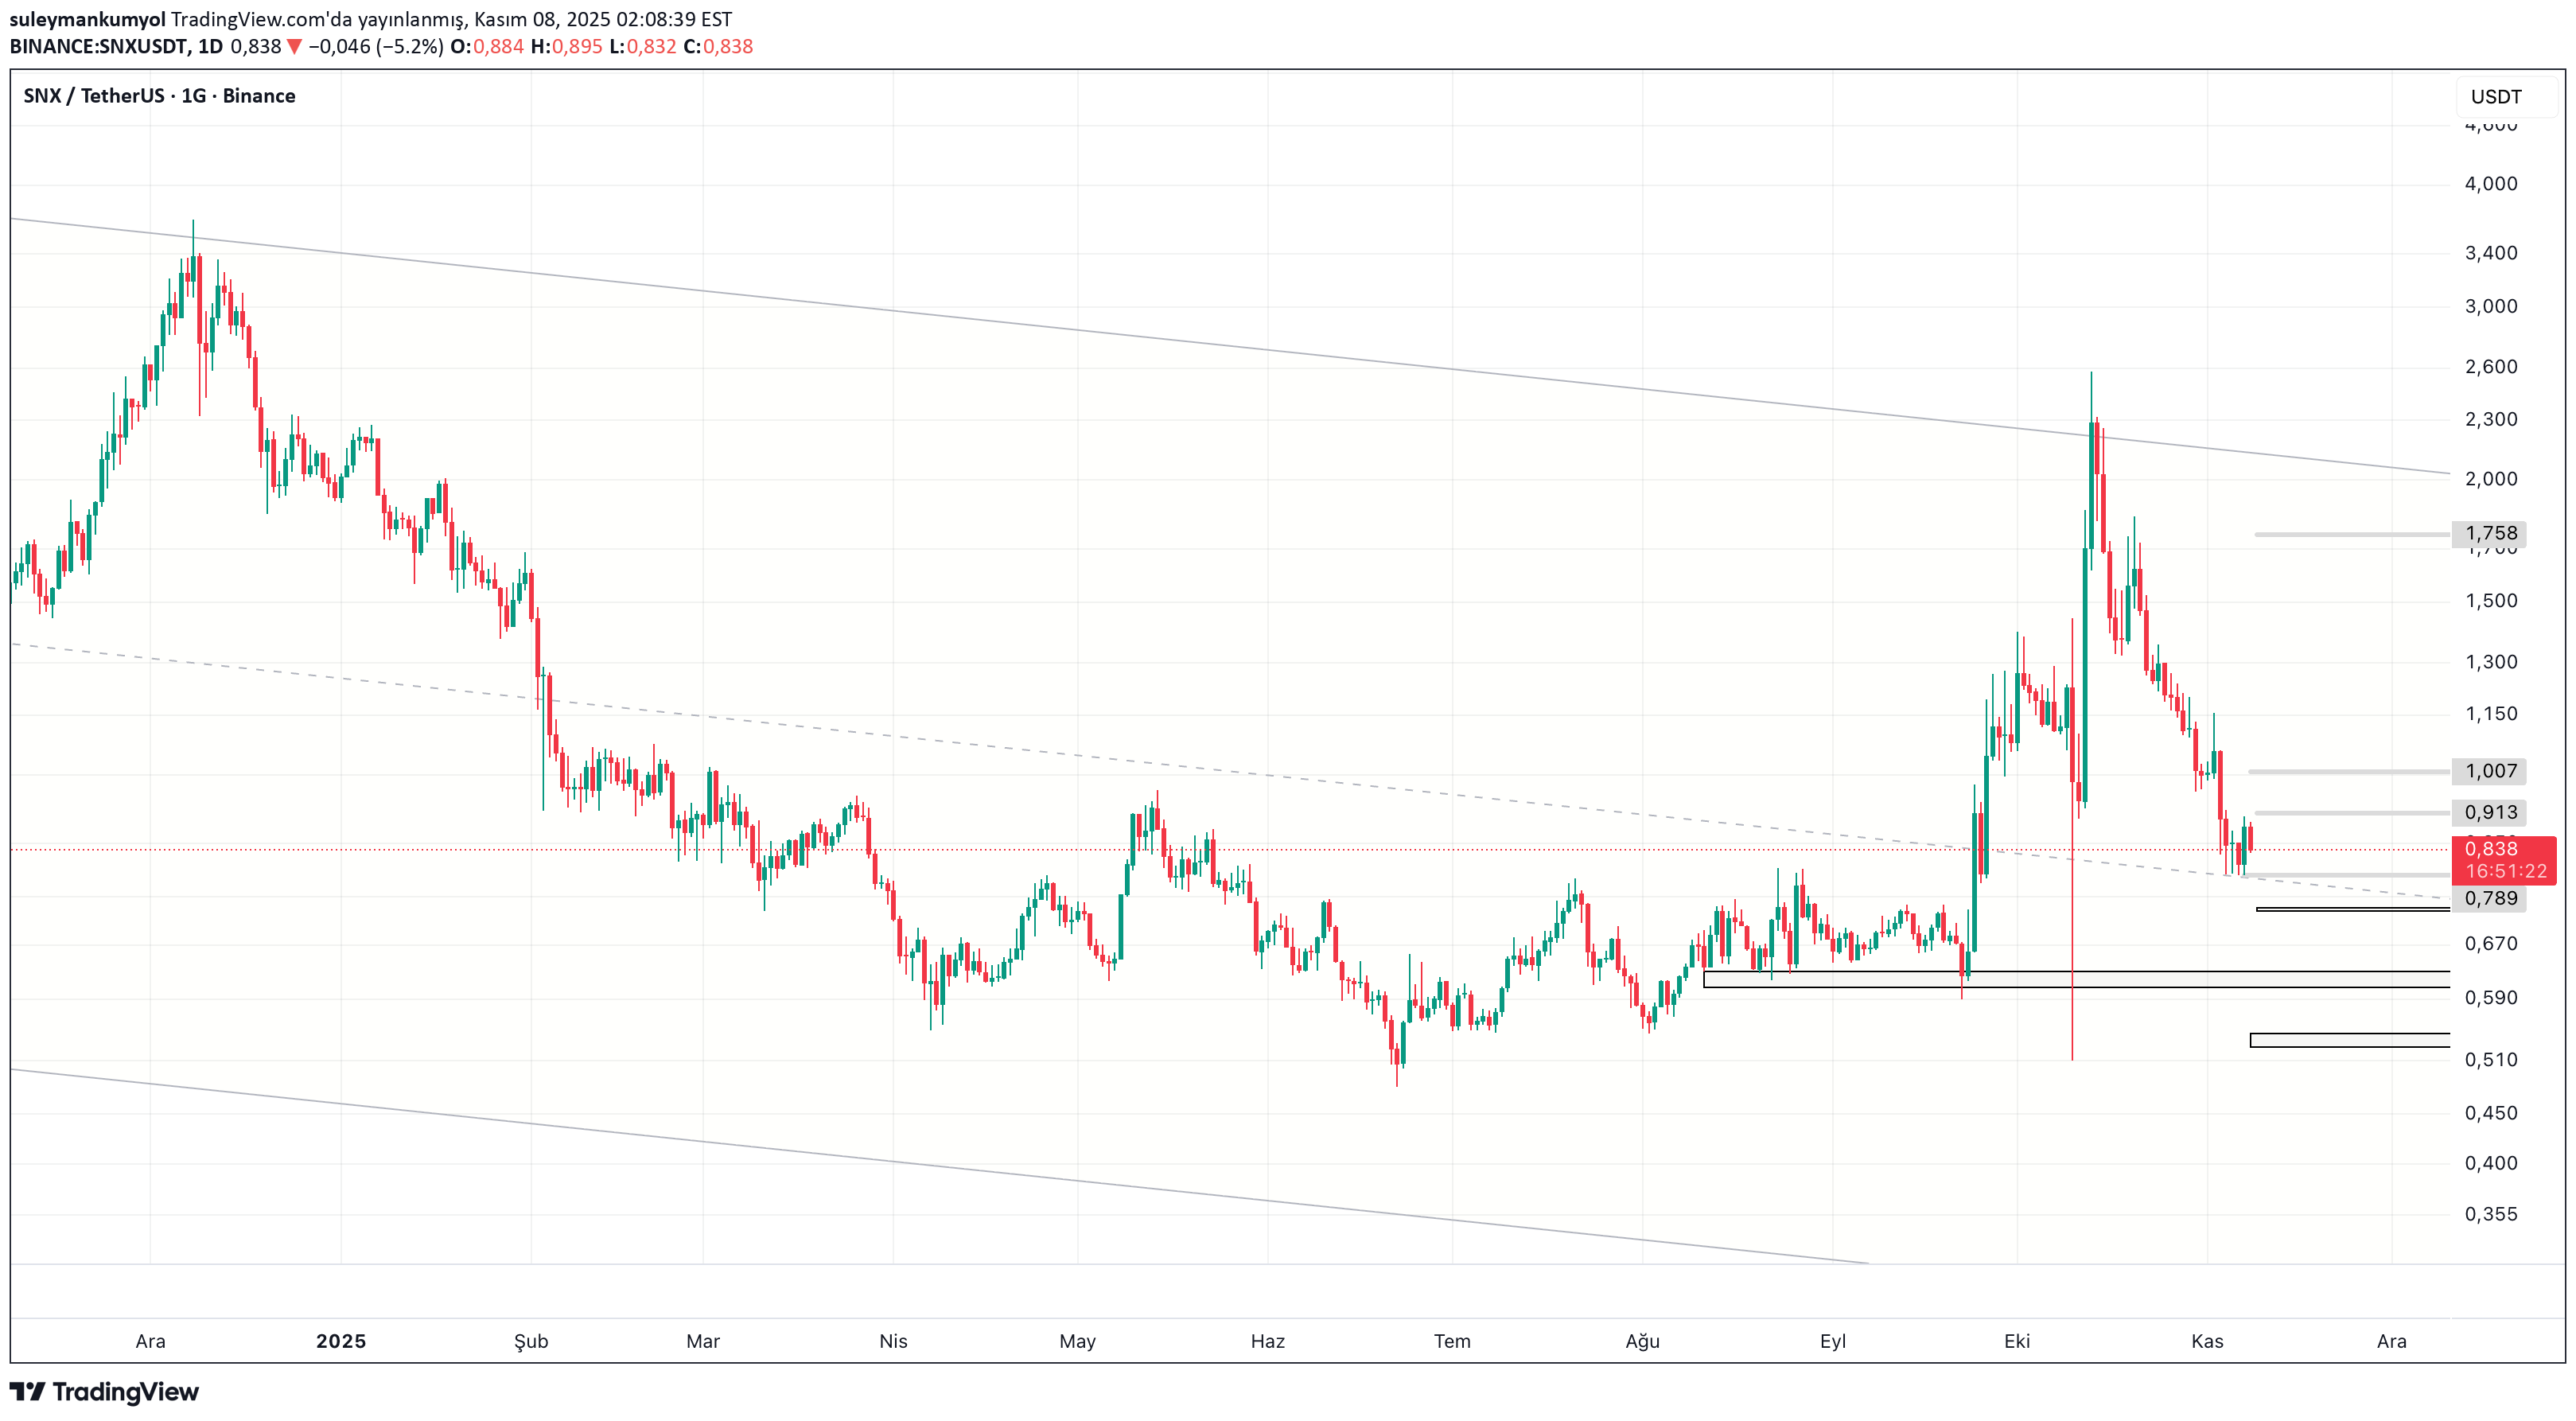
SNXUSDT Chart Commentary If I had to make a general evaluation; I think it is a coin that is more suitable for trading rather than including it in the portfolio. It has been continuing its movement within a large channel since '21. Although the chart I shared here only shows the last year, it is clearly seen that there is a channel movement, especially in the chart showing the weekly time frame. The enthusiastic movement that started on September 24, '25 carried SNXUSDT to the $2.3-2.4 line, which is the upper band of the channel. This big movement differed from the general situation of the market and caused SNXUSDT to diverge positively. However, before this big movement took place, it remained horizontal for about 5 months and accumulated, that is, it gained strength. In these types of coins, that is, coins that stand out from the market, the trader effect is still very high. In other words, price movement was achieved due to the push of traders rather than investors. For this reason, I do not include it in my portfolio, but I trade it. What I am telling you are my opinions. It does not contain investment advice. Let's talk about what the chart says. SNXUSDT has now supported the daily SMA200, that is, the $0.79 band. This line is also the middle line of the major channel, that is, a separating support. If serial day closings occur below the midline of the channel I showed in the chart, that is, if the day closes below this line for a few days, $0.63 and then the $0.52-0.55 band will work as support. If it falls below this, we need to re-evaluate. Before explaining the stops in a possible upward movement, I must say that SNX should do some horizontal pricing and gather strength. Additionally, a Death Cross has formed on the chart. On the daily, SMA20 crossed SMA 50 below. This is a situation caused by an extreme increase from the end of September to mid-October. But this indicator may keep investors away for a while. In other words, they may say that the coin has already made its move and do not prefer it. These are just comments. It could also be the opposite. But I think it will spend some time sideways and do whatever the market does. So I don't expect any drastic action. The above pricing will be as follows: There is daily SMA100 in the 0.913 band. A big rise will not start before passing this. After that there is $1.03. This will also be a nice stop. The upper band of the channel, that is, the $ 1.7-2 band, has served as resistance for about 5 years. So this place is like an impenetrable castle. If this resistance is broken in a possible bull run, extremely high and surprising prices will occur. I'm adding this as an extra comment. It is not investment advice. I wish everyone good luck.
suleymankumyol
تحلیل تکنیکال FIDA/USDT: چرا این ارز دیجیتال هنوز "خودش را پیدا نکرده" است؟
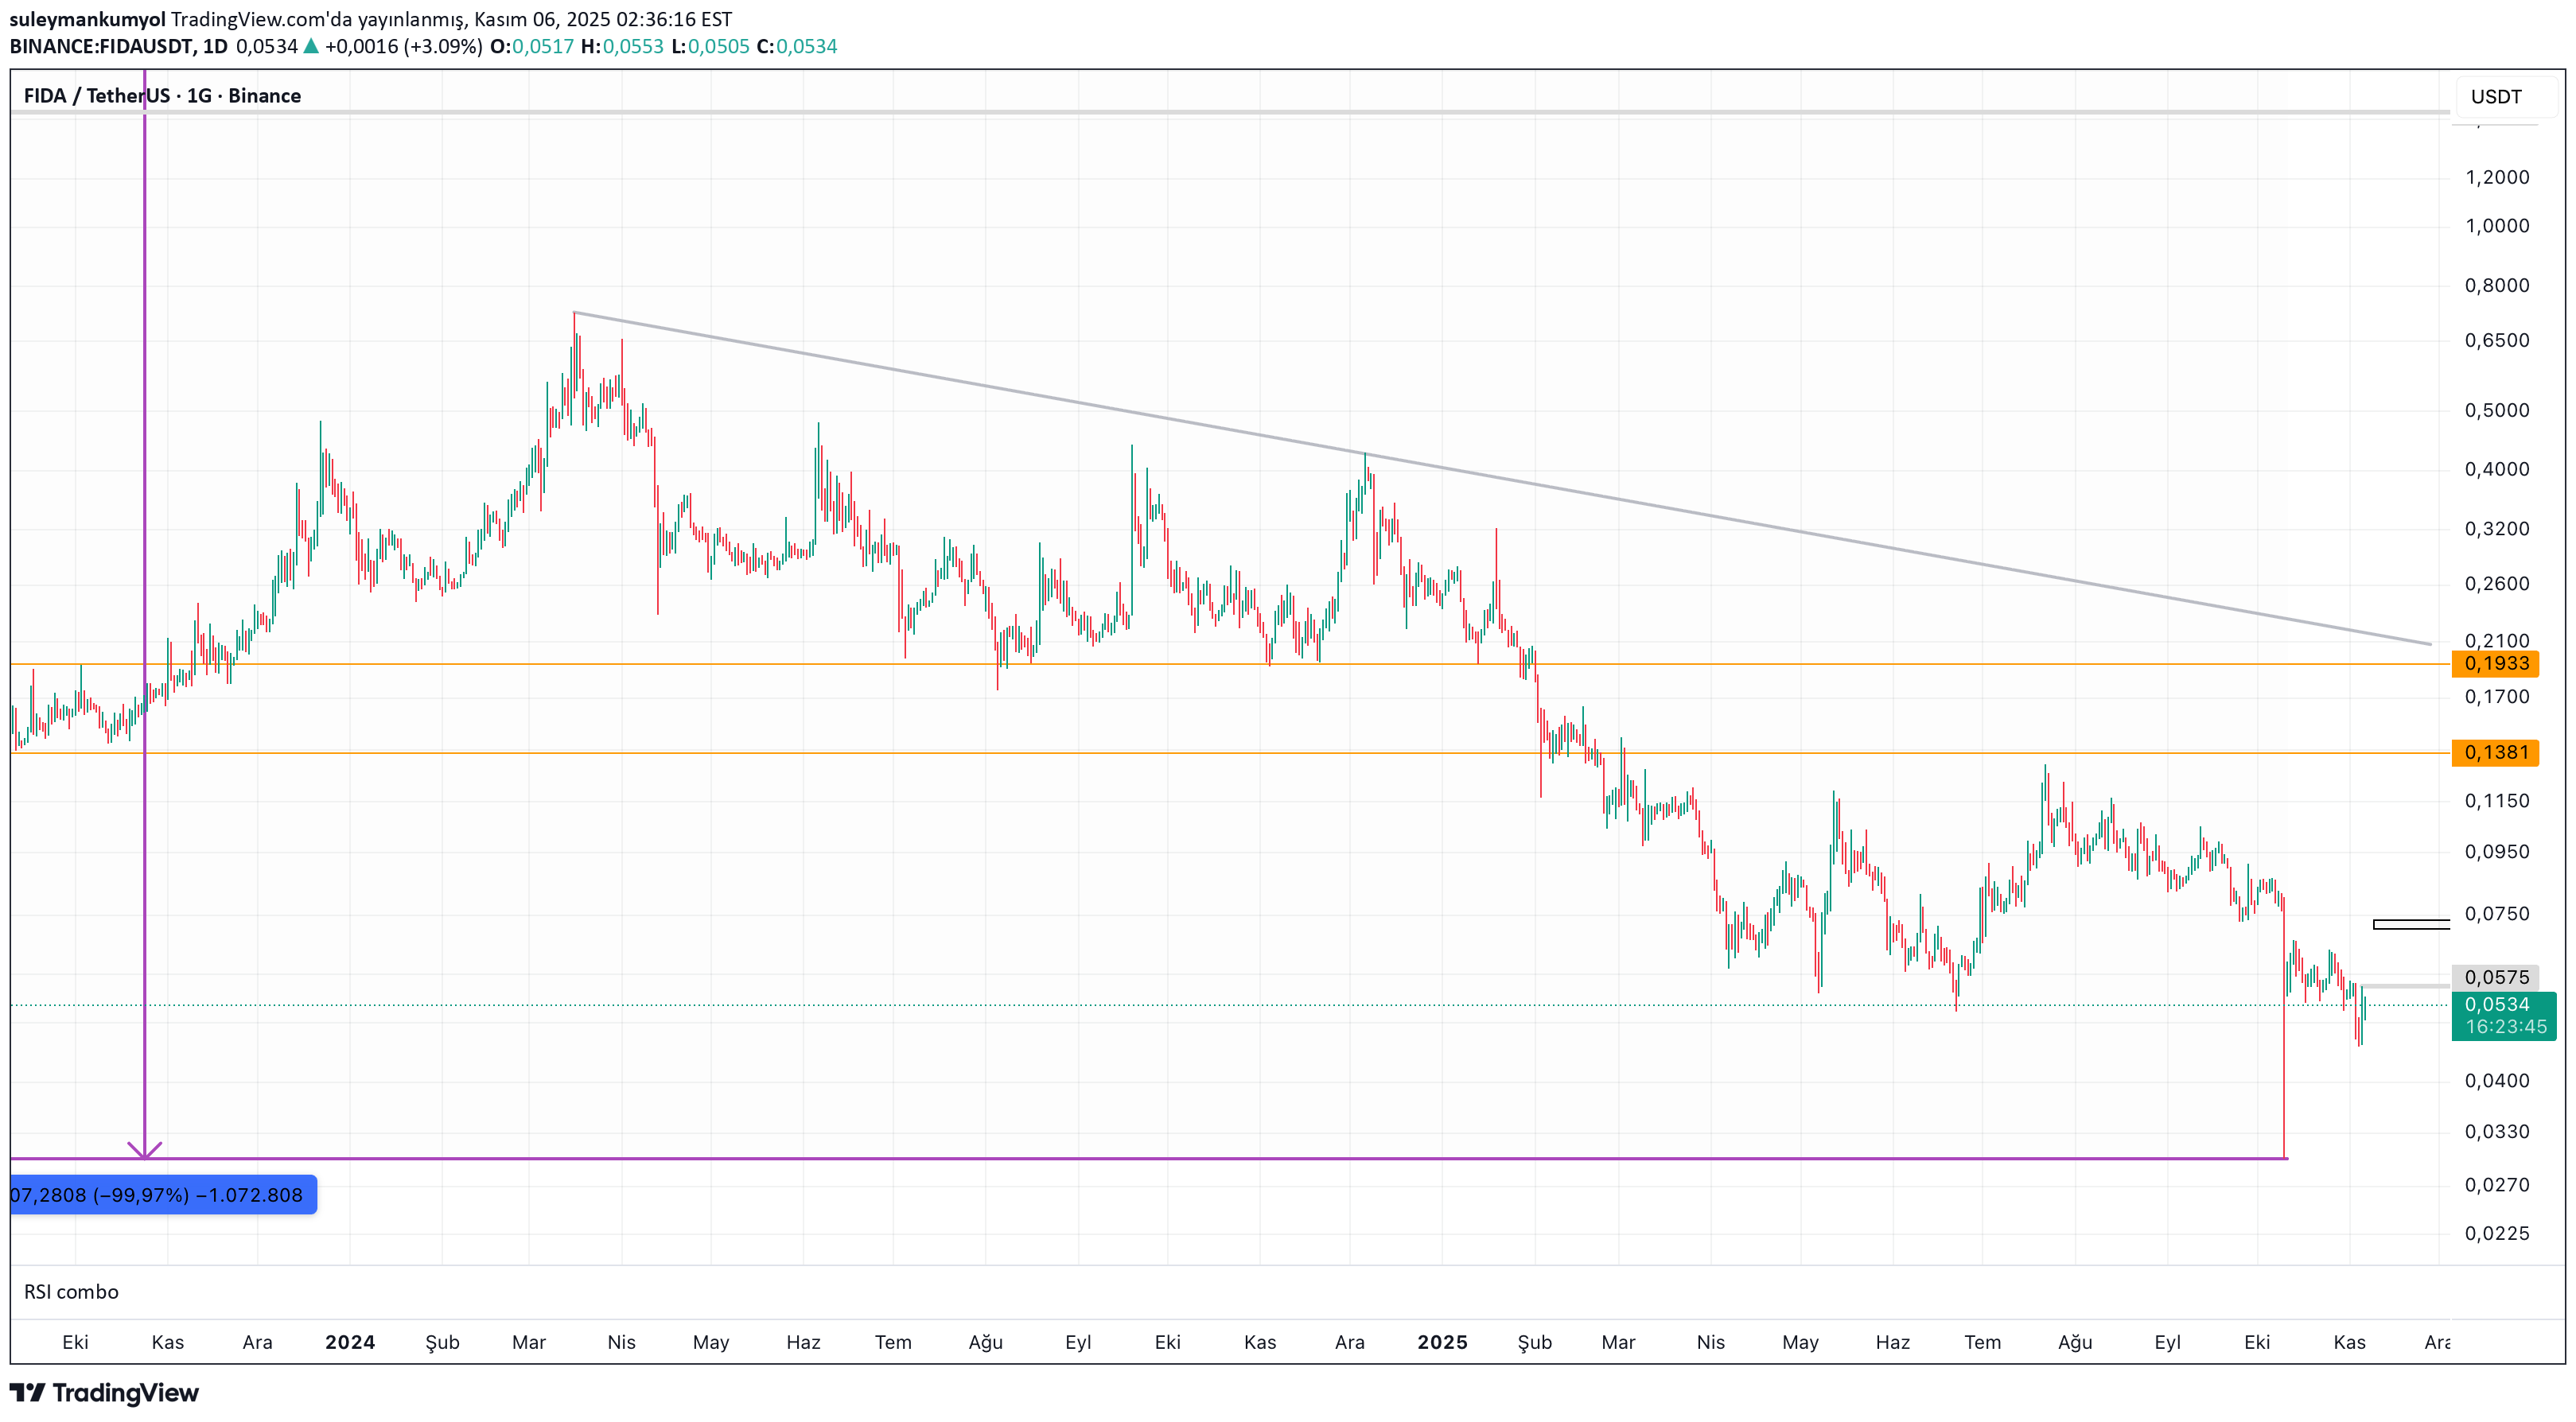
FIDAUSDT Chart Commentary I did not like this coin. I am aware that it is a harsh entry, but when the chart is examined carefully, there is a difference of exactly 99.97% between the ath level in 2021 and the pricing of the destruction day that the market experienced on October 10. In other words, it is a coin that was offered in the long 21 bull and could not find itself after that. In addition, although it is in the SOLANA ecosystem (koaly naming function in the Sol ecosystem), it has not experienced price fluctuations in parallel with Solana. I saw this as an organic disconnection. It is necessary to comprehensively examine what the community or developers say. Let's see what the graph says: Sequential day closes above $0.0575 could initiate an uptrend. However, there is resistance in the $0.072-0.075 band. If this is exceeded, we may see a sharp upward movement above our expectations. This movement will probably remain as a needle throw. If the trend line at $0.2 is broken, extremely positive pricing may occur for FIDAUSDT. If we look at the negative side, we can say the following. It is a coin that has remained horizontal for a long time and has not been able to form a bottom. This is a situation that will alienate investors. A few years ago, FILUSDT was able, at least partially, to come back after a huge devastation. I don't know if FIDAUSDT's story is similar to this. In my opinion, it is not possible for this coin to make the desired and longed-for movements before the market moves upwards. I showed sequential targets in the chart. It is not investment advice. Leveraged transactions should be avoided. I wish everyone good luck.
suleymankumyol
تحلیل تکنیکال RENDERUSDT: آیا فرصت خرید جدیدی در راه است؟
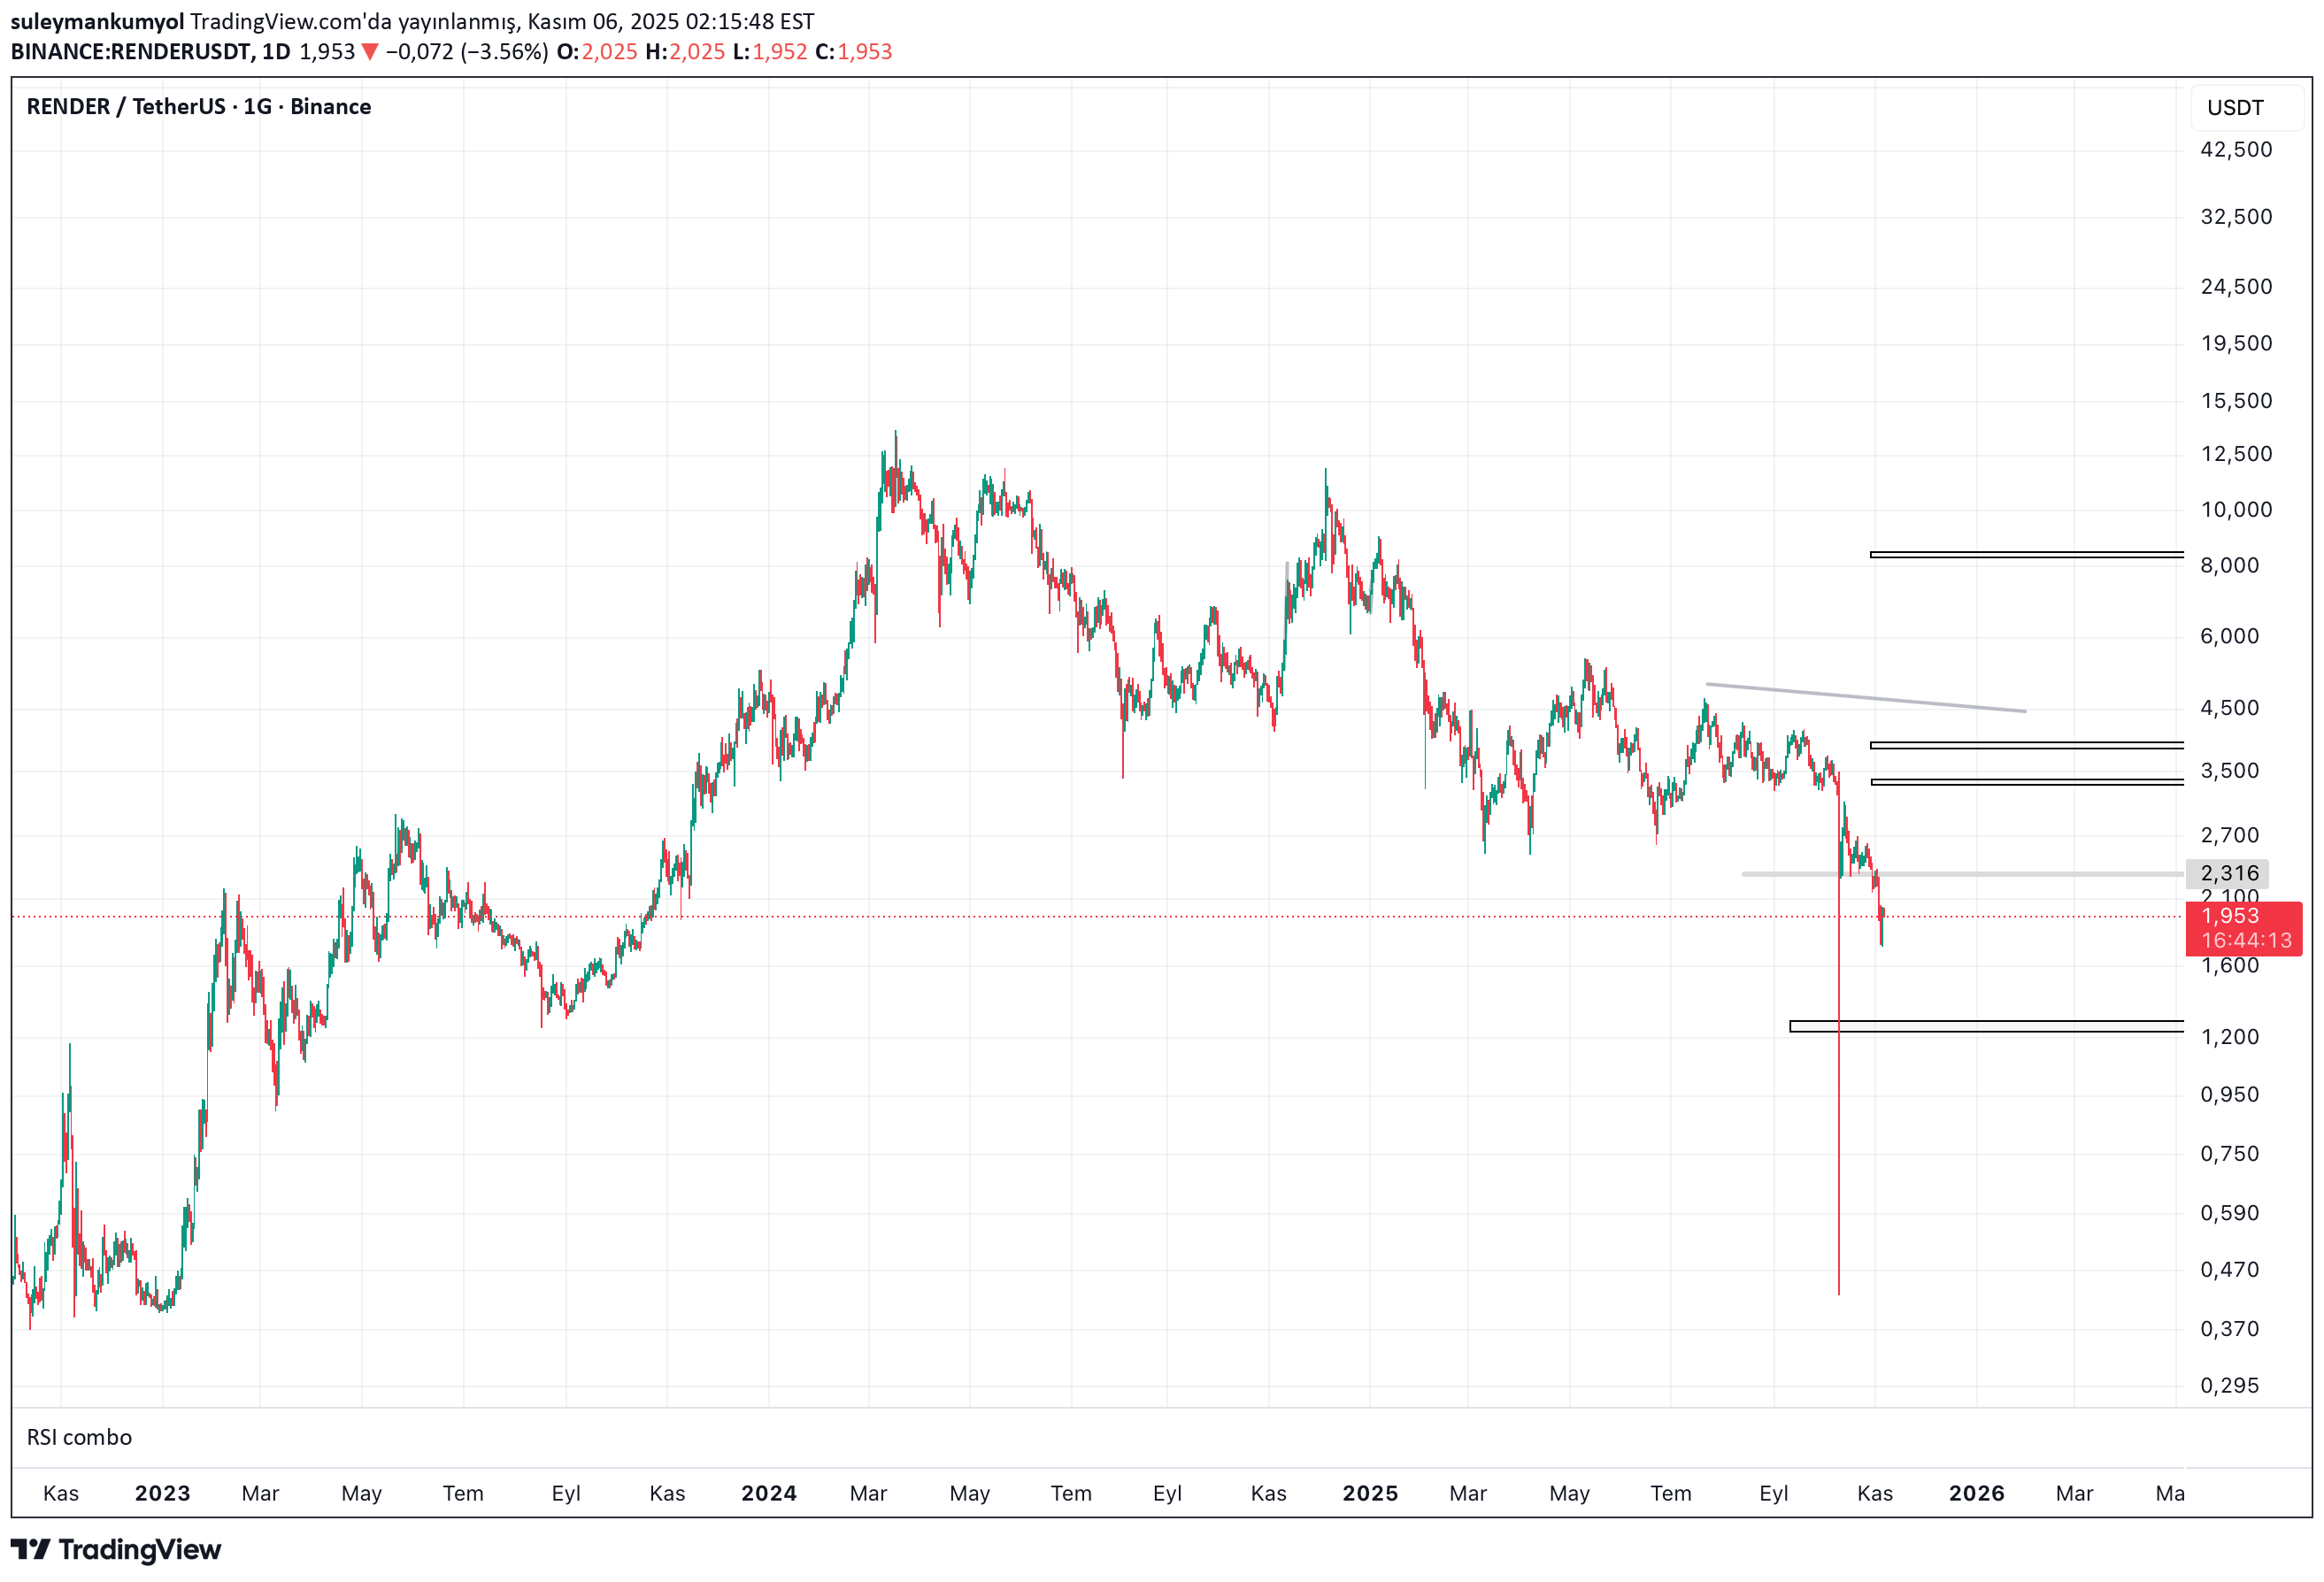
RENDERUSDT Chart Commentary Render is a coin that has provided very good profits to its investors, especially in the period until last New Year's Eve. For now, it is possible to say that it has lost its energy. However, this situation does not require pessimism because it is not independent from the general market. Since they all fell, Render also fell. If we interpret the chart, there is a bottom area in the $ 1.30 band. It may not go this far. However, it needs to rest horizontally for a bit for upward movement. Daily SMA20 is present in the $2.3 band. Sequential day closes above this level quickly send RENDERUSDT to the $3.4 band. But it is not right to wait for that momentum right now. It is necessary to follow the market when it recovers. I marked the sequential targets on the chart. When it starts to move horizontally, it will become suitable for futures transactions. I wouldn't prefer to keep it in a portfolio, but it can be traded very well. It is not investment advice. Stay away from leveraged transactions. When the market crashed, I started writing comments again. Please take a look at them all. I wish you good luck and have a good day.
suleymankumyol
تحلیل تکنیکال و پیشبینی قیمت AVAX/USDT: اهداف صعودی و کف قیمتی احتمالی!
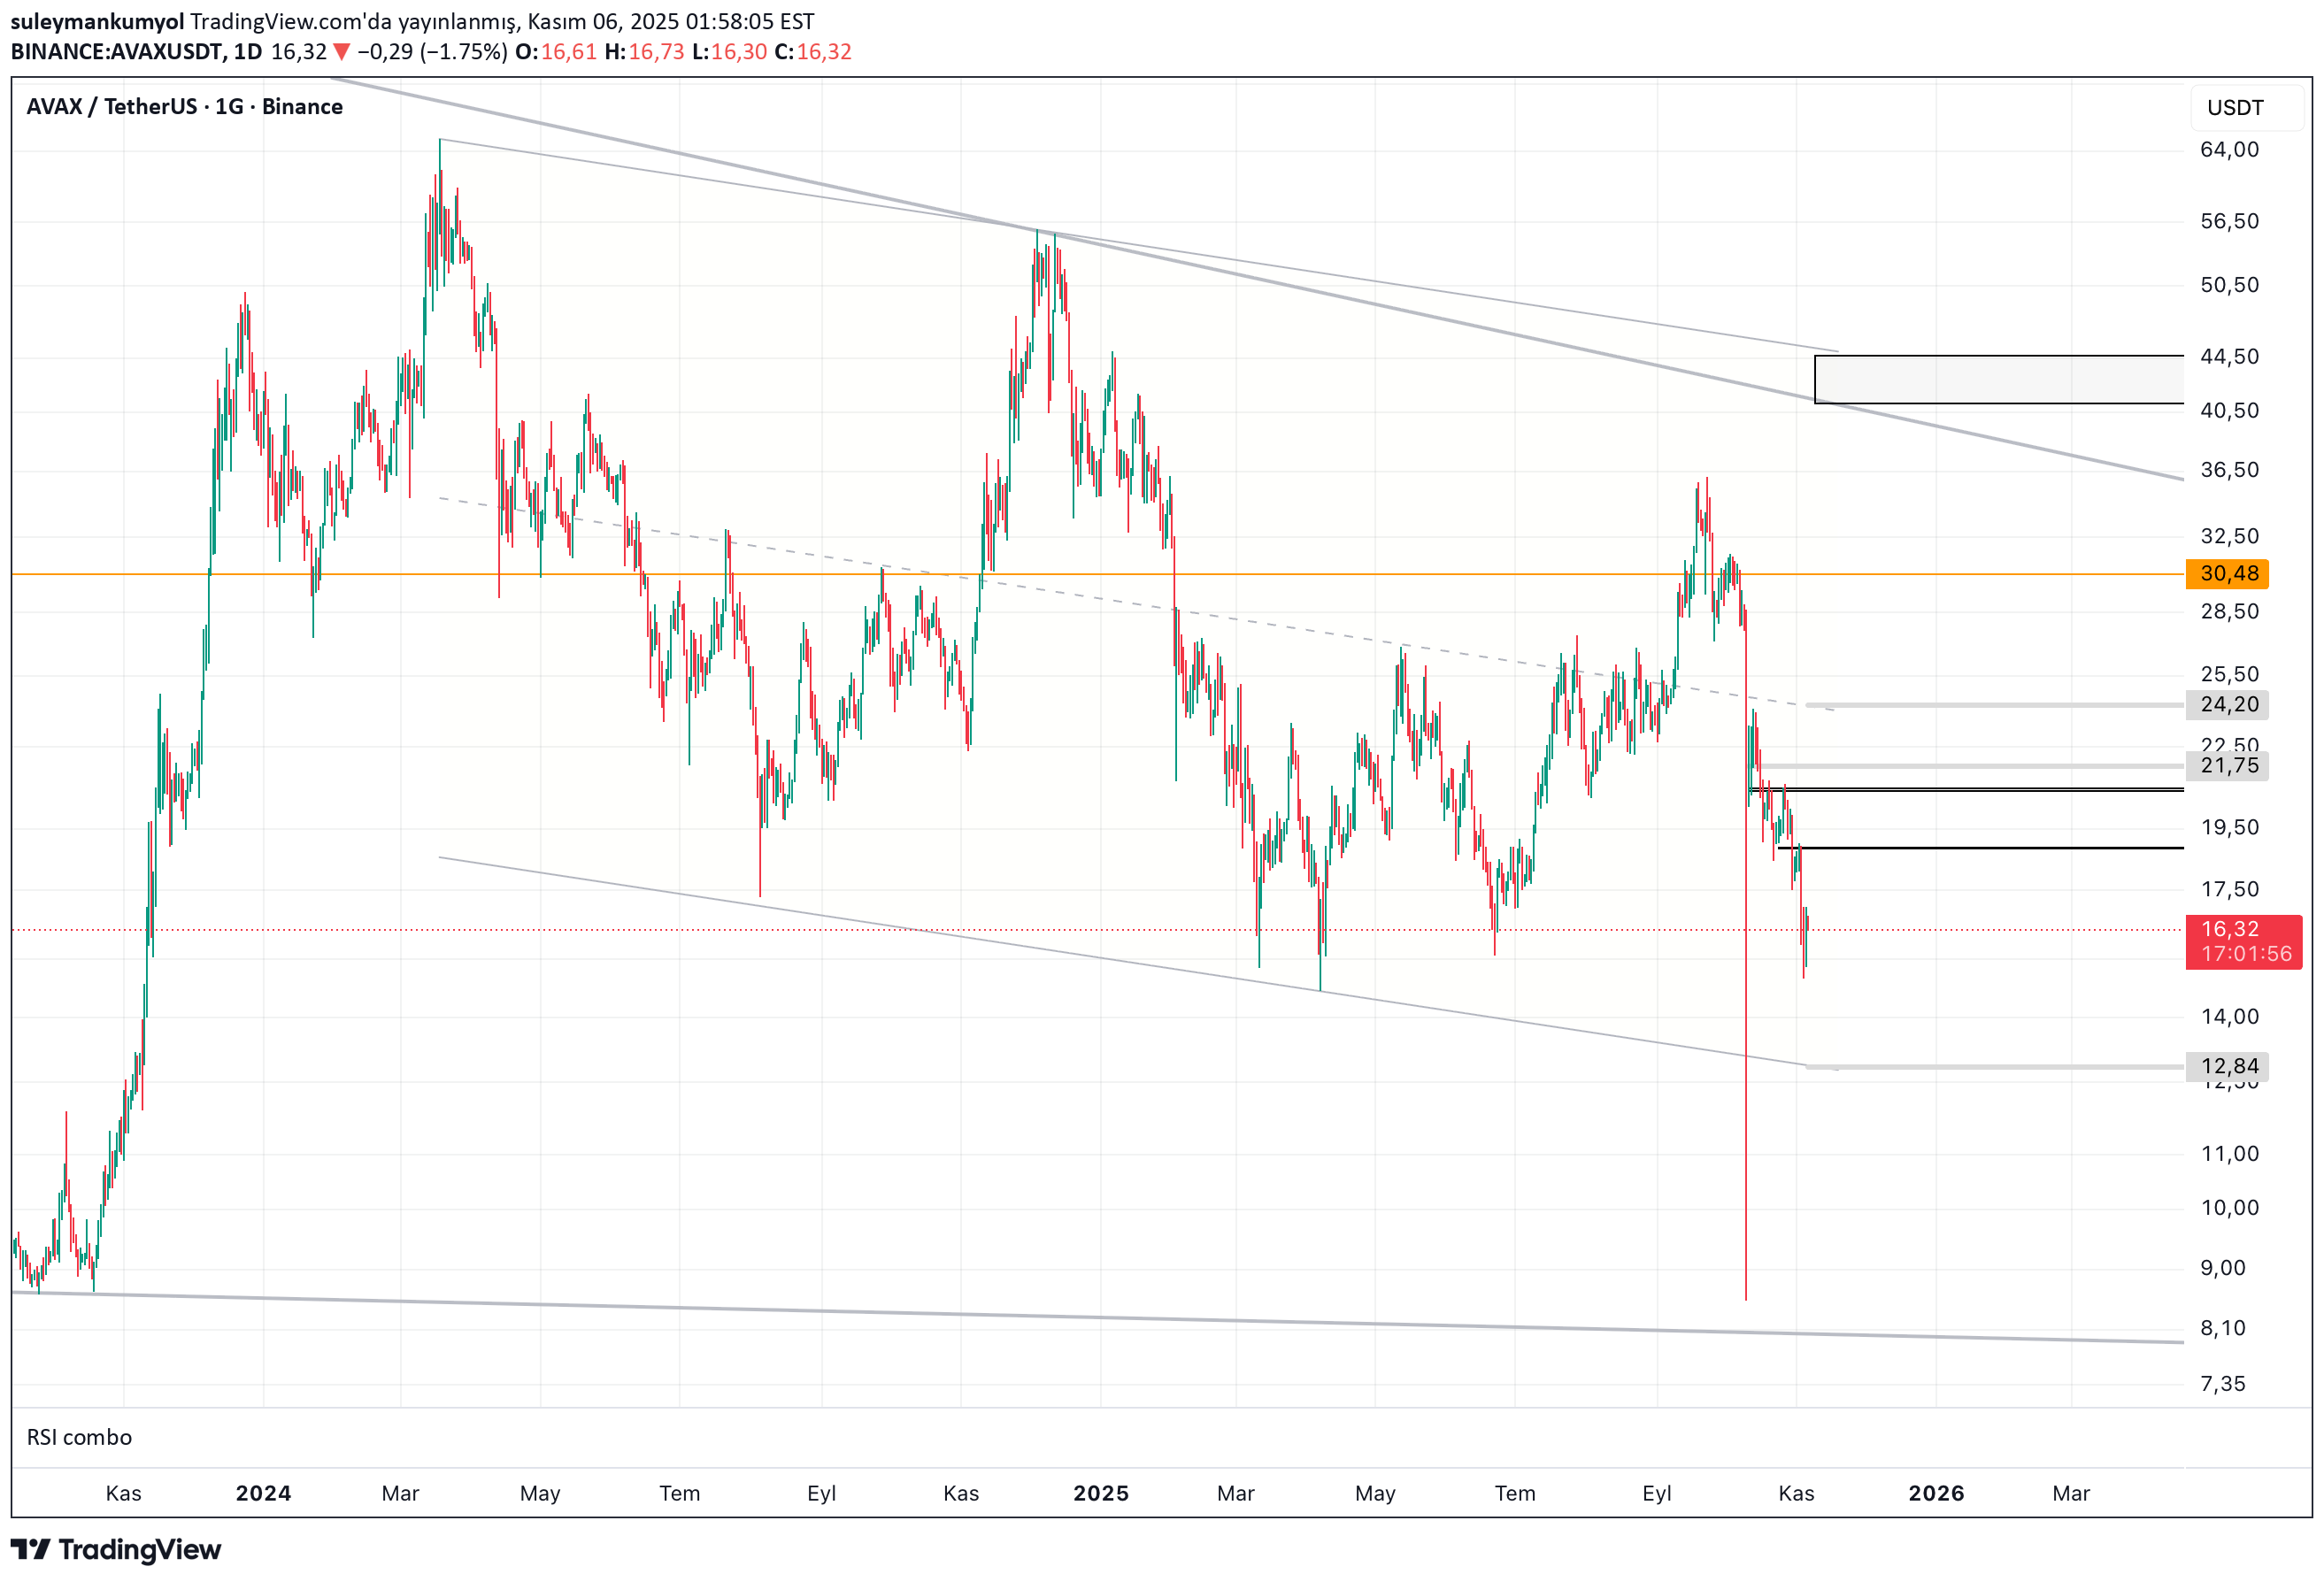
AVAXUSDT Chart Commentary I am sharing the graphic in its raw form. Avax is a major altcoin that I like and have in my cart. Being in the top 20 reduces its vulnerability to price fluctuations. It is possible to compare Avax's price movements to the slow and long movements of a ship. If we look at the chart, daily SMA20 is passing around $19. We cannot say that the decline is over unless we see consecutive day closings above this level. The sequential targets above are marked on the chart. If the decline continues, bottoms may form in the $8 to $9 band. I don't think it will stay below this pricing. It may bounce up in the $12-13 range. The alt band of the channel line I marked on the chart is here. I believe in Avax's potential. The emergence of ETFs will also be on the agenda. As a solid, down-to-earth altcoin, it can help us make a profit in a possible bull run. Crypto is an extremely risky market. It is best to stay away from futures. Opening a leveraged transaction is extremely risky even for Avax. It is not investment advice.
suleymankumyol
قدرت مرموز "نهنگ" در بازار ارز دیجیتال ROSE: راز حفظ قیمت چیست؟
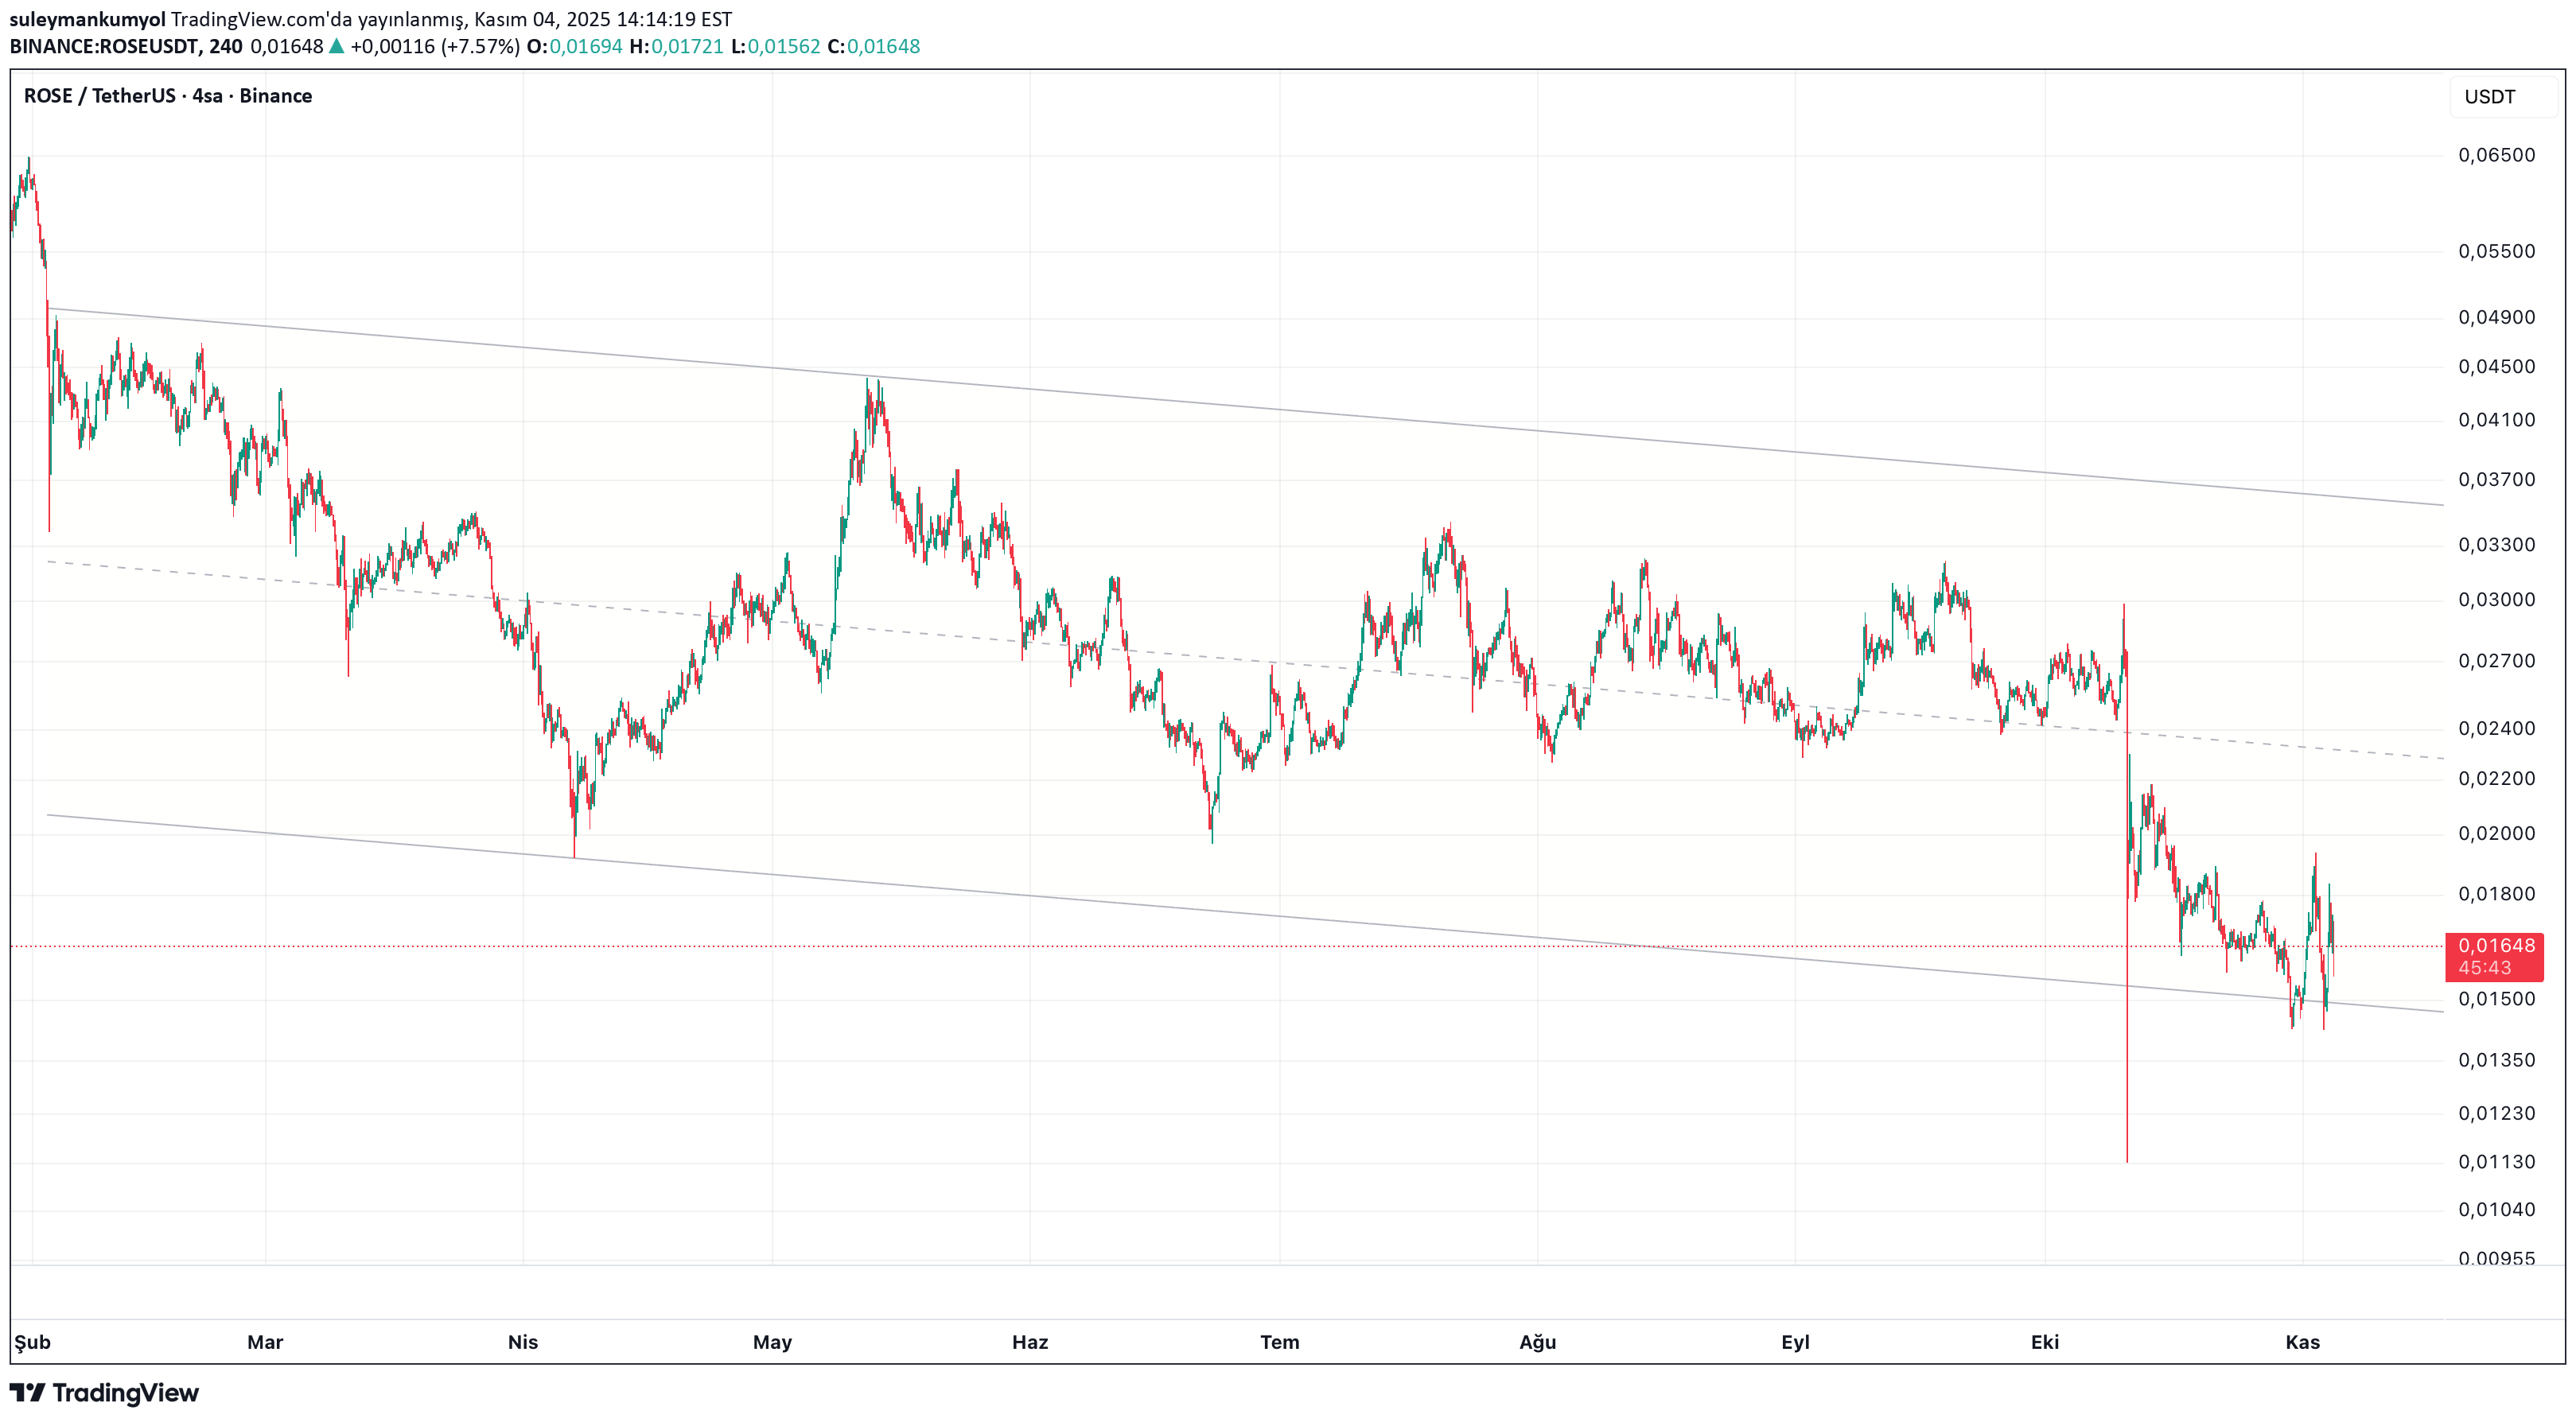
We understood that ROSEUSDT has a whale with its resistance today. The whale did not let it fall. Well done. The whale, which supported the alt band of the channel I tried to show in the chart, managed to keep ROSE up. It is not investment advice.
suleymankumyol
تحلیل کوین هوش مصنوعی FETUSDT: آیا زمان خرید فرا رسیده یا سقوط ادامه دارد؟
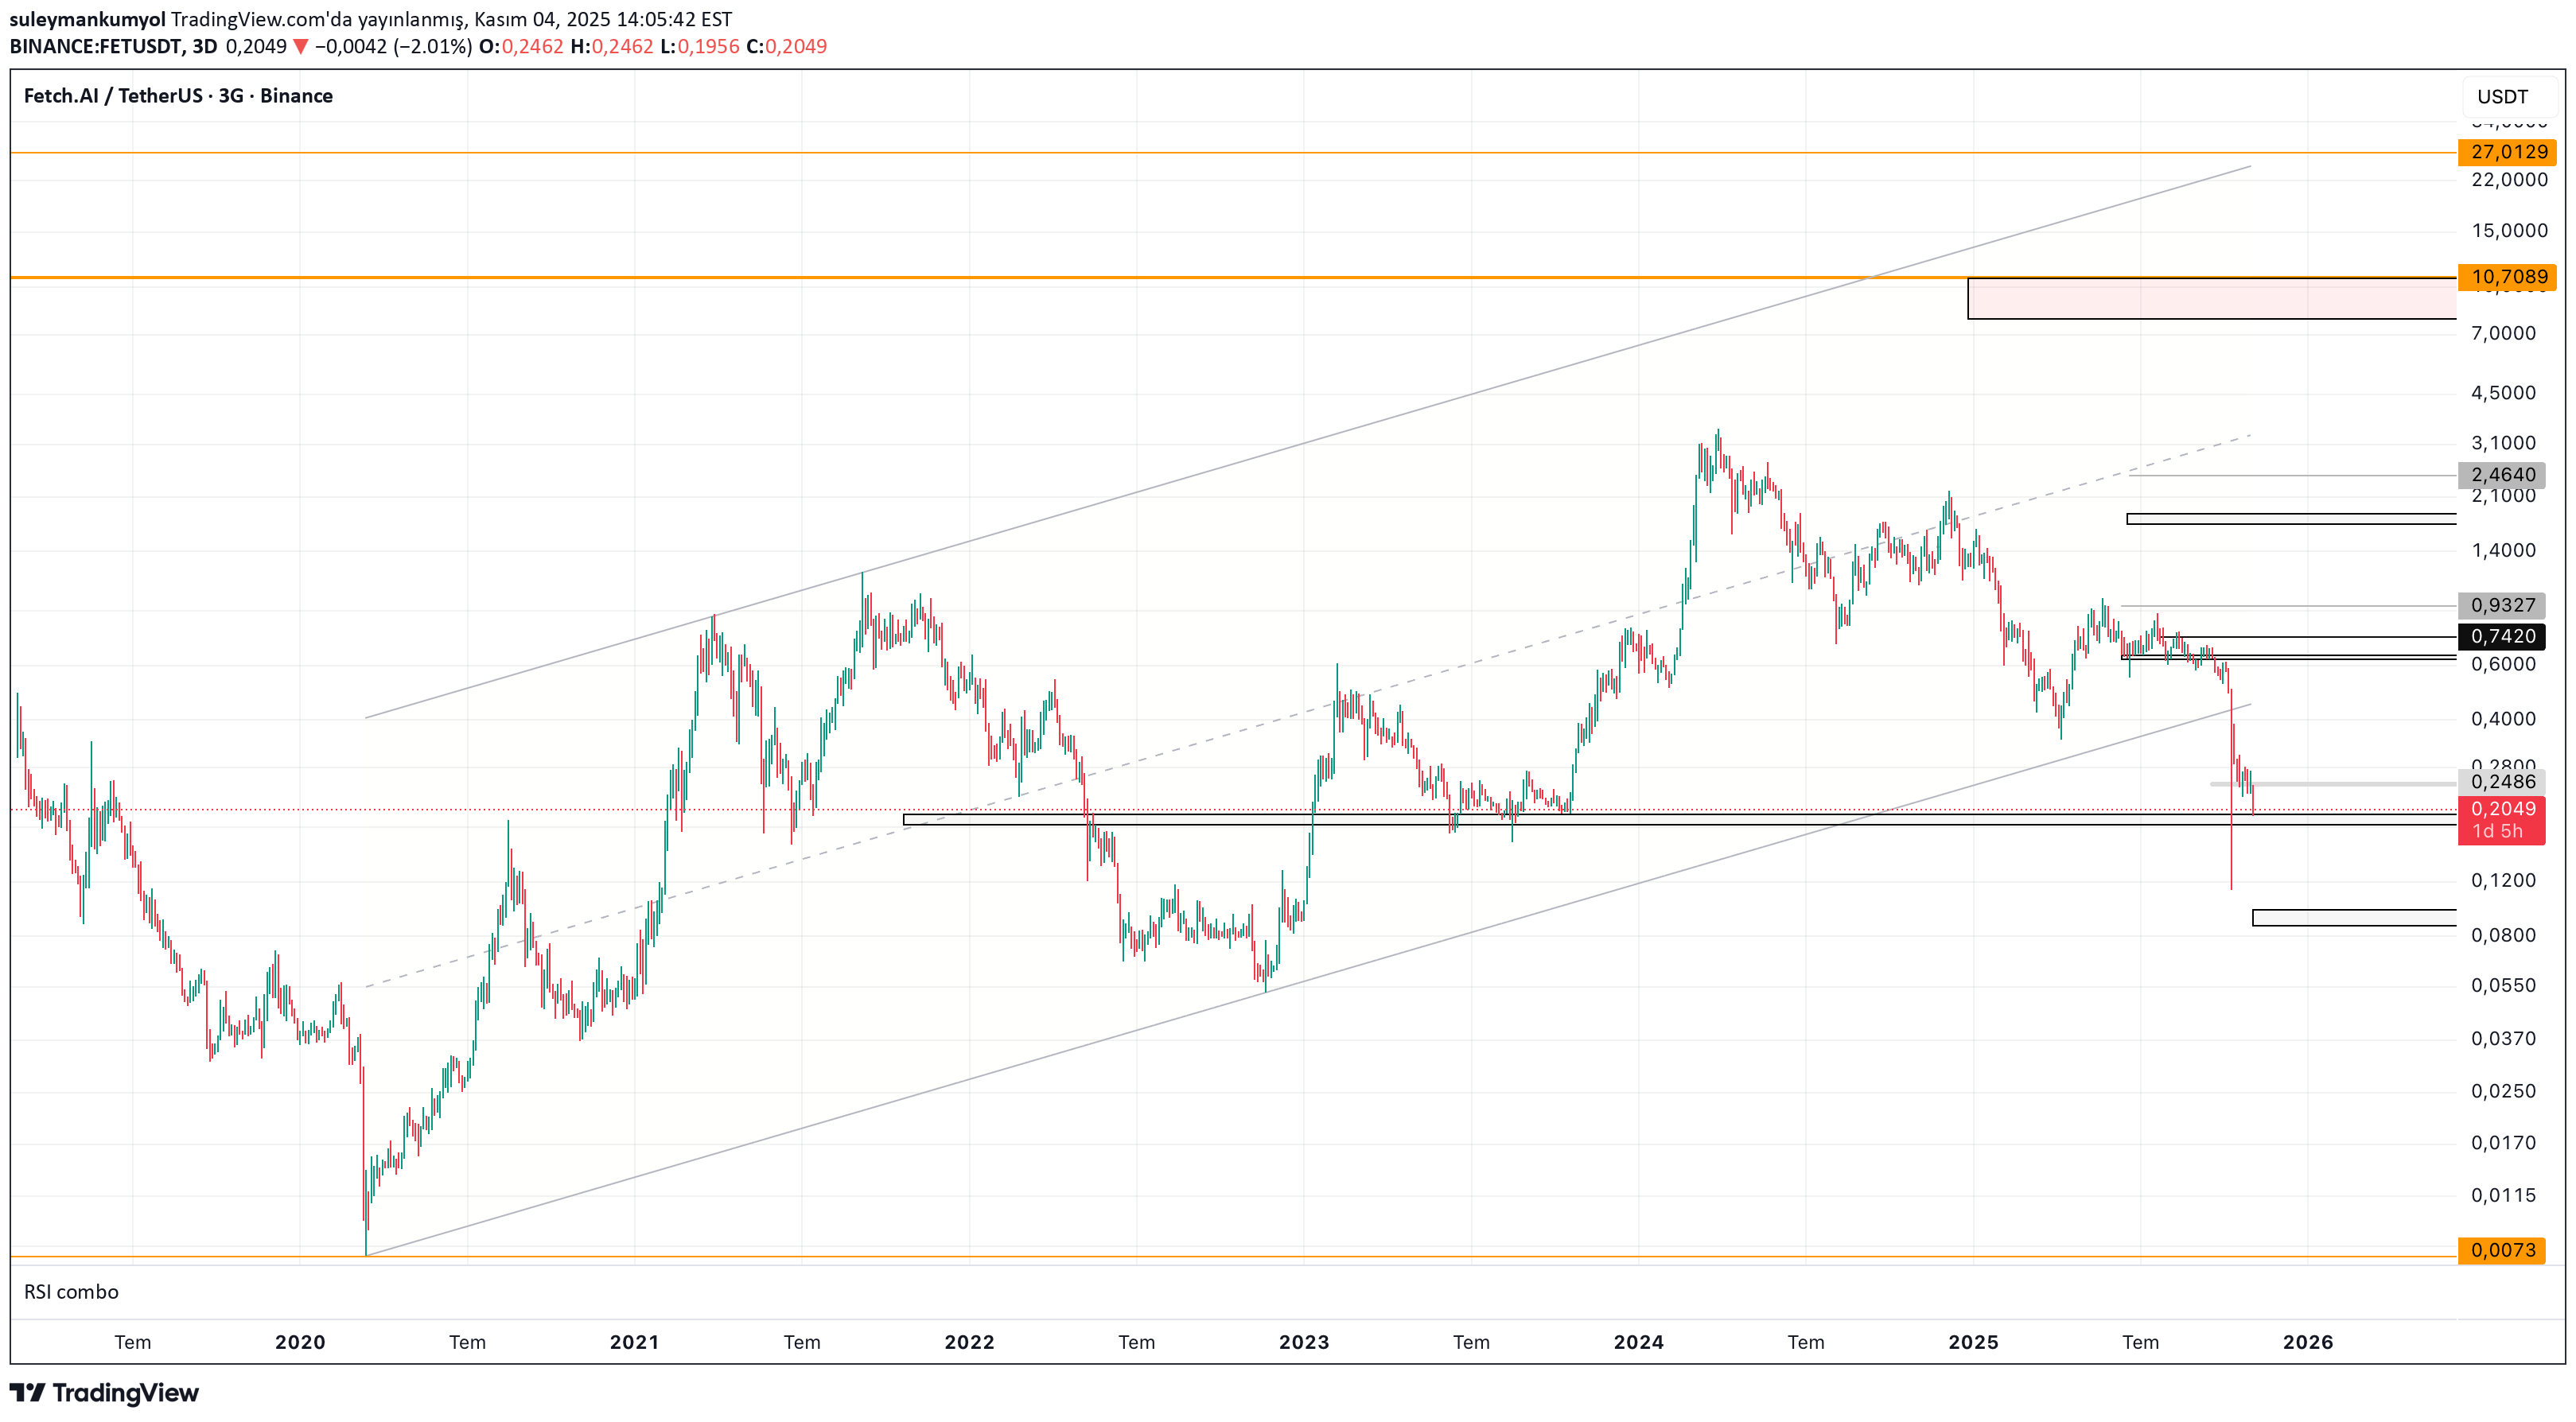
FETUSDT is an artificial intelligence coin that I like very much. But its recent performance has been deplorable. :( Without further ado, let's interpret the chart. 0.2486 daily SMA20. This coin cannot recover without being priced above this level. However, since it acts in harmony with the entire market, there is no need to worry about FET. The real recovery is when it throws itself into the channel I tried to show on the chart, that is, 0.47. $s It can be achieved by climbing the band. There is $0.08 below, but this is a marginal target. I think the decline will continue. But I predict that the final bottoms may occur in the $0.12-0.13 band. The market is so distorted that the technique doesn't work very well. It is possible to find the bottom regions by interpreting the BTC.D chart. Of course, indicators such as MACD can also be considered as a guide, but looking for a bottom is not the right attitude. I believe that FETUSDT may have serious potential in a possible bull run. It is not investment advice.
Disclaimer
Any content and materials included in Sahmeto's website and official communication channels are a compilation of personal opinions and analyses and are not binding. They do not constitute any recommendation for buying, selling, entering or exiting the stock market and cryptocurrency market. Also, all news and analyses included in the website and channels are merely republished information from official and unofficial domestic and foreign sources, and it is obvious that users of the said content are responsible for following up and ensuring the authenticity and accuracy of the materials. Therefore, while disclaiming responsibility, it is declared that the responsibility for any decision-making, action, and potential profit and loss in the capital market and cryptocurrency market lies with the trader.