Technical analysis by suleymankumyol about Symbol SNX on 11/8/2025

suleymankumyol
تحلیل SNX/USDT: آیا این کوین برای ترید مناسب است یا سرمایهگذاری؟ (بررسی سطوح کلیدی)
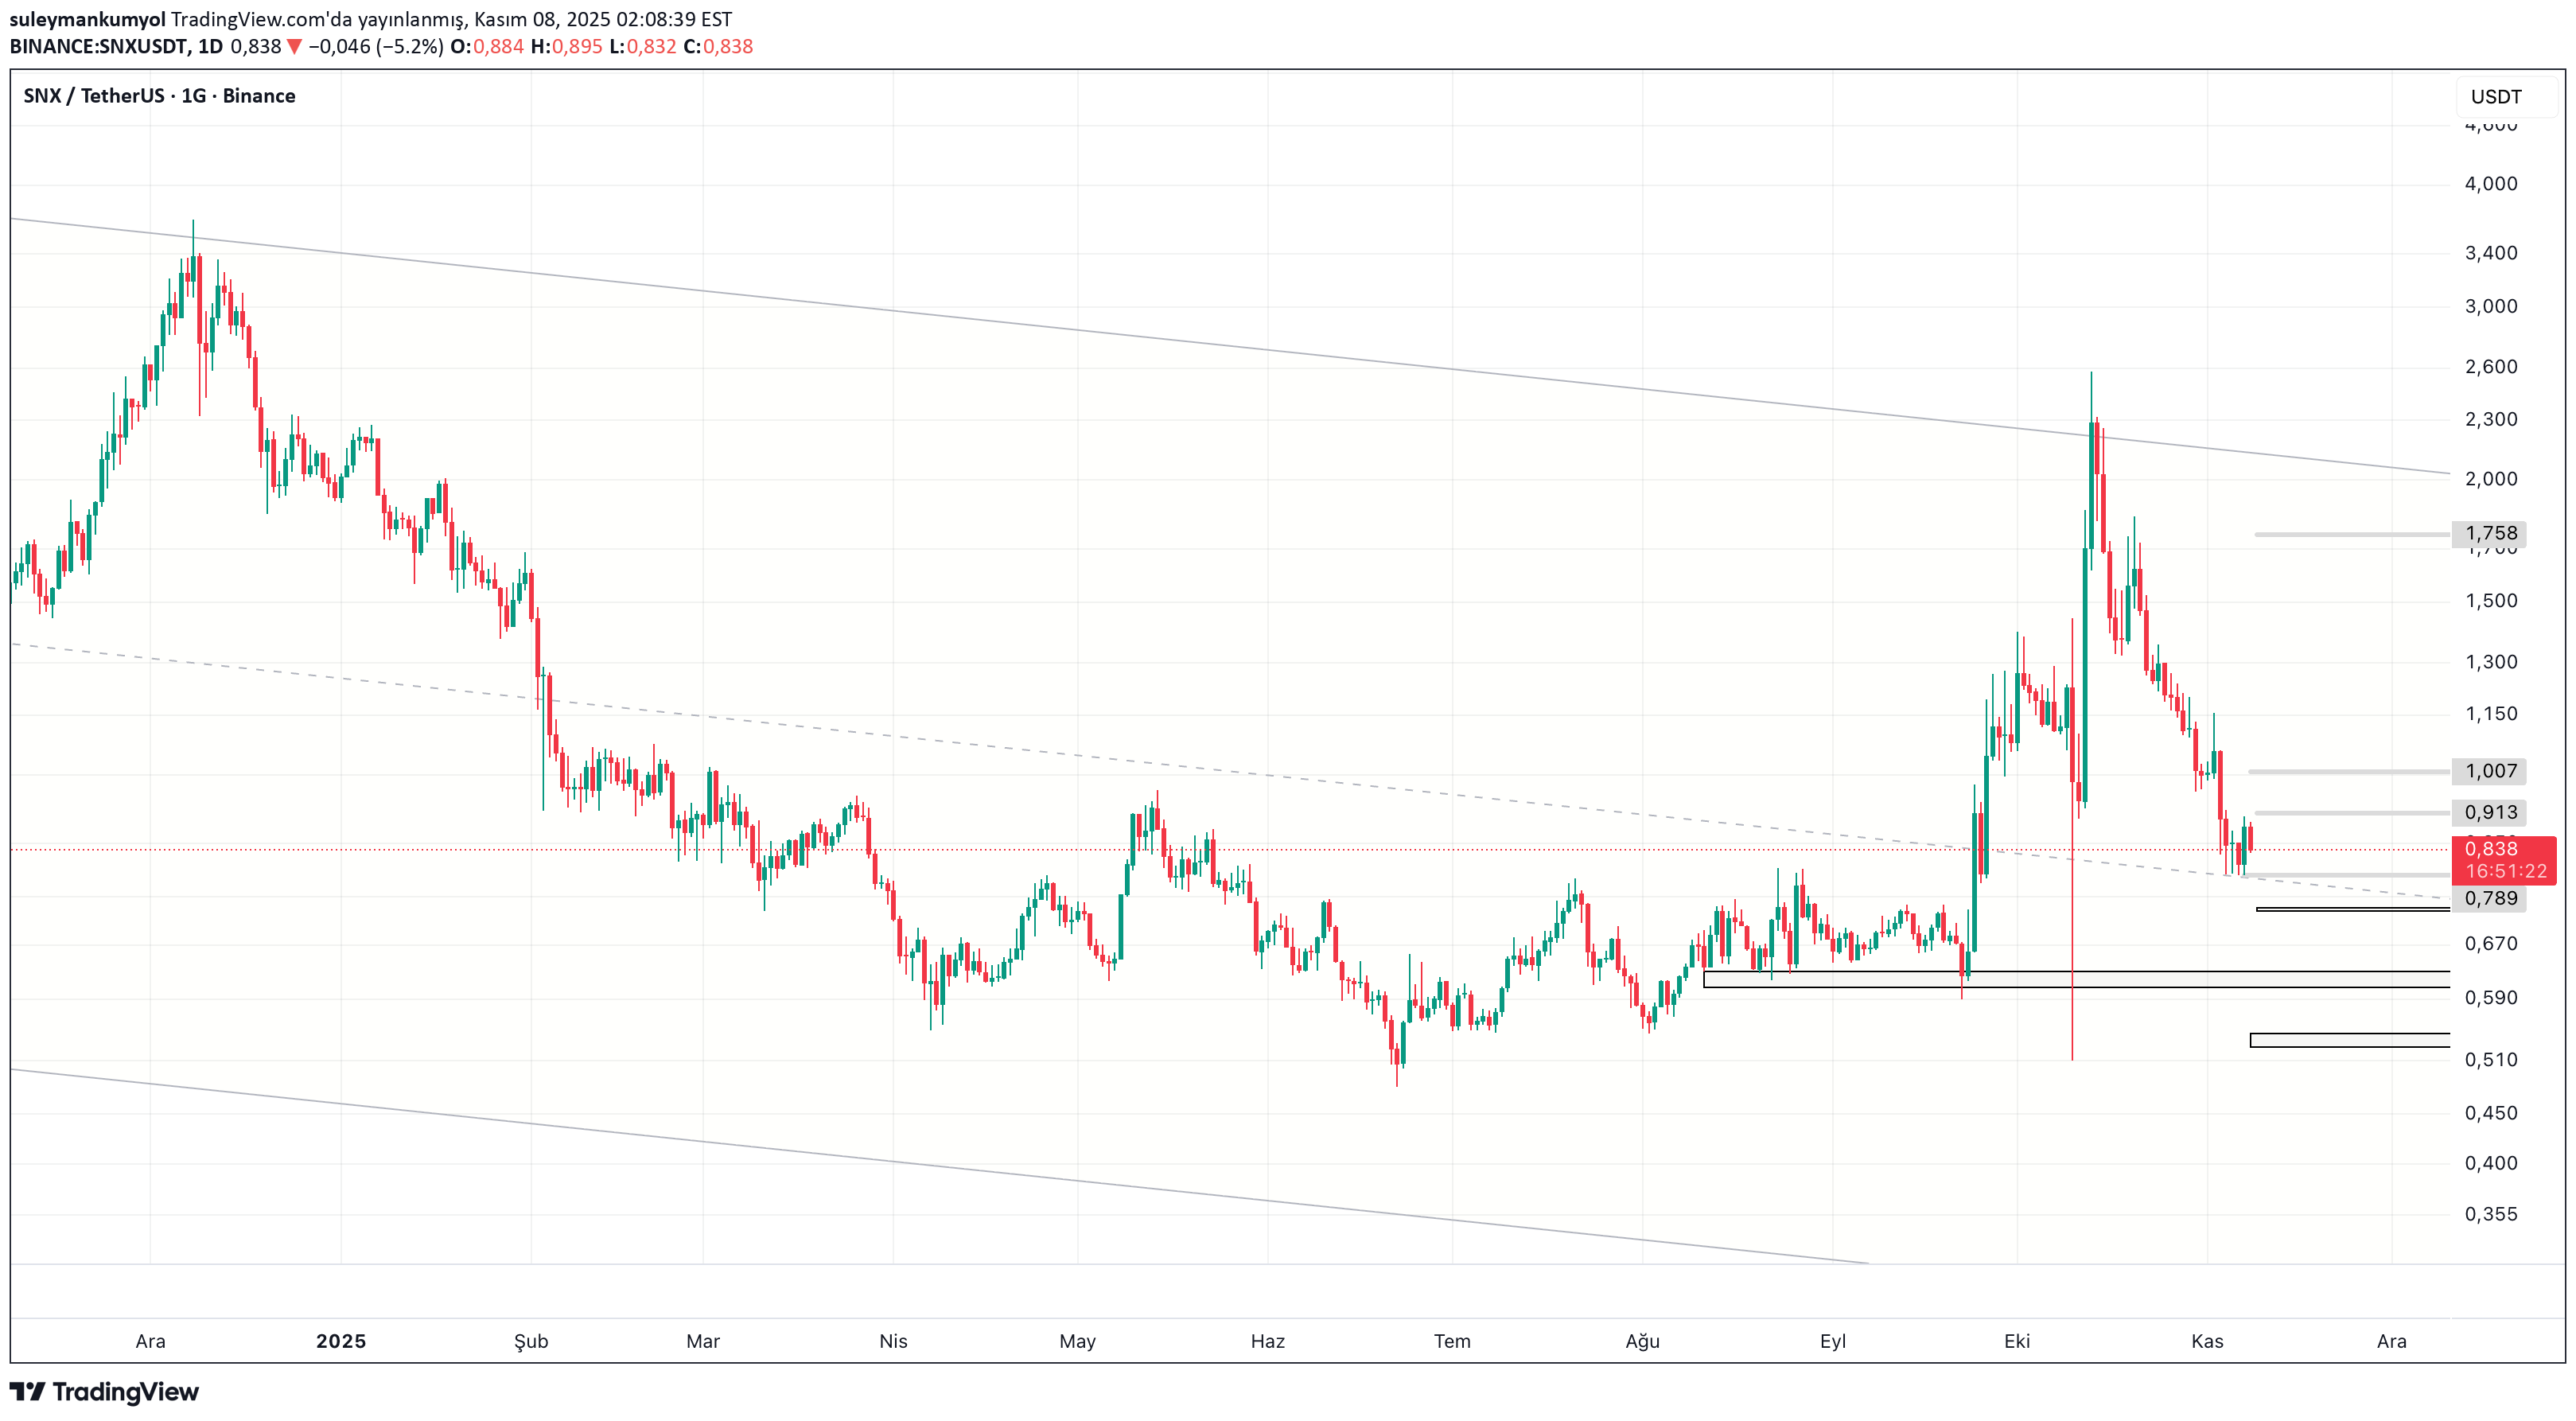
SNXUSDT Chart Commentary If I had to make a general evaluation; I think it is a coin that is more suitable for trading rather than including it in the portfolio. It has been continuing its movement within a large channel since '21. Although the chart I shared here only shows the last year, it is clearly seen that there is a channel movement, especially in the chart showing the weekly time frame. The enthusiastic movement that started on September 24, '25 carried SNXUSDT to the $2.3-2.4 line, which is the upper band of the channel. This big movement differed from the general situation of the market and caused SNXUSDT to diverge positively. However, before this big movement took place, it remained horizontal for about 5 months and accumulated, that is, it gained strength. In these types of coins, that is, coins that stand out from the market, the trader effect is still very high. In other words, price movement was achieved due to the push of traders rather than investors. For this reason, I do not include it in my portfolio, but I trade it. What I am telling you are my opinions. It does not contain investment advice. Let's talk about what the chart says. SNXUSDT has now supported the daily SMA200, that is, the $0.79 band. This line is also the middle line of the major channel, that is, a separating support. If serial day closings occur below the midline of the channel I showed in the chart, that is, if the day closes below this line for a few days, $0.63 and then the $0.52-0.55 band will work as support. If it falls below this, we need to re-evaluate. Before explaining the stops in a possible upward movement, I must say that SNX should do some horizontal pricing and gather strength. Additionally, a Death Cross has formed on the chart. On the daily, SMA20 crossed SMA 50 below. This is a situation caused by an extreme increase from the end of September to mid-October. But this indicator may keep investors away for a while. In other words, they may say that the coin has already made its move and do not prefer it. These are just comments. It could also be the opposite. But I think it will spend some time sideways and do whatever the market does. So I don't expect any drastic action. The above pricing will be as follows: There is daily SMA100 in the 0.913 band. A big rise will not start before passing this. After that there is $1.03. This will also be a nice stop. The upper band of the channel, that is, the $ 1.7-2 band, has served as resistance for about 5 years. So this place is like an impenetrable castle. If this resistance is broken in a possible bull run, extremely high and surprising prices will occur. I'm adding this as an extra comment. It is not investment advice. I wish everyone good luck.