
shakatrade1_618
@t_shakatrade1_618

What symbols does the trader recommend buying?
Purchase History
پیام های تریدر
Filter
shakatrade1_618
ETH Loaded: One More High or Bull Trap?
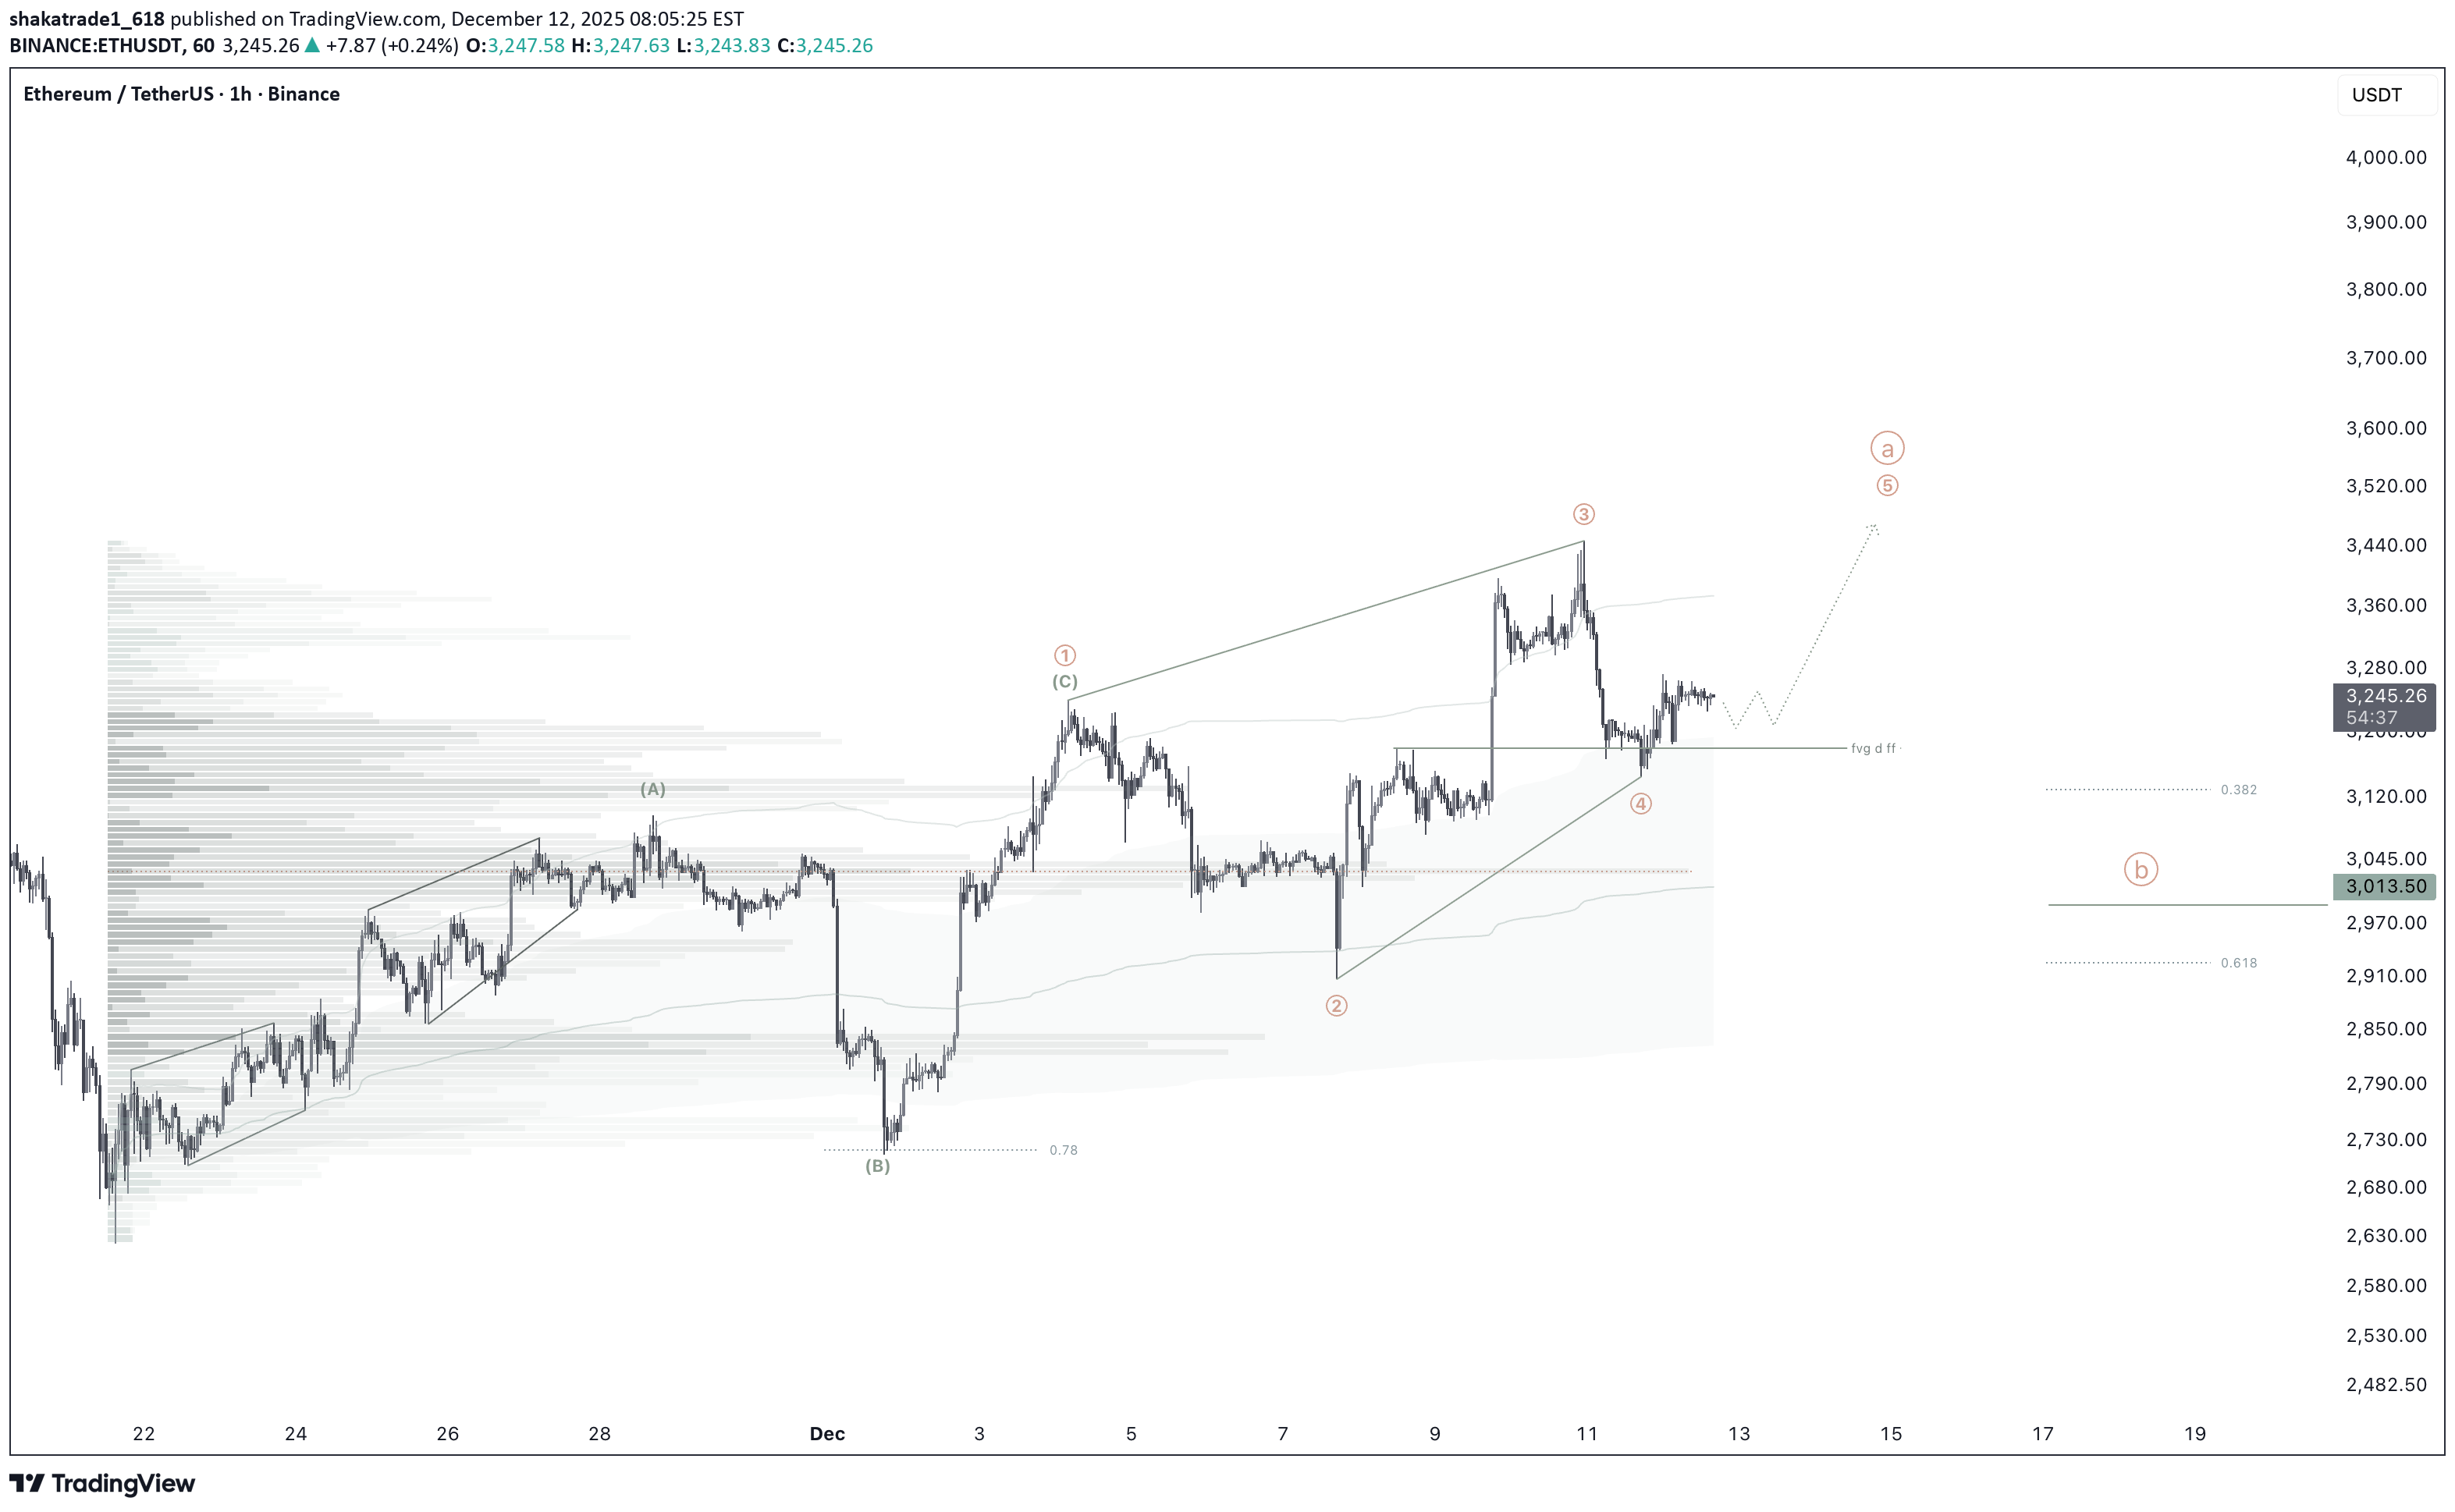
ETHUSDT ETHUSD recent price action strongly resembles an leading diagonal: the structure is stretched, but the local price action remains bullish. The market is currently trading between the Q1 and Q2 VWAP bands, which supports the idea of another upward push. If the scenario is correct, ETH should take out the previous local high around 3,446 and deliver a final upside burst into the 3,400–3,450 zone in the near term. Invalidation: a break below the 3,145 local low. This would negate the diagonal structure and require a reassessment of the bullish outlook.
shakatrade1_618
آخرین فرصت برای خروج از بازار طلا: تحلیل دقیق قیمت و سطوح مهم ورود و خروج
The last forecast rode the upside nicely. Now we’re getting local setups. Near term, I expect a return to $4,115–$4,186, with a preferred target at $4,160. The decline reads as a zigzag (with a triangle in the middle), so I’m looking for a rebound into that range. More soon.As planned.Done: 3,949 → 4,200. All targets hit. Now it gets interesting.
shakatrade1_618
سولانا (SOL): پایان صعود بزرگ یا سقوط به ۵۰ دلار؟
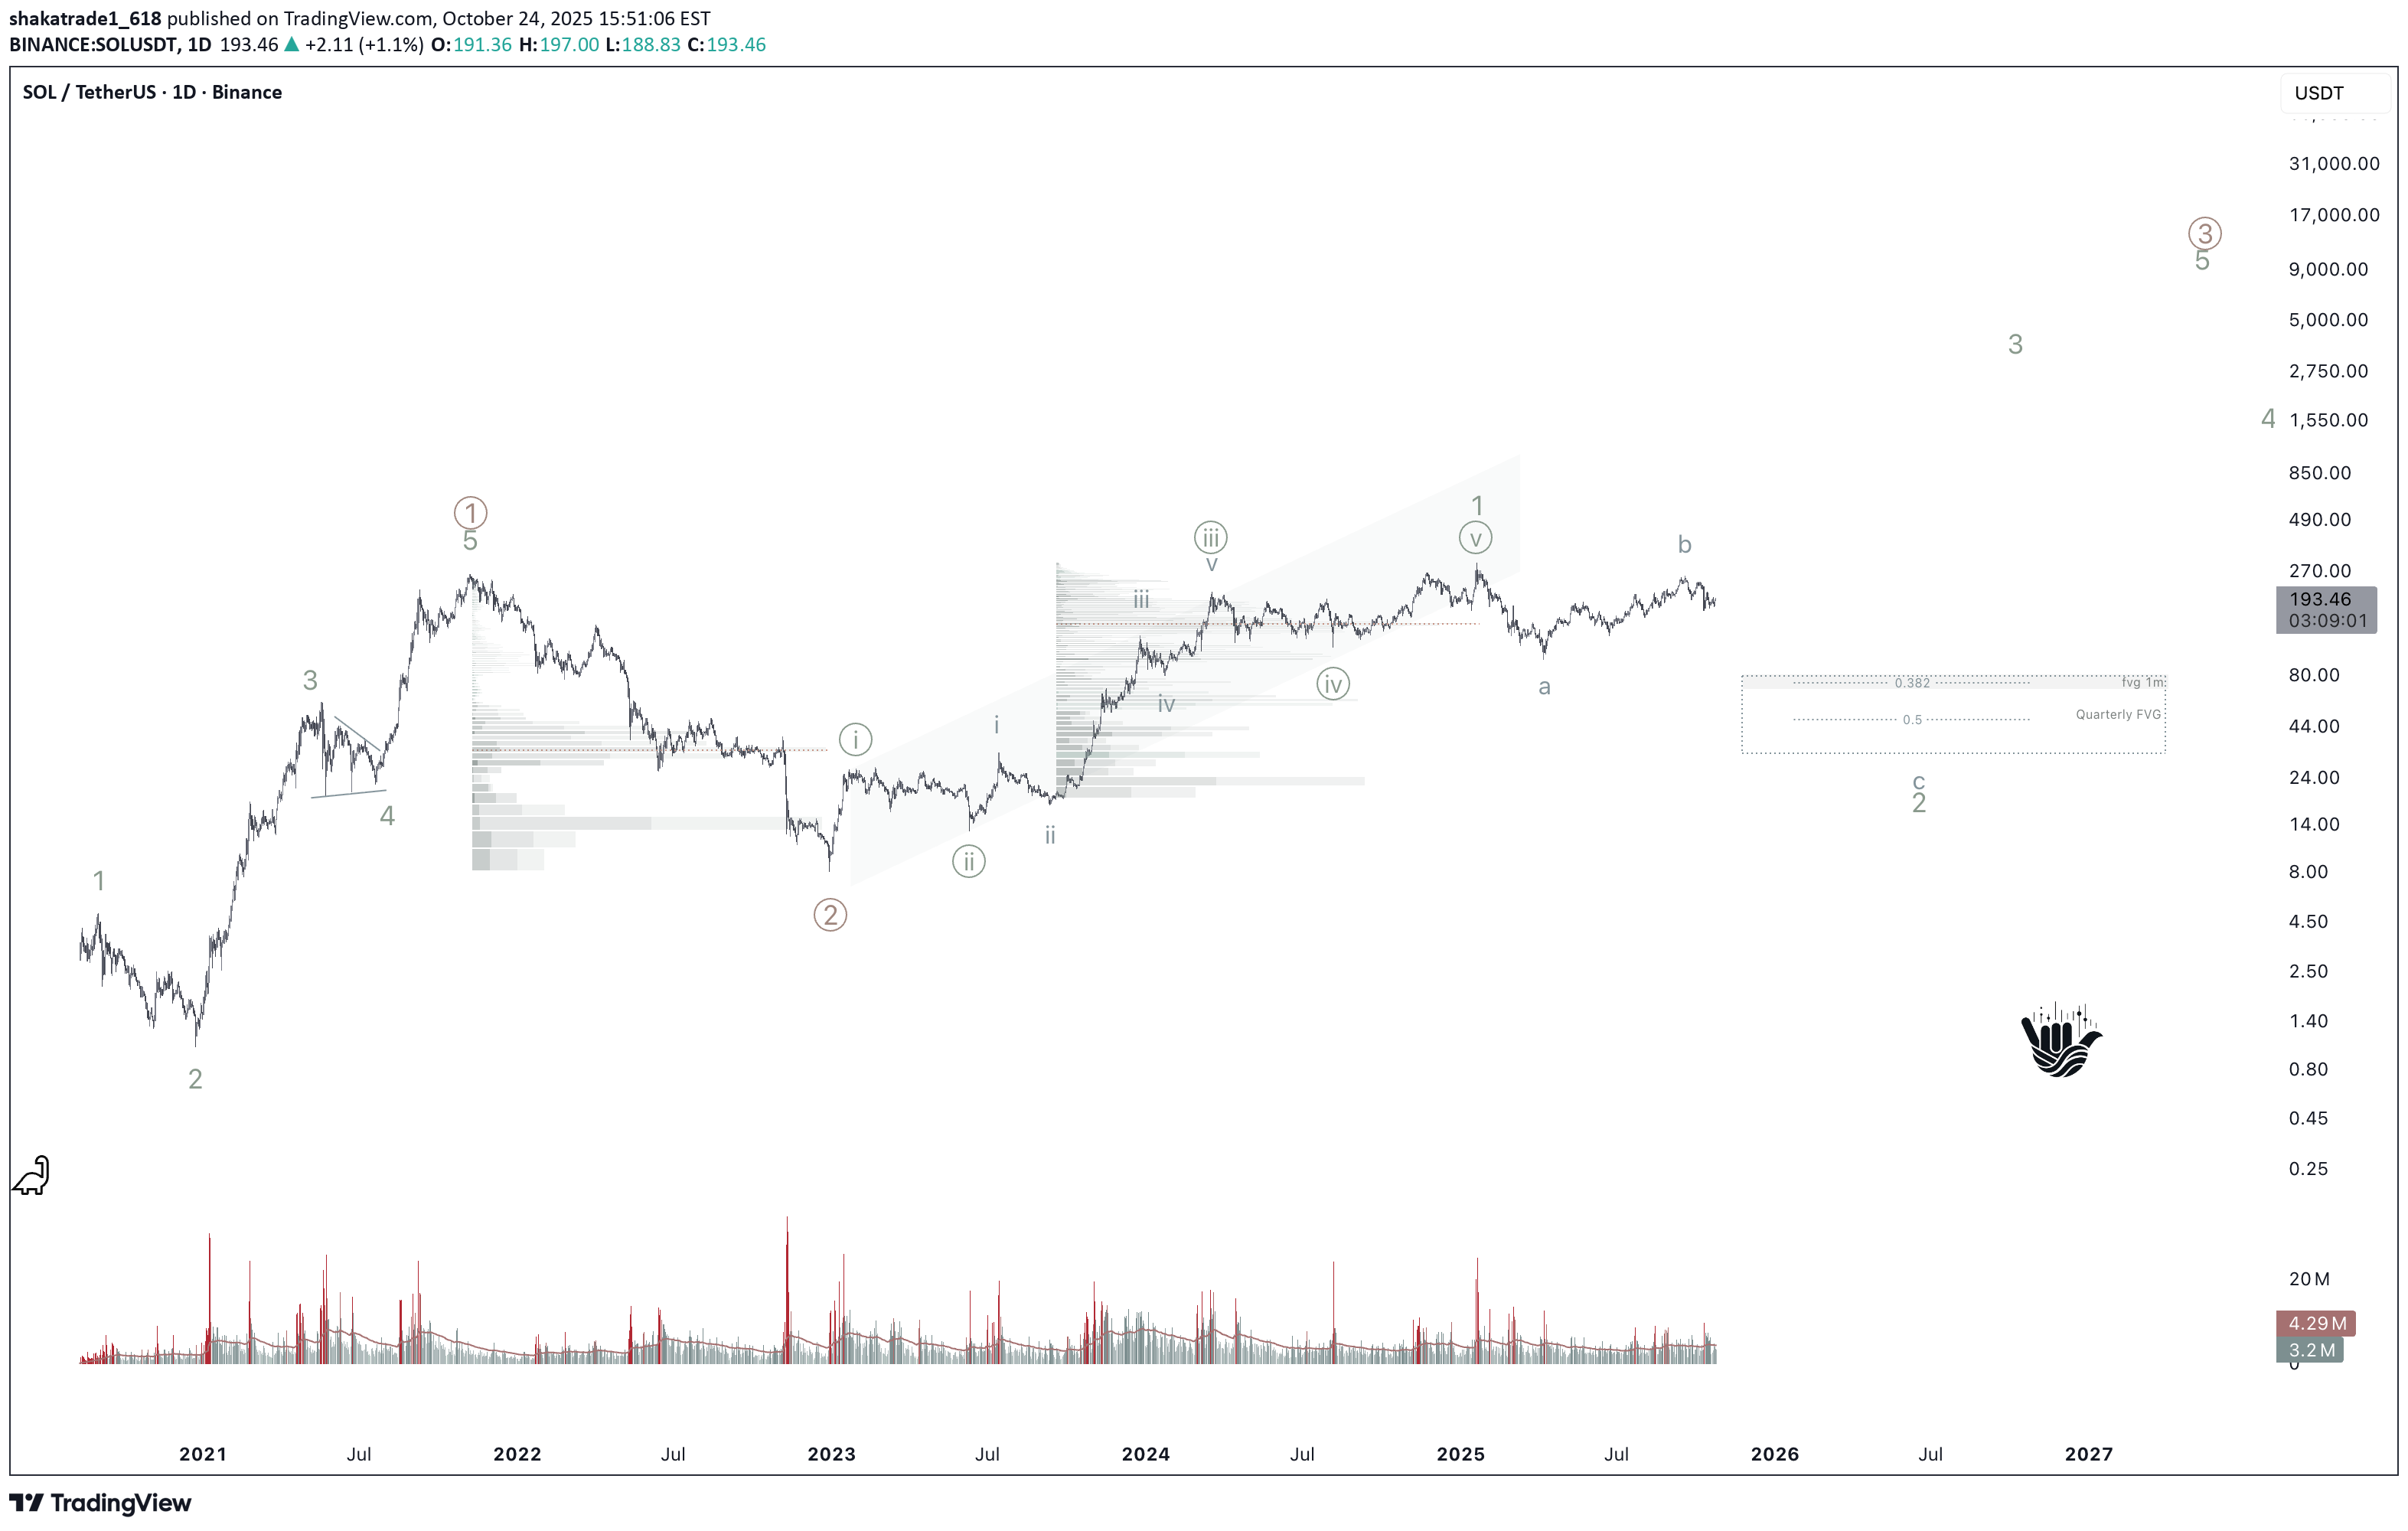
The Solana bull run that started in December 2022 most likely finished in January 2025. It was a textbook five-wave impulse (extended iii, with i ≈ v). From Jan → Apr 2025 we saw the first leg down (A), and the rally Apr → Sep was merely a corrective (B) move; base case is C down toward $80–50. An alternative allows for one more pop within B (even a small over-throw), but downside resumes after. Full cycle & proportions Dec ’22 → Jan ’25: clean 1–2–3–4–5. Wave 3 shows a classic extension. Waves 1 and 5 are nearly equal in length. The run from the bottom is roughly 30–35× (about +3,000%), which statistically argues for a meaningful mid-term correction. Base correction targets from the whole impulse: 0.382–0.5 Fib → $80–50, aligning with monthly/quarterly imbalances (FVG). What 2025 looked like Jan → Apr: first downward leg — wave A. Apr → Sep 18 (high ~$253): a double zigzag W–X–Y — typical wave B, not a new trend. Alternative (expanded flat, EFL) A: Jan → Apr 7 down. B: Apr → Sep as (A); now forming (B); then (C) up (a minor higher high is possible). After that, a larger C down into $80–50. Why I think the rally is done (market context) TOTAL and BTC likely trace end-phase bull structures (distribution/terminal patterns). Volume profile on SOLUSD : the heaviest trading sits around $120–200 (HVN/POC) — classic distribution; price often moves below POC afterwards. Price Action (weekly/monthly): $216–260 is a major resistance that launched the bear market back in Nov 2021. Repeated tests without a weekly/monthly hold above it argue against an immediate breakout. Fundamentals in two lines Why a correction now: cycle overextension, liquidity saturation near the top, sensitivity to DXY/real yields and risk-off in US indices. Why the long-term case survives: high throughput, latency improvements (e.g., Firedancer), growing DeFi/stablecoin/consumer activity. After leverage clears, SOLUSDT historically recovers with high beta. Levels & invalidation Base (correction) holds until we get a weekly close > $260–270. Downside waypoints: $150 → $120 → $95 → $80–50. Invalidation: sustained hold above $270 with expanding volume — I’d concede an early start of (3) without a deep (2). Bottom line. With high probability, SOL’s medium-term rally is over; we are in a corrective phase targeting $80–50. The long-term bullish story can resume later — but first the market likely needs to deflate.Reminder: if we consider a bullish case, it’s only as a flat. If BTC follows the base scenario (wrote about it here tradingview.com/chart/BTCUSDT/VWBWbbLh-This-Is-the-End-BTC-The-Last-Dance/), the odds are decent.
shakatrade1_618
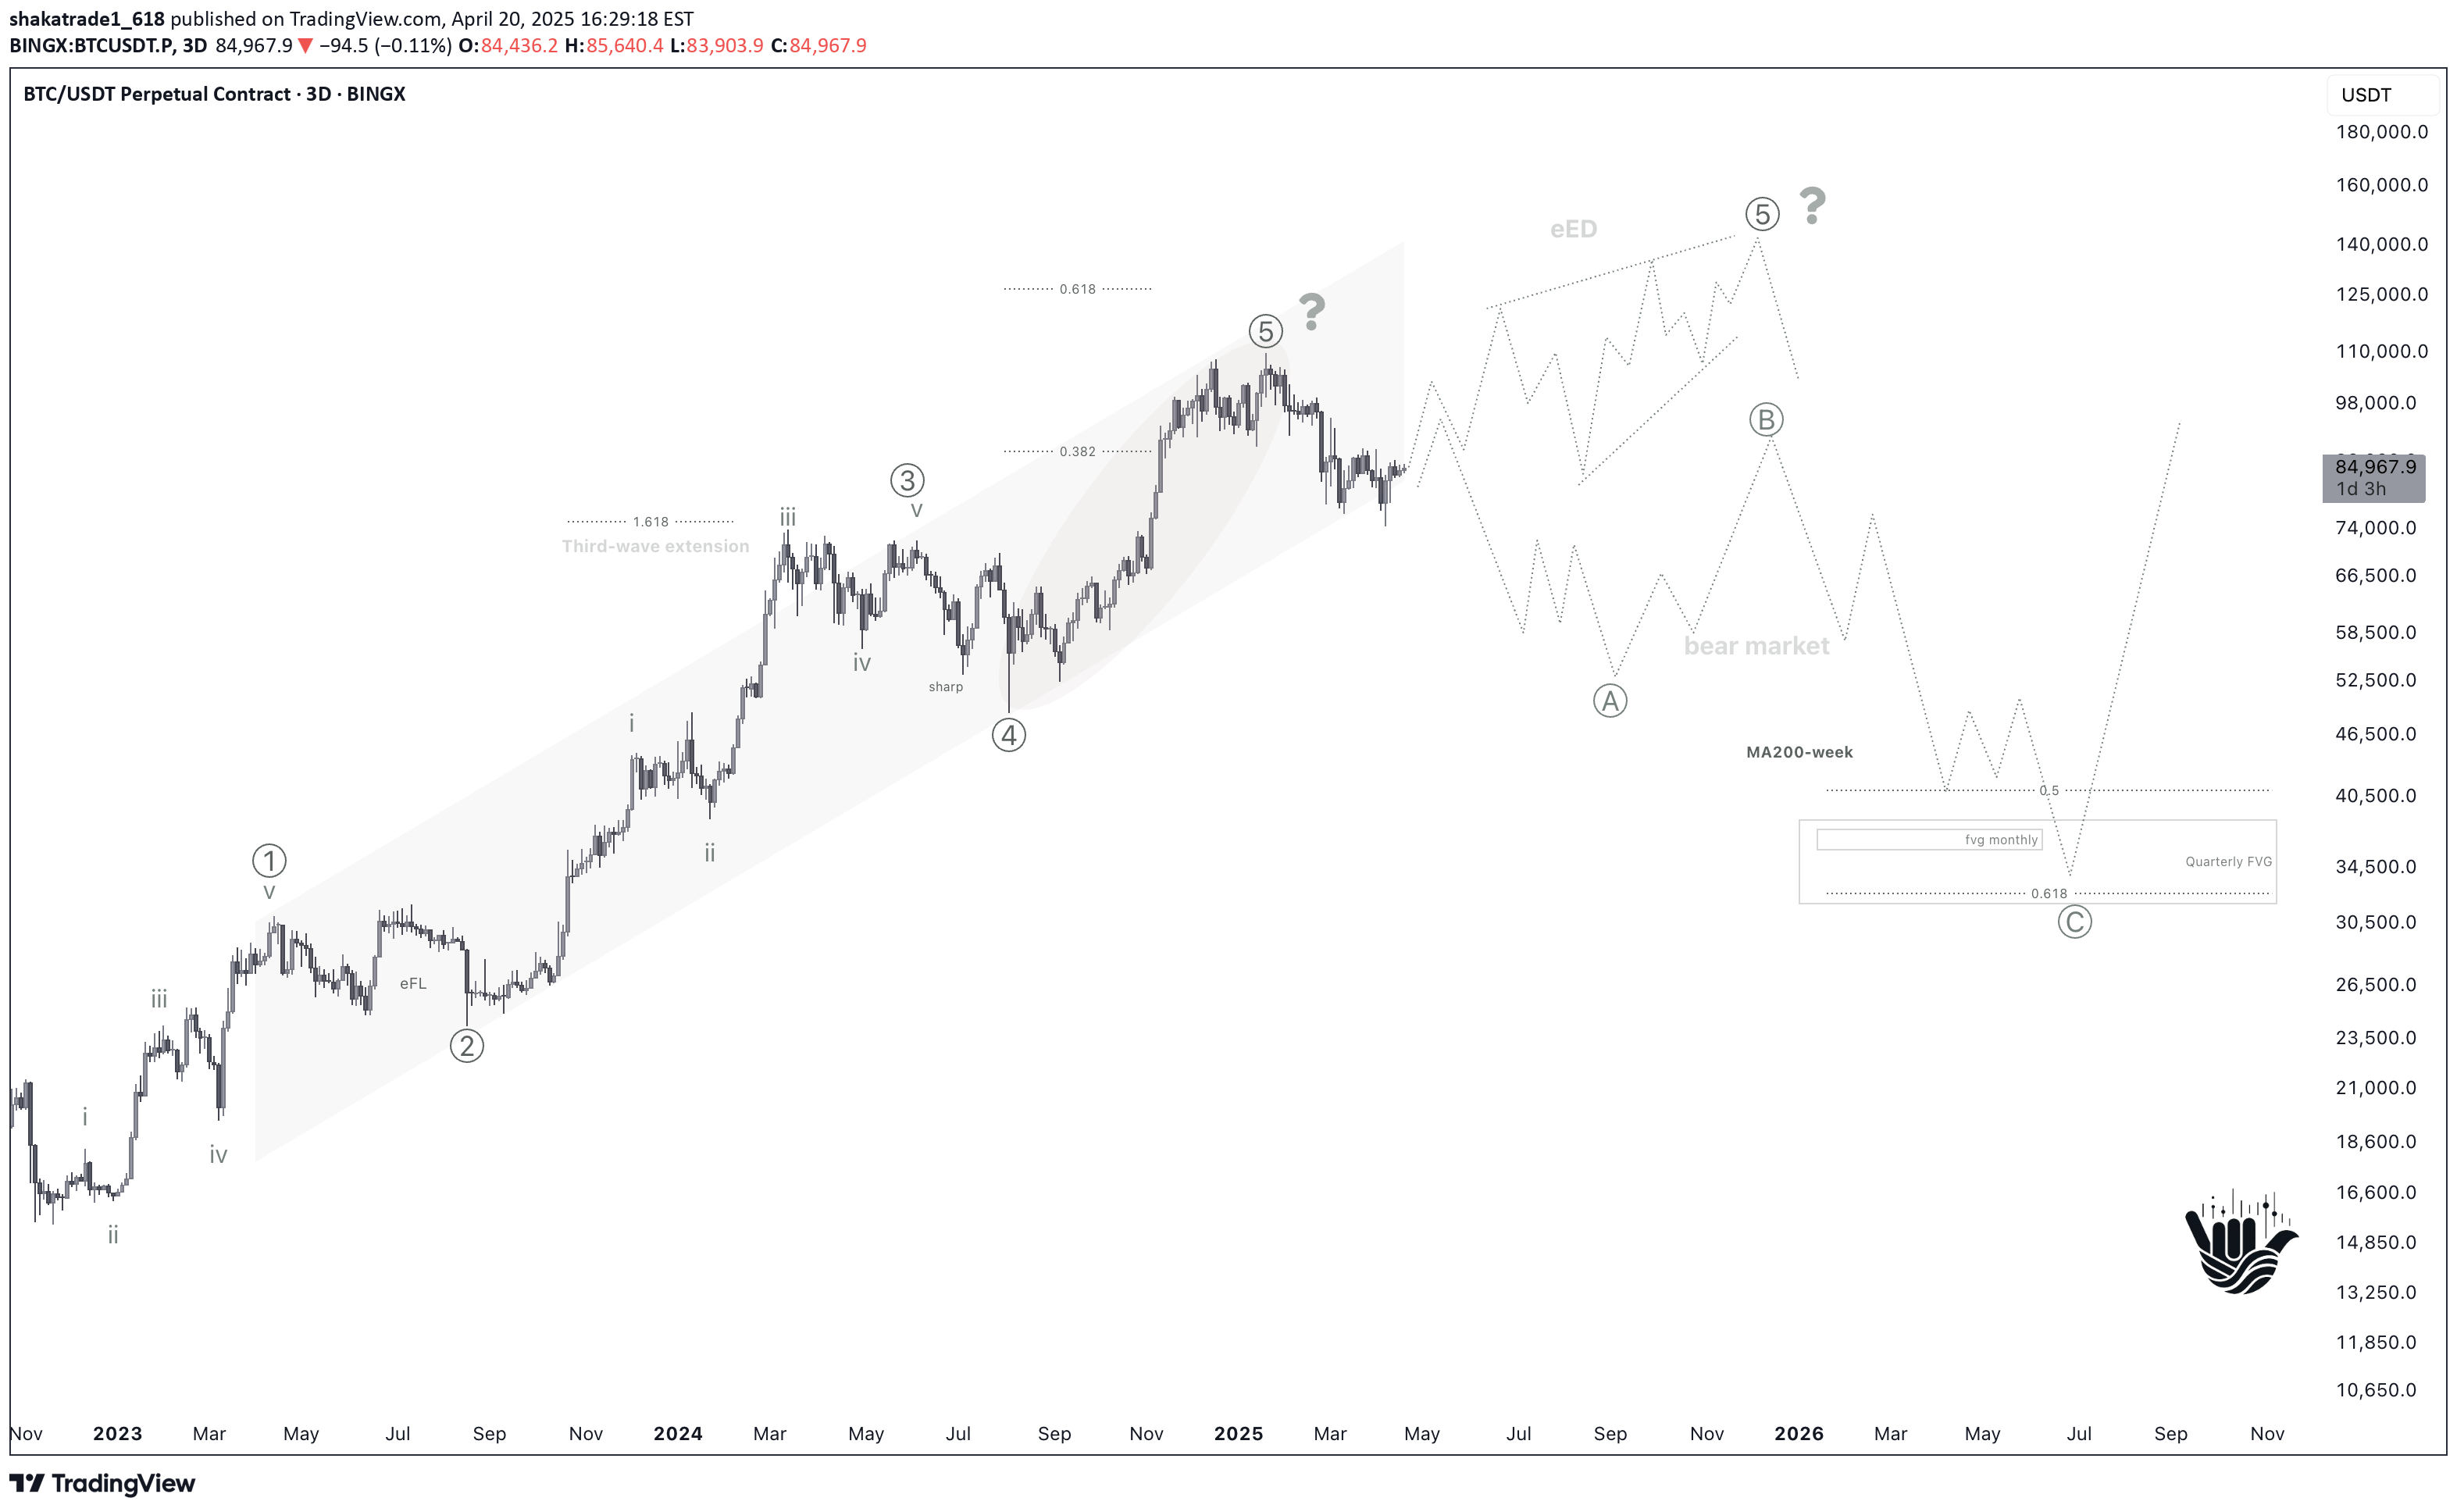
پایان حتمی بیت کوین؟ آخرین رقص هیجانانگیز یا اوج غیرمنتظره!
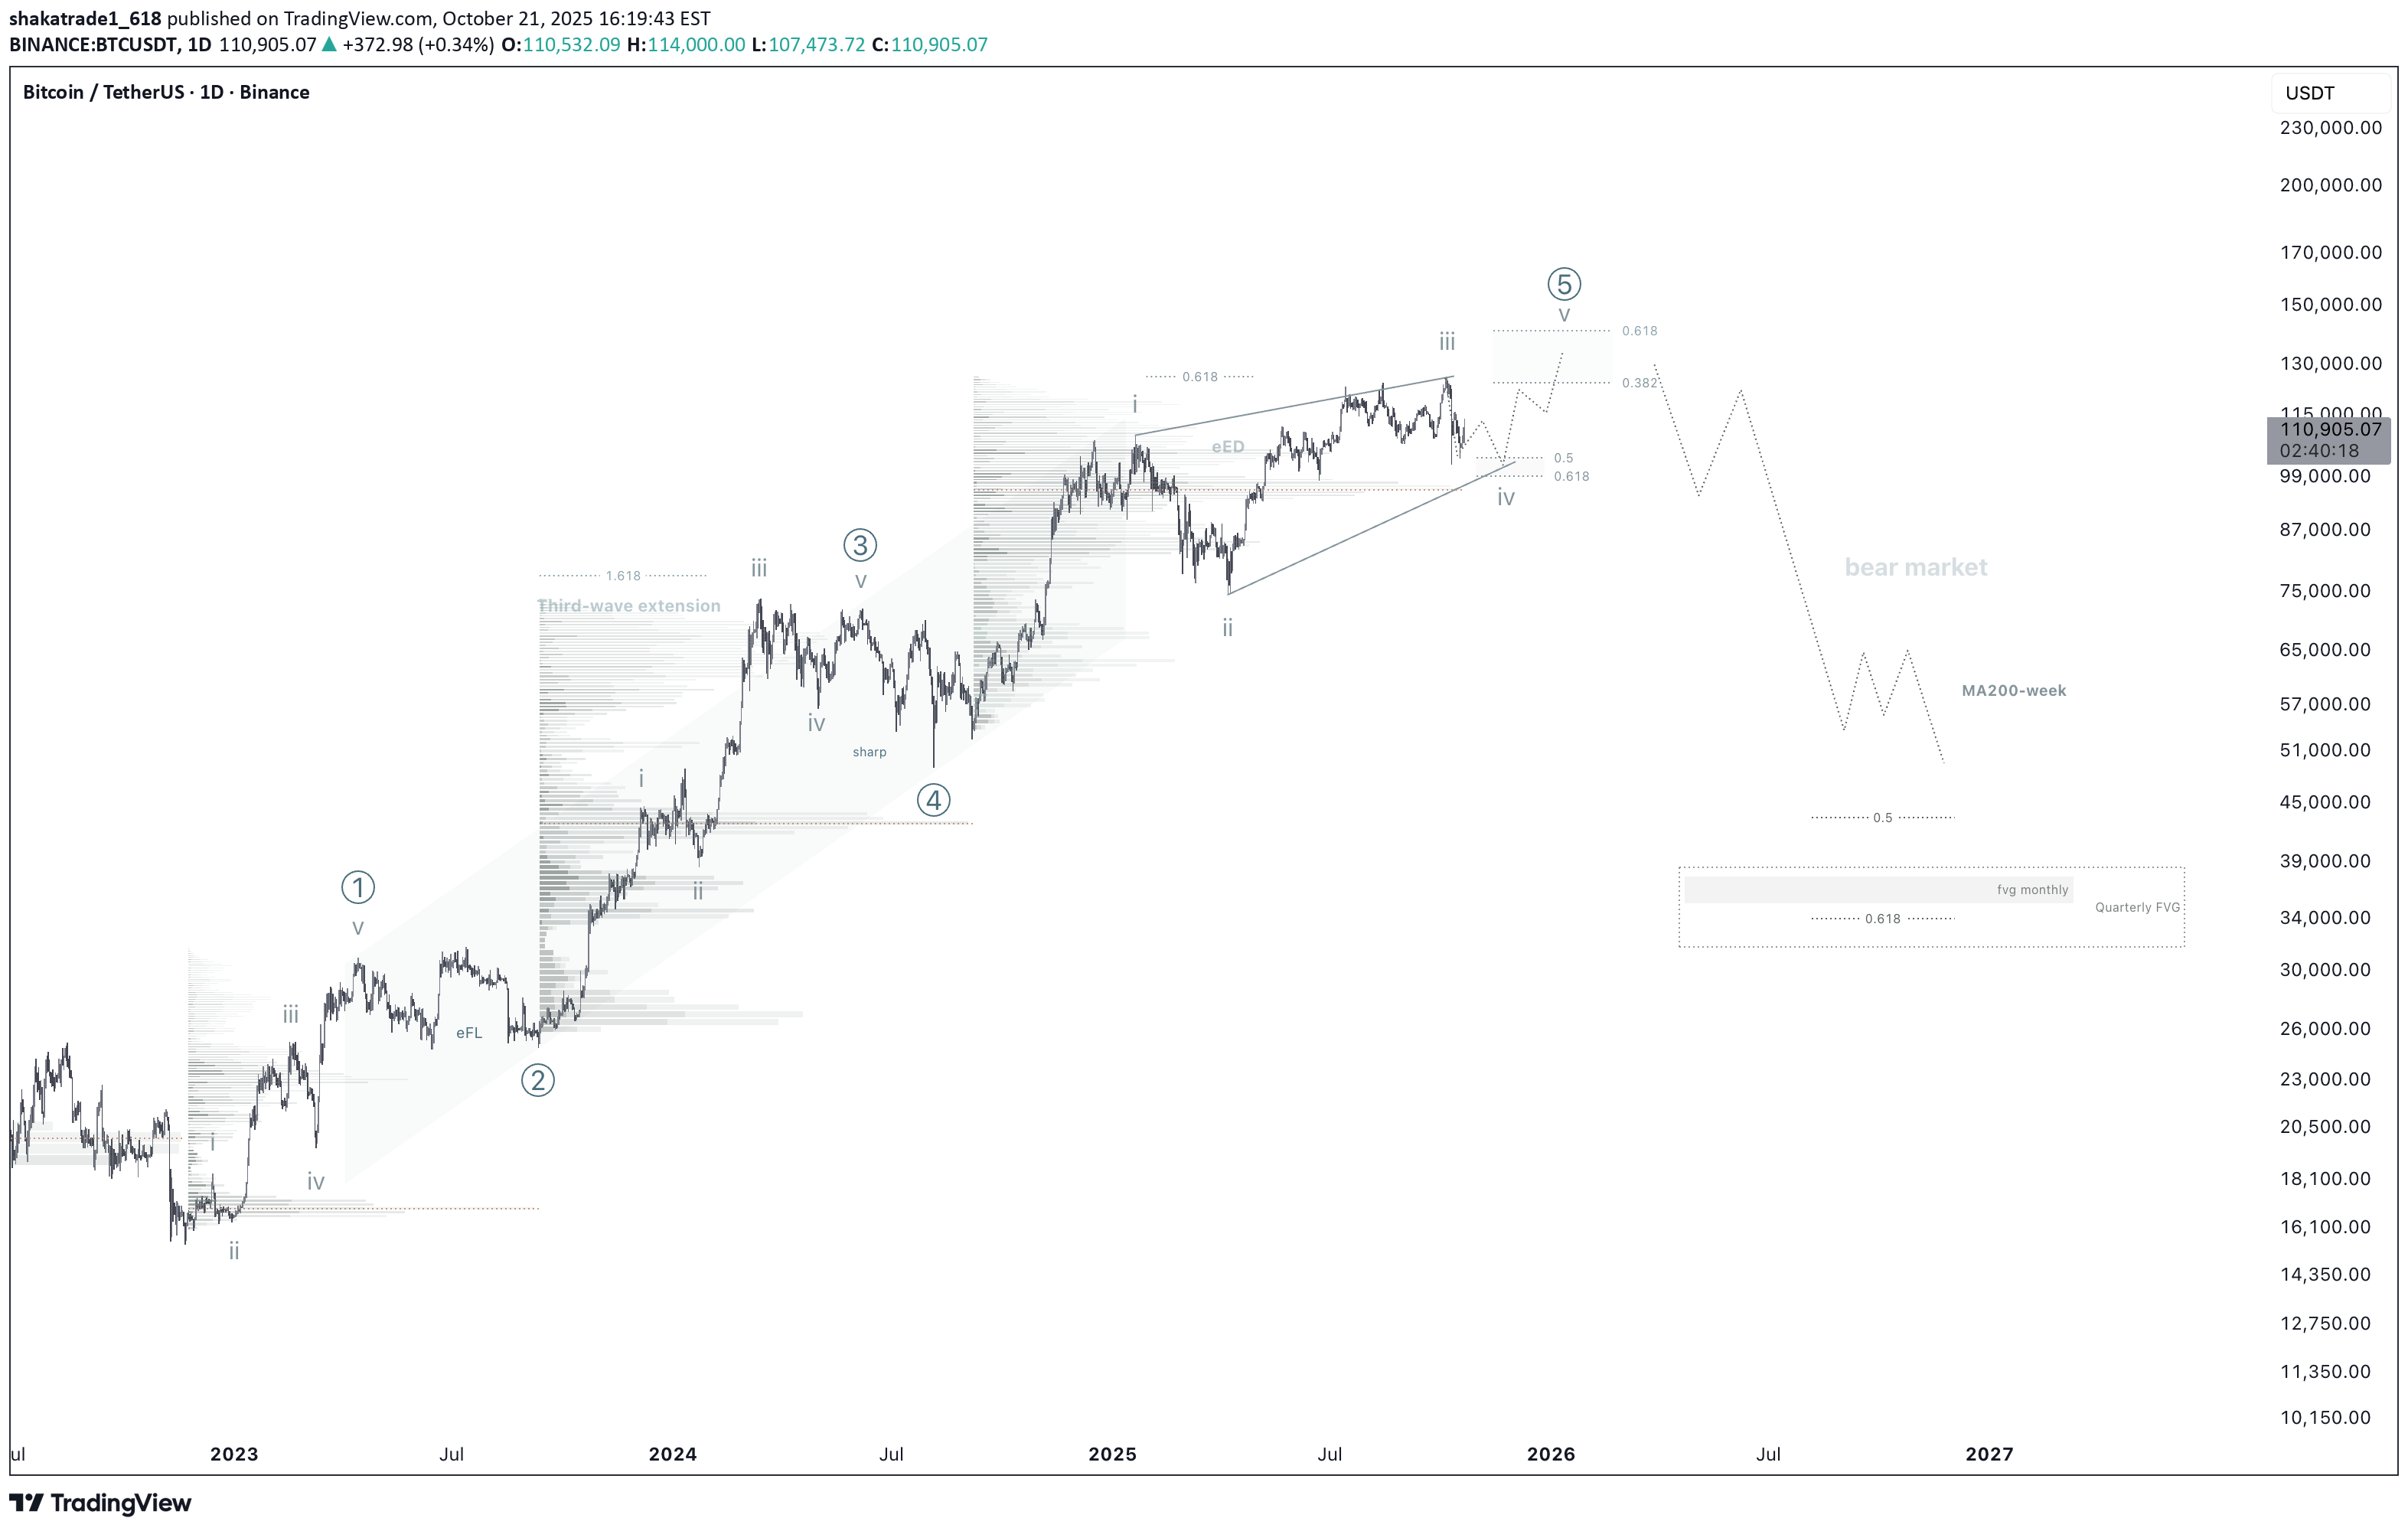
In my previous update , I laid out the case for this bull run to finish as a contracting ending diagonal (cED). That scenario now looks highly probable: the impulse is losing steam, and BTCUSDT BTC1! is struggling to clear new hurdles. Wave Count (1) — initial impulse. (2) — flat correction (expanded flat). (3) — sharp leg with a classic extension. (4) — sharp correction (zigzag), delivered a strong pullback. (5) — finishing as a terminal diagonal (cED): inside it we already have 1–2–3; next up is wave 4 of the diagonal, then the final wave 5 (could be truncated or a minor over-throw). Working zones: wave 4 completion at 98–105k; final push target at 120–140k (I don’t expect materially higher). What It Means The impulse is fading: volume profile is clustered near the highs, the wedge is tightening, and there was no V-shaped recovery after the last dump. Base plan — take time to finish wave 4 → one last wave 5 pop → end of the bull market. Alternative (important) Let’s be honest: the top may already be in. BTCUSD has failed at ~125k twice, and every time price gets above 120k, seller pressure becomes heavy. It’s quite plausible the wedge already completed and the peak is behind us. Bottom line. Base case: one more breath up within the ending diagonal; alternative: the top is done. Either way, bulls should stay on guard — the 120+ area is where risk rises and partial profit-taking makes sense.Base scenario unchanged — wave 4 of an ending diagonal. We’ve landed right in the 0.618 zone of wave 2. By the way, wave 3 ≈ 0.618 of wave 1. Looks almost picture-perfect, but nothing’s ever perfect—so keep the bearish alternative in mind :)
shakatrade1_618
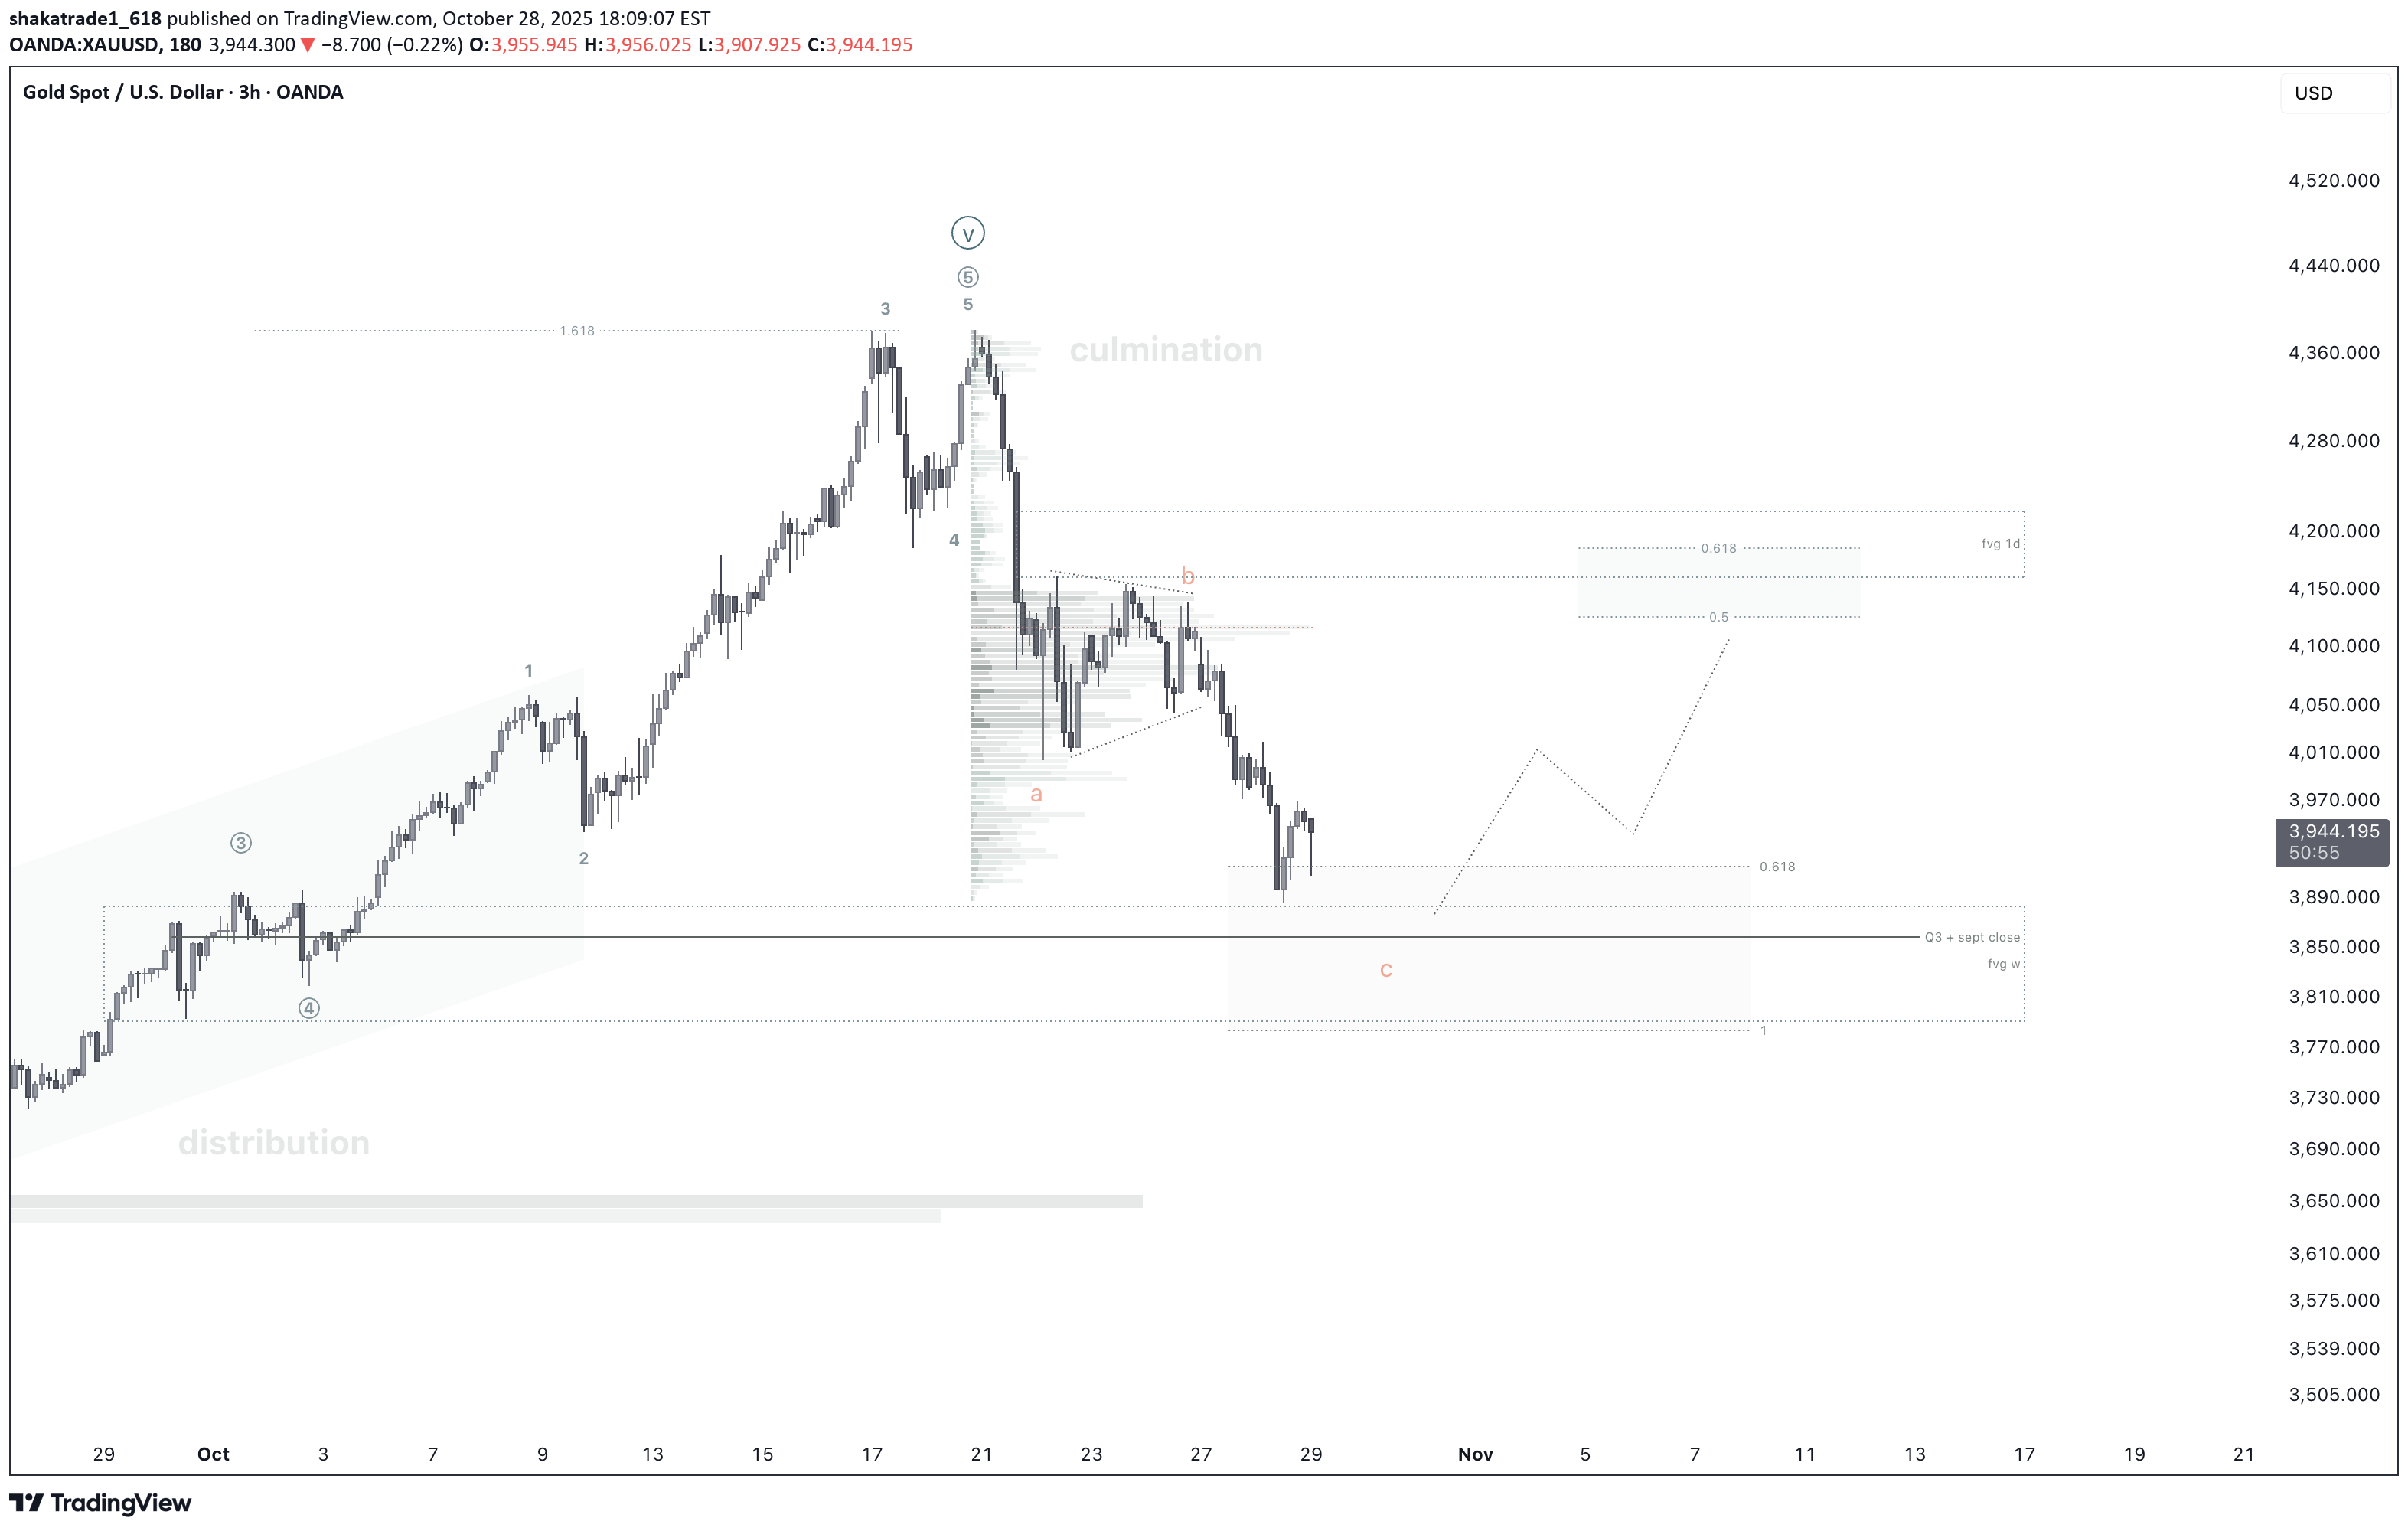
Gold Enters a Turbulent Phase
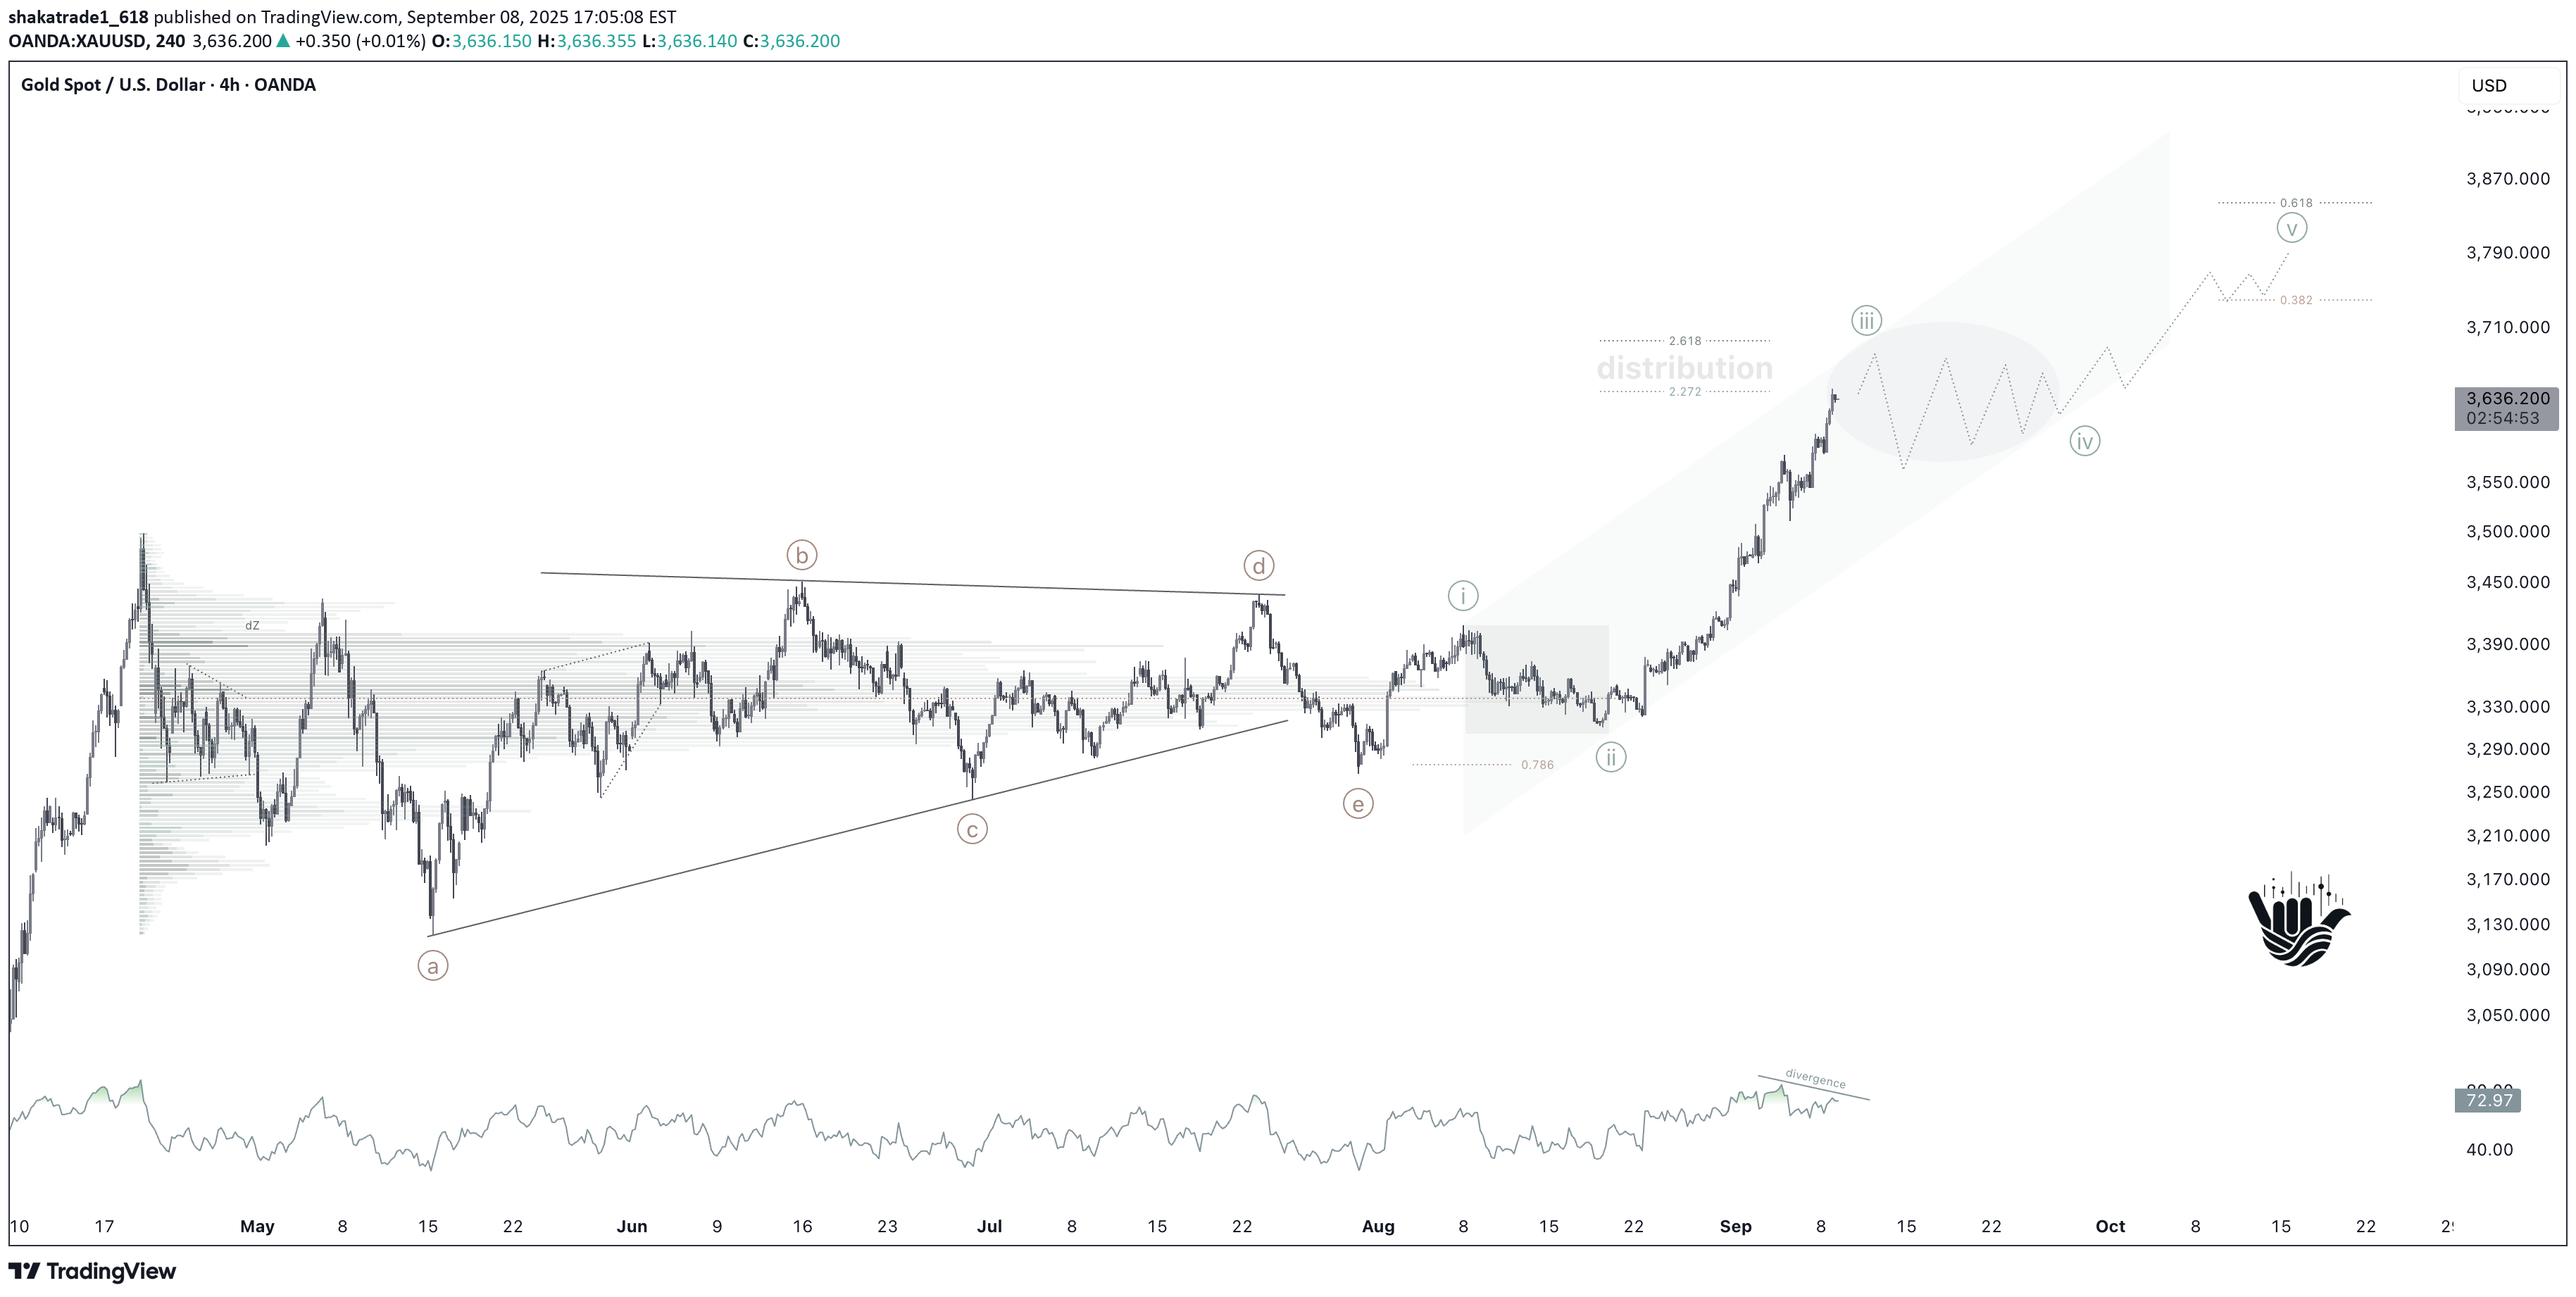
In my previous analysis , I noted that XAUUSD GC1! MGC1! was preparing to break out of a prolonged re-accumulation phase (April–August 2025). This scenario has played out: the market confidently broke above the upper boundaries of the range. At the moment, the price is most likely completing wave 3 of the impulse, which has shown a classic extension (~2.618 of wave 1). Next, I expect a correction in the form of a triangle or a flat correction (lasting 2–3 weeks). During this period, the volume accumulated below will be redistributed, followed by one more final upside climax. The local wave count may look like this:Base case: the 1–5 impulse is likely complete (or in its terminal stretch). We could still print an ending diagonal for wave ⑤, but this looks like terminal price action. Next: broad range/correction (structurally a higher-degree wave 4) with elevated volatility.Gold has met the targets and looks extremely overheated. By my count, the fifth impulse wave is finishing. On 12H there’s a strong bearish divergence — quite significant in scale. This looks like an obvious culmination. I’m watching closely for reversal signals to take a sizable short — only after sellers show up.
shakatrade1_618
Reaccumulation. Breakout. Distribution.
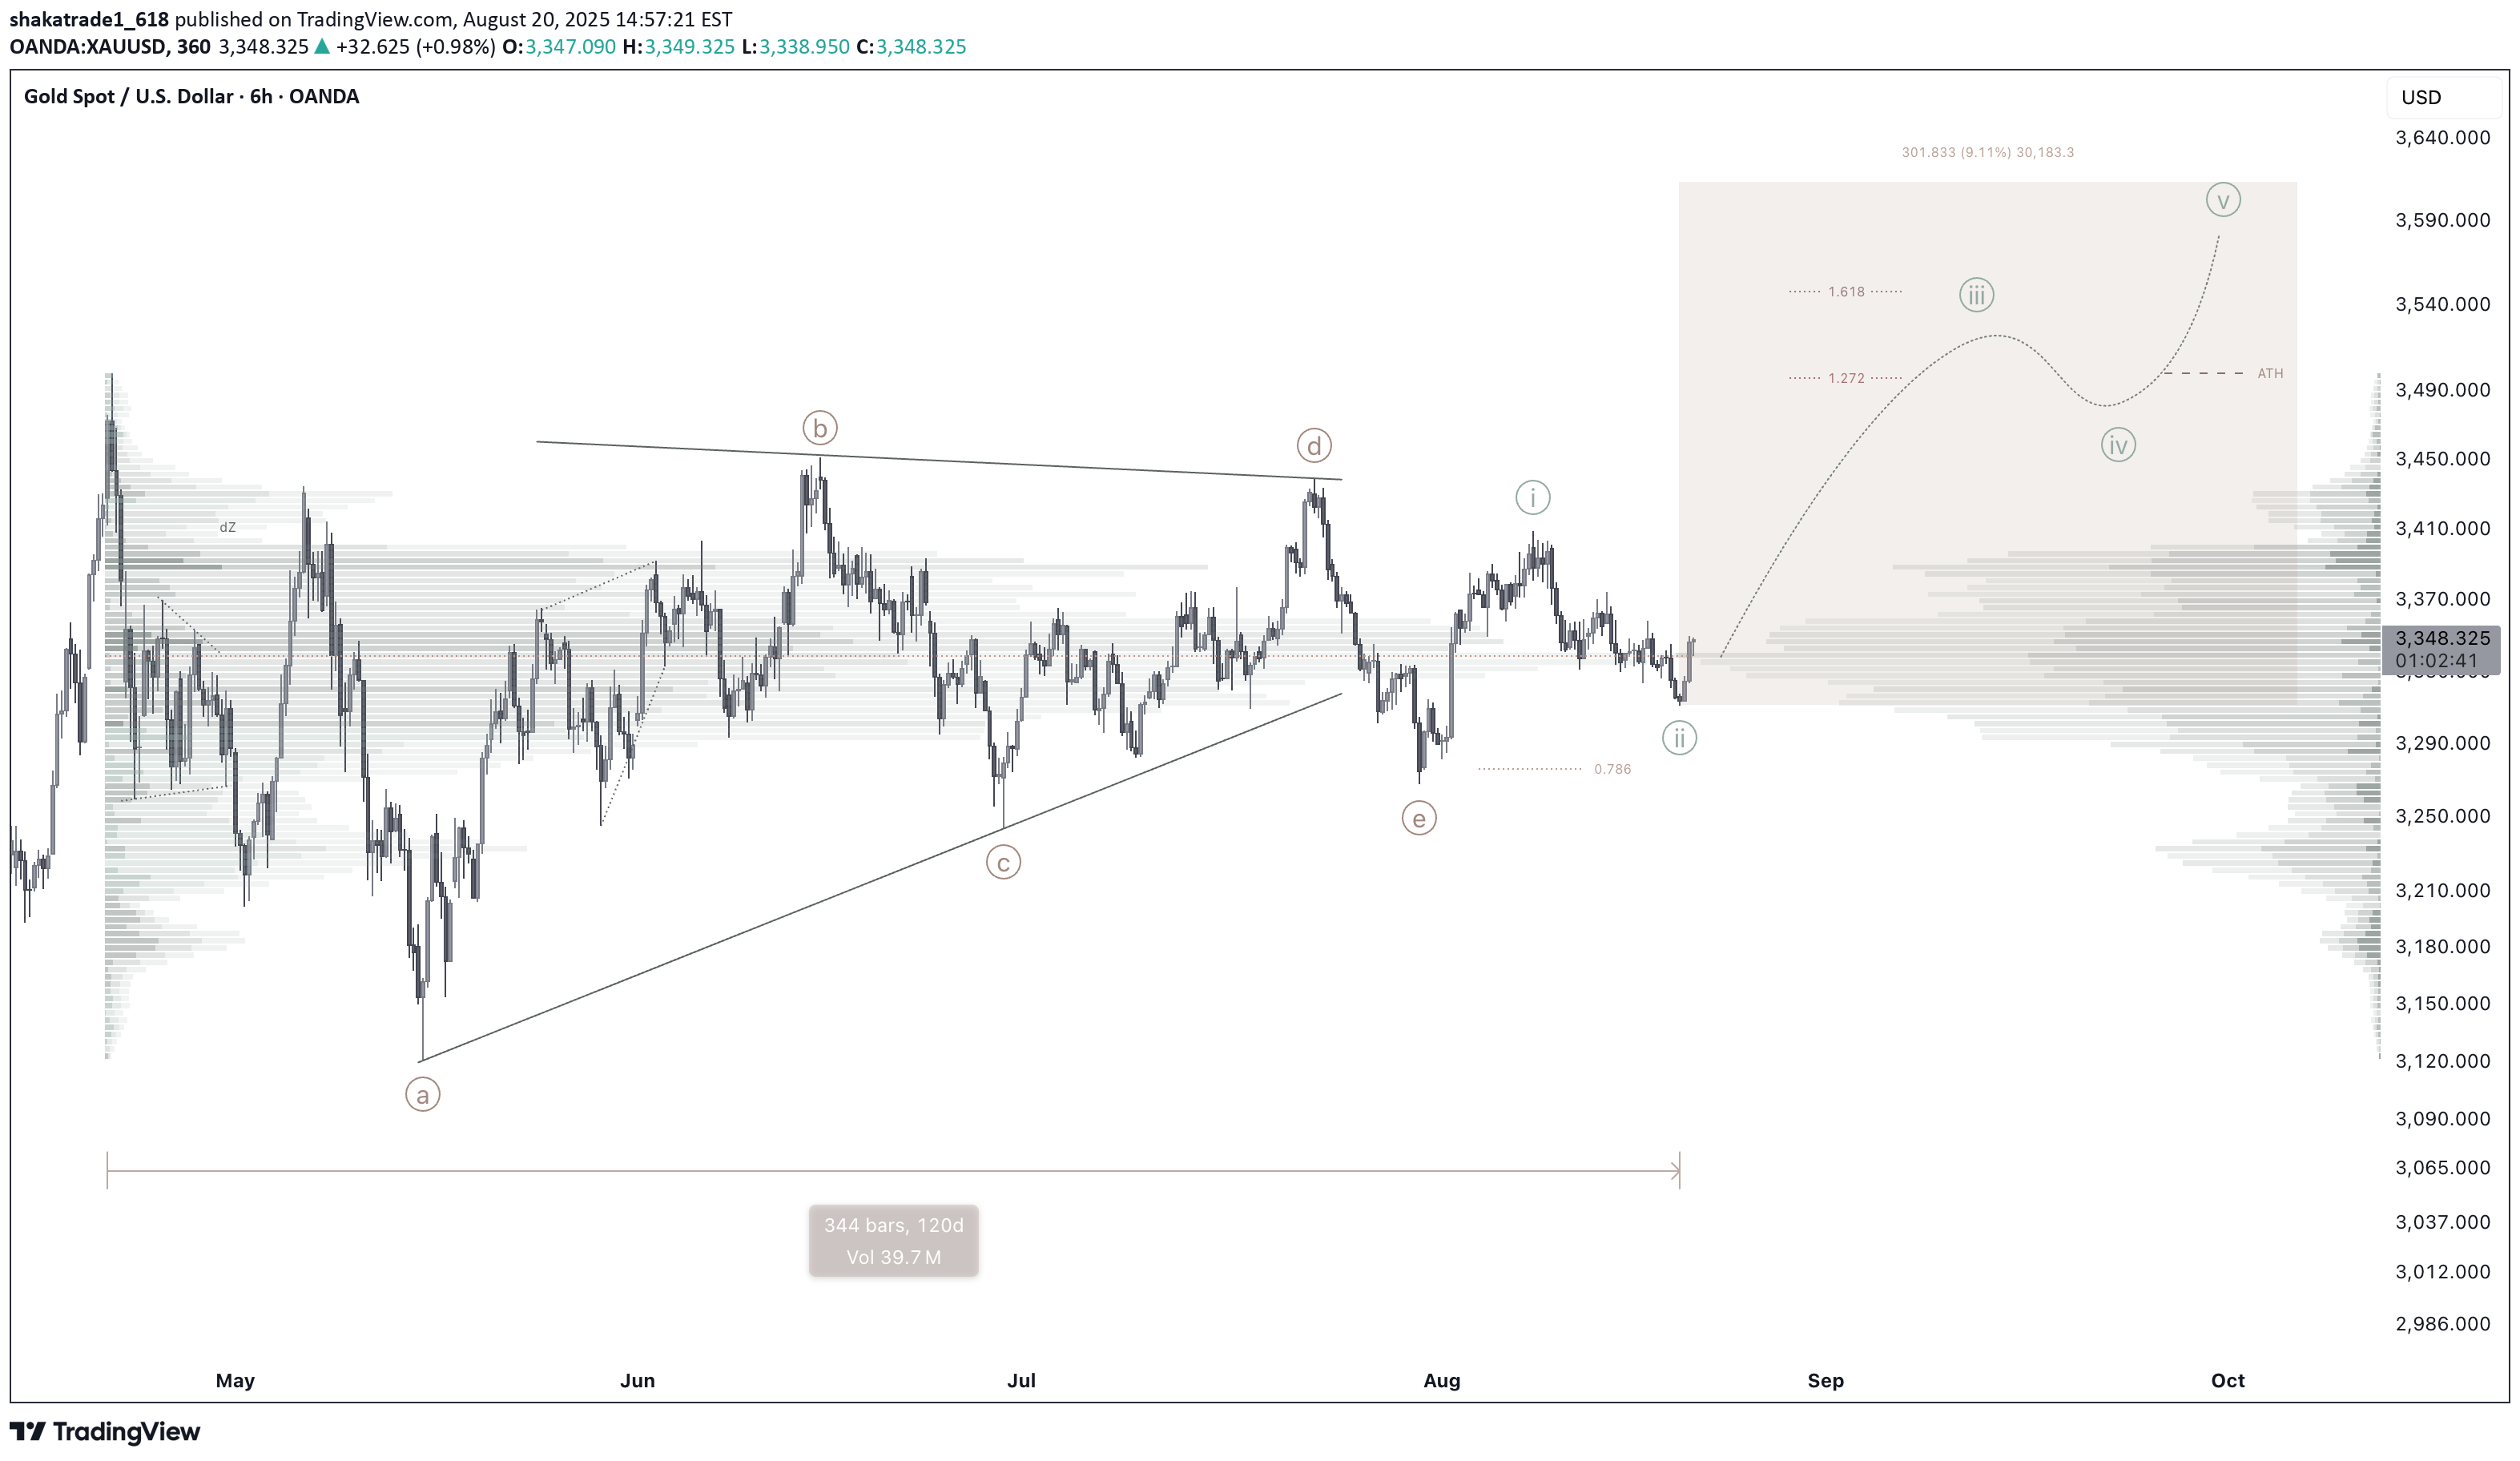
Gold. 120 days of reaccumulation. The cT scenario looks like the base case — aiming for 3550–3600. I’m working this setup. What comes next is likely years of volatile distribution XAUUSD GC1!Not bad. Waiting for a new high. By the way, it has already happened on the futures contract.The roadmap has played out — and even overshot my bold expectations. High probability we shift into a wide range, structurally a wave 4 of the higher-degree impulse. Expect elevated volatility, fake breaks, and choppy rotation.
shakatrade1_618
HFT: One Last Pump Before the Dumpster?

🚨 HFTUSD HFTUSDT — Quick Breakdown 🚨 📉 Structure Clear bearish trend: lower lows, lower highs. Every time momentum hits overbought, we get another dump. Altseason? Highly unlikely to save this shitcoin. 📊 Price Action June brought a bounce, but July almost completely erased it. If August closes below its open — expect the downtrend rally to continue. 🌊 Wave Scenario June’s move looks like a potential impulse, so one more upward leg is possible: 🎯 T1: 0.1023 (July high) 🎯 T2: 0.1678 (July 2nd high) 🔝 Max realistic: 0.1800 (monthly imbalance fill) 🦄 Fantasy land: 0.2450 if we get a “fairy-tale” altseason. 💩 Fundamentally — this is a worthless piece of dog sh*t, don’t expect long-term miracles.HFT — update We hit the first target almost immediately; I took profit as the volume spike looked like a classic exit pump. Revisiting the idea now: looks like this shitcoin is in re-accumulation (possible ABCDE triangle). Base plan: one more push up toward target 2.
shakatrade1_618
Litecoin: Major Expansion or Still Too Early?
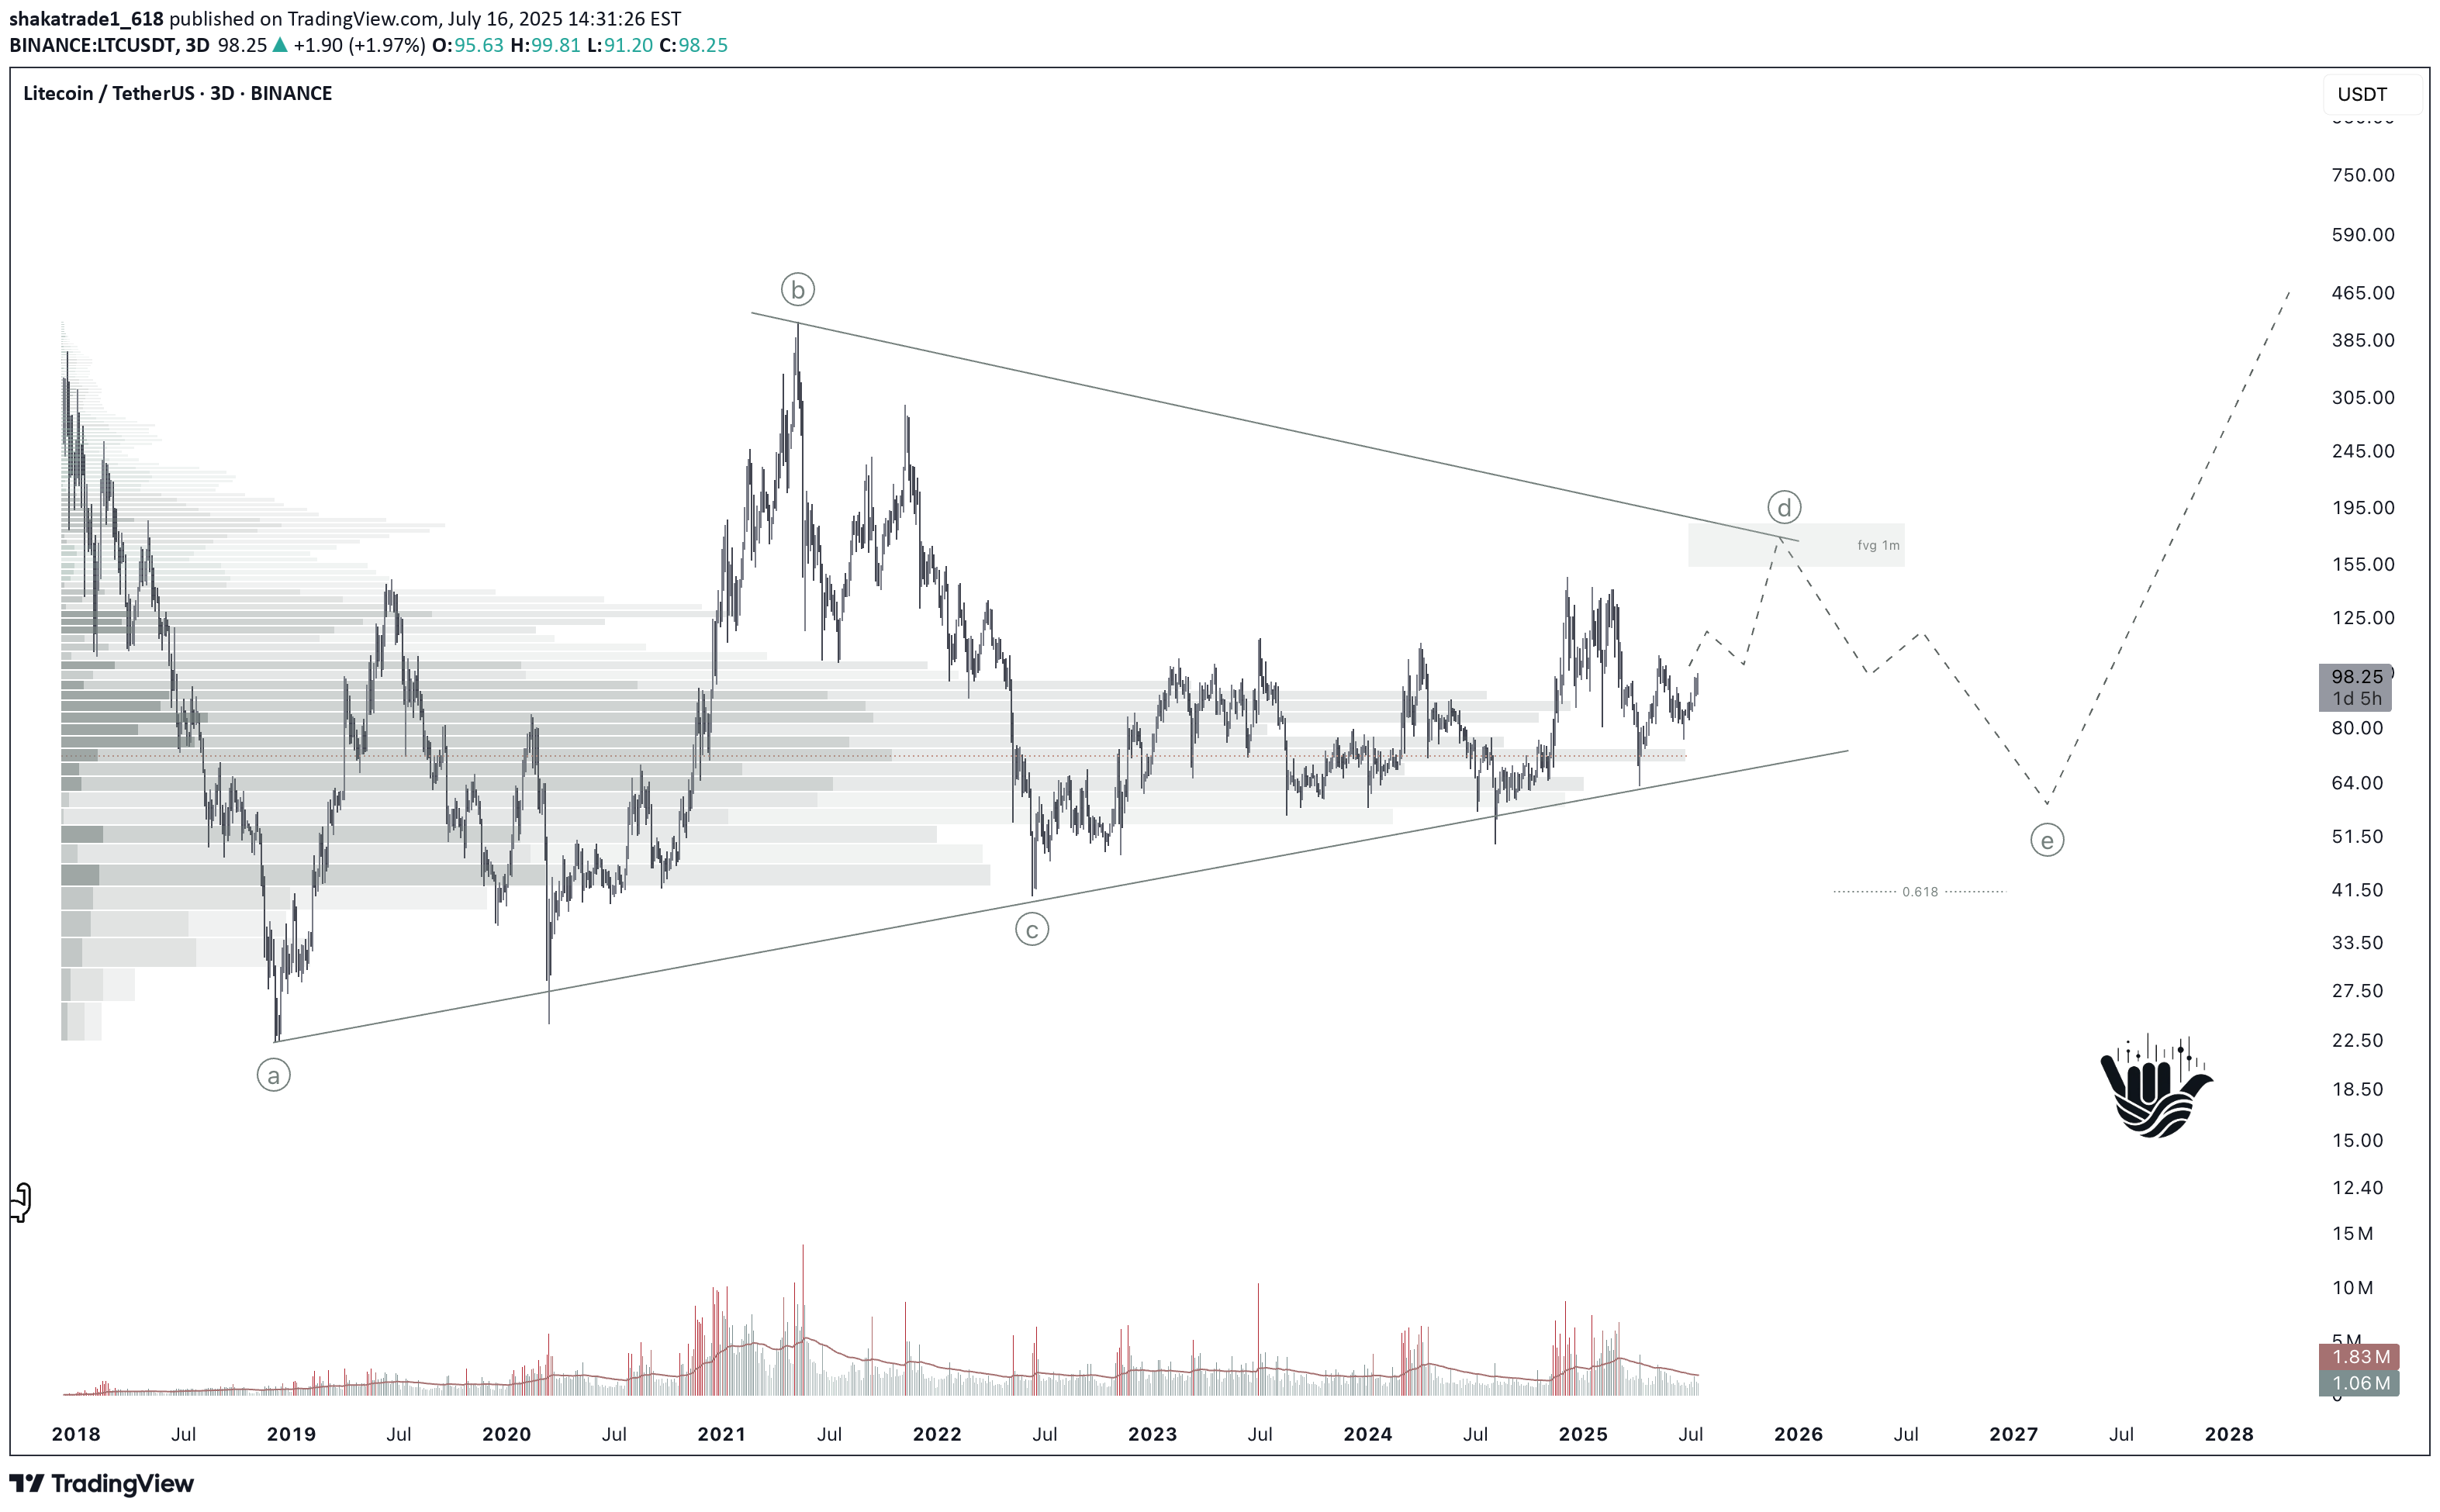
Price Action & Key Zones Litecoin LTCUSD LTCUSDT continues to move within a multi-year consolidation range. The monthly chart clearly shows the range that has held since 2022. Key levels to watch: Resistance at 145–150 USD — a key seller zone that has repeatedly acted as a reversal area. Zone 150–180 USD — monthly imbalance, likely to serve as major resistance on breakout. Range 195–270 USD — bearish order blocks, which will also act as overhead resistance. On both monthly and weekly timeframes, LTC appears to be in a phase of accumulation or reaccumulation. A breakout from this structure will likely take time. Wave Analysis: Two Scenarios 1. Base scenario : LTC is still forming a contracting triangle. Currently, it is developing wave D, which should test the monthly imbalance in the 150–180 range. After that, a correction in wave E (bearish phase) is expected, followed by a potential upward impulse. 2. Alternative scenario : the triangle is already complete, with wave E having formed at $62 in December 2024. A new upward expansion has begun. However, this version is not supported by the triangle’s geometry — none of its sides align with the 0.618 Fibonacci ratio. Also, proper distribution in such cases typically takes at least 6 months, and BTC might not have that much time left in its cycle. Therefore, I stick with the base scenario: LTC is still in the accumulation phase. Targets & Timing Near-term targets: $107 → $128 → $147 (December high). Maximum target for this cycle — $180, where a major reversal or distribution may occur. On the 4H chart, a 5-wave impulse structure formed from April to May (likely wave A), followed by a sharp correction. Currently, wave C appears to be unfolding, and based on Fibonacci extensions, it could reach between $128 and $180. Fundamental Drivers for Growth: 1. Litecoin remains a reliable payment network, offering fast transactions and low fees — often referred to as “digital silver.” 2. LTC mining is synchronized with BTC, making it a logical choice for certain miners. 3. In many regions, LTC is actively used for cross-border transfers and capital movement. 4. Undervalued compared to other altcoins, with no centralization concerns or SEC scrutiny — this could attract more institutional interest. 5. ETF Potential: after BTC and ETH, Litecoin could be the next natural candidate for a spot ETF. If approved, this could trigger a significant surge in interest and liquidity.Two targets hit successfully — $107 and $128 reached. The next key target is the December high. The bullish structure remains intact, and as long as LTC holds above the broken levels, there is still room for further expansion. A firm close above $128 would be a strong confirmation, opening the path toward the next milestone.
shakatrade1_618
BTC: One More Leg Down?
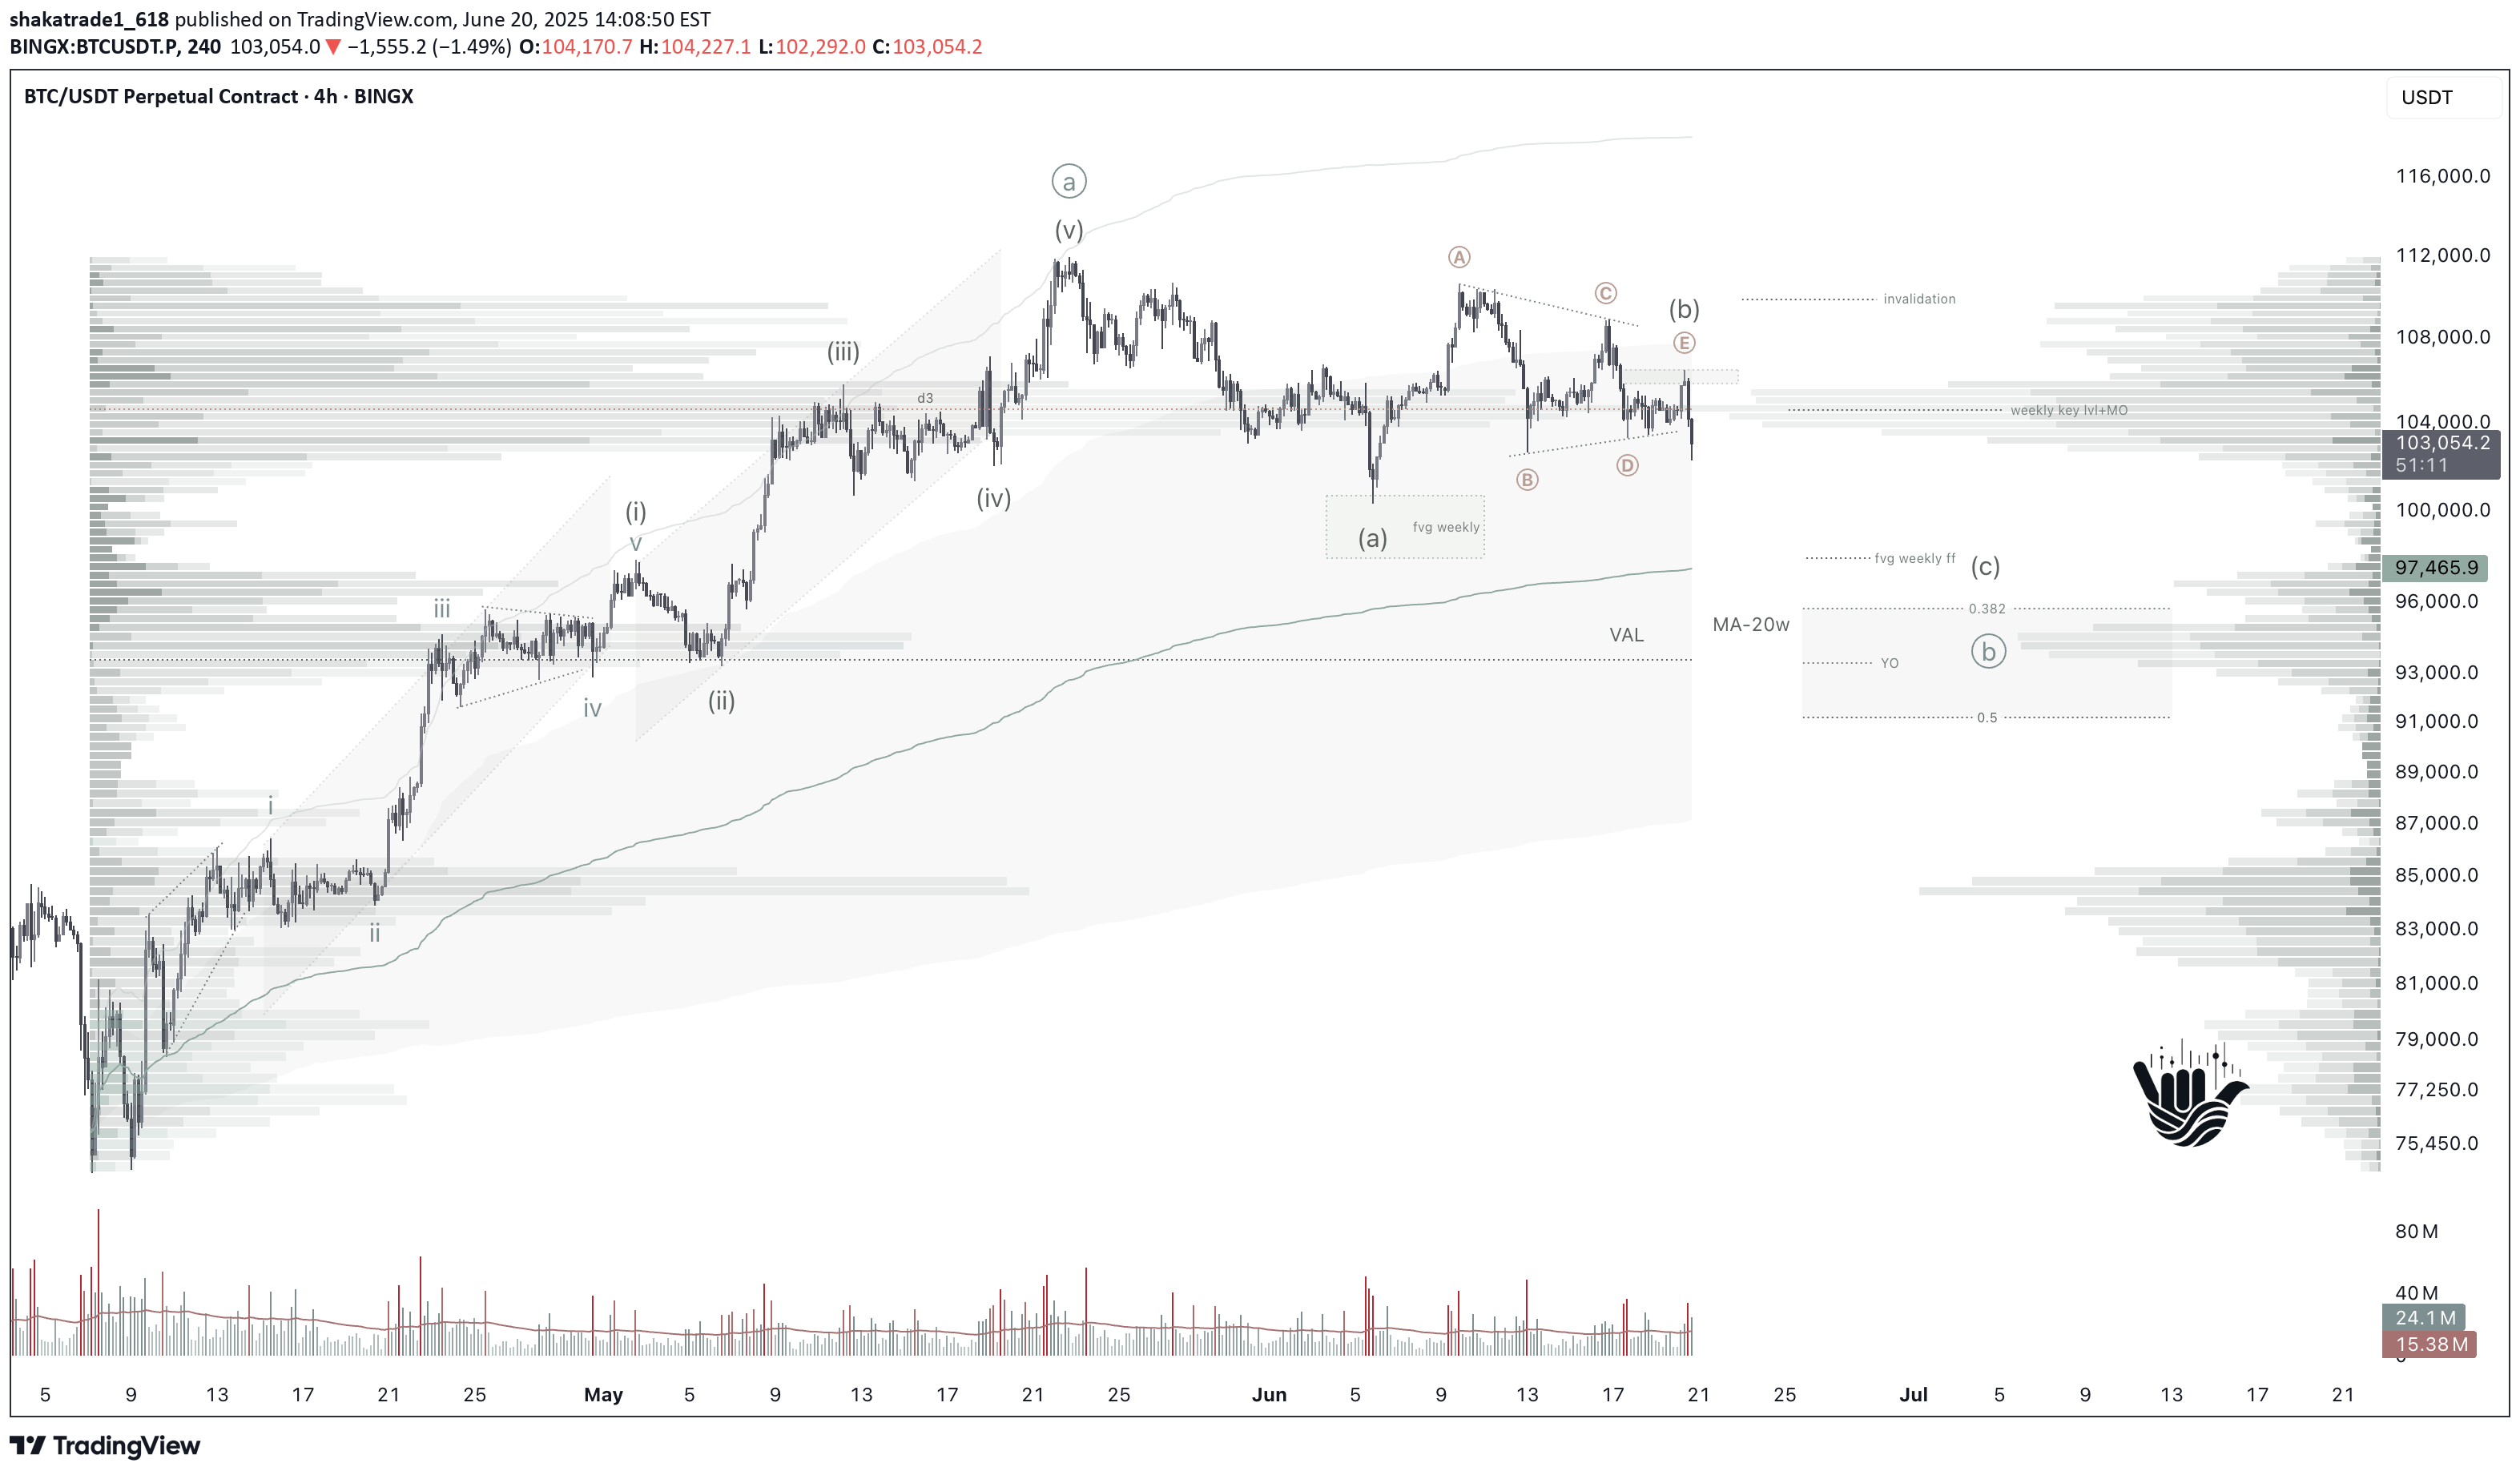
I believe the impulse BTCUSDT BTCUSD BTCUSDT.P from April to May has been completed, and we are currently in a correction phase, which is likely to continue for some time. In the base case, I’m considering a simple zigzag pattern: Wave A – impulsive move down Wave B – forming a symmetrical triangle Wave C – expected next 🎯 Target zone: 97,500, where we have a confluence of weekly FVG, 20-week MA, and vWAP.Overall, on track. We're starting to see a series of climaxes, so a reversal could be expected soon.Closed half the short position at 98,400. Kept the other half for a possible drop to 96,000, but the market reversed — second part moved to break-even.
shakatrade1_618
Bitcoin Topped in January? Here’s Why That’s Not Crazy.
The move BTCUSDT BTCUSD BTCUSDT.P from November 2022 looks like a textbook impulse. The third wave extended perfectly to 1.618 of wave one — a classic sign of strength. But here’s the big question: Did the impulse already end in January 2025? If yes, we’re looking at a nearly ideal structure: 🔹 Wave 3 — extended to 1.618 🔹 Wave 5 ≈ Wave 1 (typical after an extended 3rd) 🔹 Fib zone 0.382–0.618 of wave 0–3 — perfectly hit 🔹 Sentiment — peak euphoria in January: BTC in national reserves, mass media hype 🔹 Volume spike — a sign of potential distribution at the top 📌 Possible scenarios: 1️⃣ The impulse is complete, and we’re already in a corrective phase — even if the market doesn’t realize it yet https://www.tradingview.com/chart/BTCUSDT/xGke8M2k-The-bull-rally-to-end-in-December-2024-February-2025/ 2️⃣ A terminal diagonal is forming — ATH hasn’t been printed yet, but we’re likely close 3️⃣ A 5th wave extension — still possible, but less likely given current global liquidity and macro headwinds (trade war environment) 📊 Watch the 200-dayMA: Historically, Bitcoin tends to stay below it for about 2 months during bull cycles. That clock is ticking — the next few weeks may reveal the market’s true direction. 📈 A strong weekly close above $95K would sharply raise the odds of a new ATH. Until then — monitor the local structure and wait for clarity.
Disclaimer
Any content and materials included in Sahmeto's website and official communication channels are a compilation of personal opinions and analyses and are not binding. They do not constitute any recommendation for buying, selling, entering or exiting the stock market and cryptocurrency market. Also, all news and analyses included in the website and channels are merely republished information from official and unofficial domestic and foreign sources, and it is obvious that users of the said content are responsible for following up and ensuring the authenticity and accuracy of the materials. Therefore, while disclaiming responsibility, it is declared that the responsibility for any decision-making, action, and potential profit and loss in the capital market and cryptocurrency market lies with the trader.