
ftdsystem
@t_ftdsystem

What symbols does the trader recommend buying?
Purchase History
پیام های تریدر
Filter
ftdsystem
پایان سلطه نقره؟ زمان خرید طلا و فروش نقره فرا رسید!
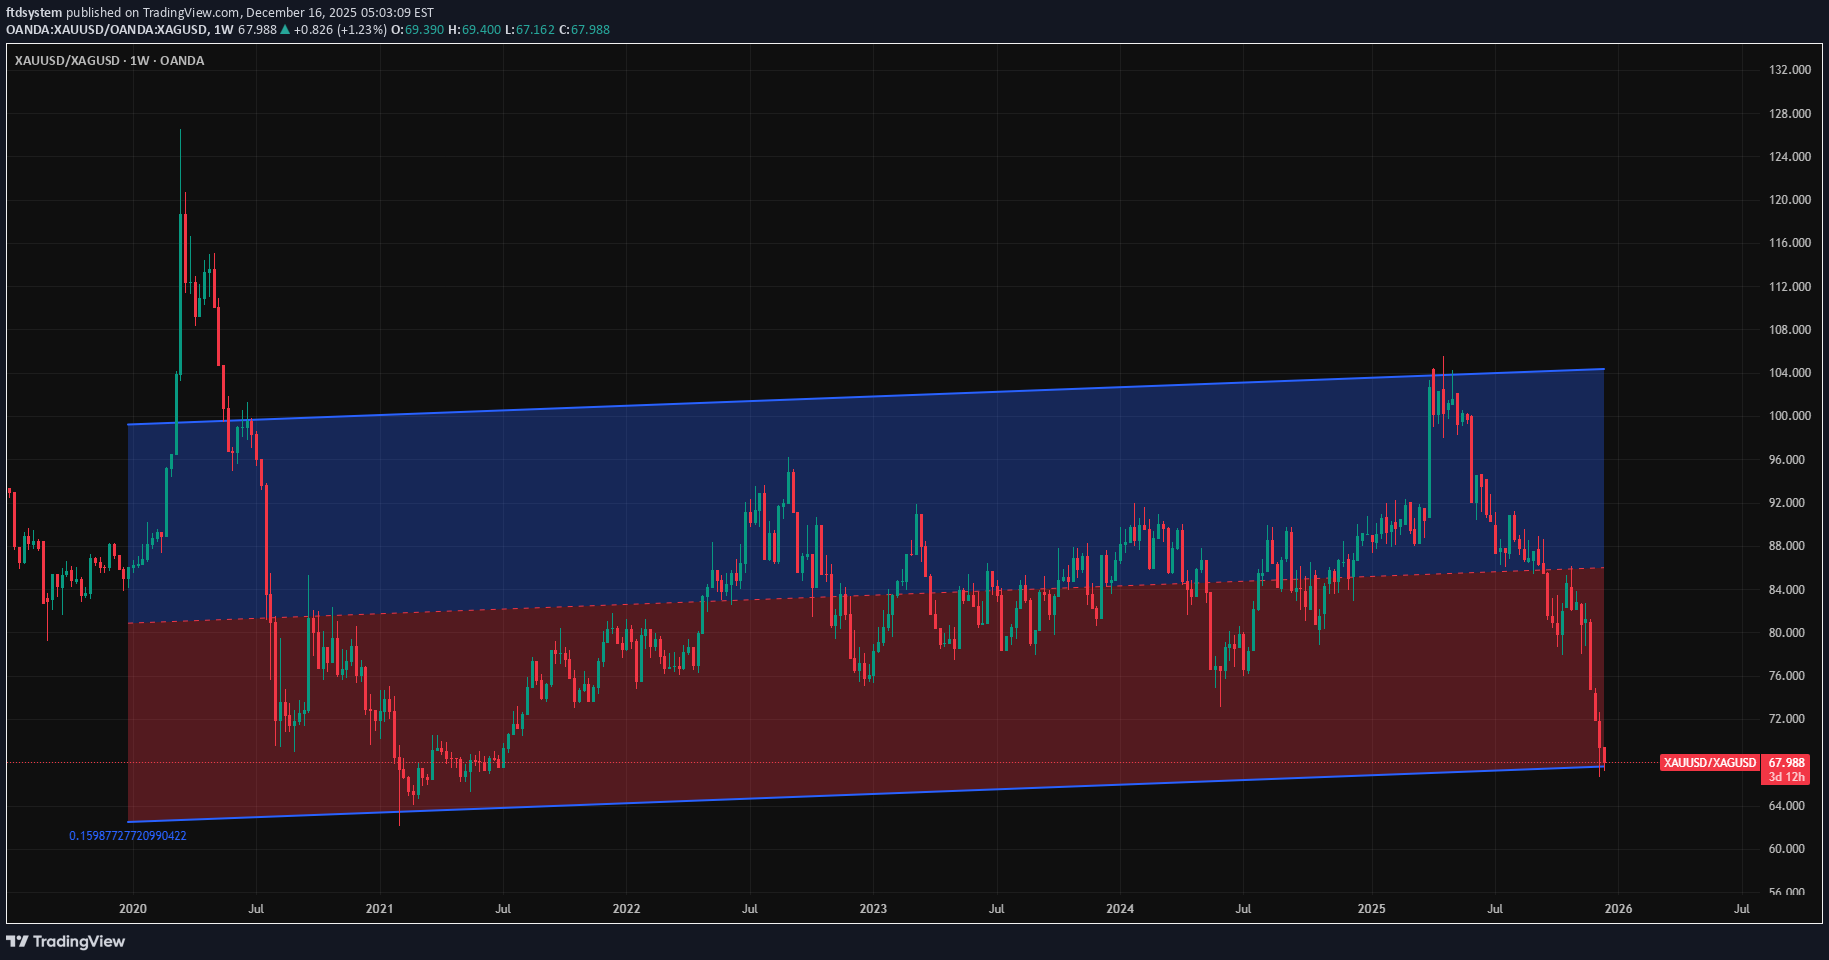
The gold/silver ratio is now below 68. The balance may have turned too much in favor of silver and is currently testing the -2 standard deviation of the 2020-to-date regression trend. The heightened demand from China, rising energy investments, and opposite reactions to tariff fears are some of the main reasons for the imbalance. Sometimes the ratio goes to extremes but eventually comes back to long-term averages. As 2020 was a game changer in the economy, the 2020-to-date regression line can be accepted as the balance point. When the rebalancing price action begins, a "buy gold, sell silver" pair trade opportunity might emerge.
ftdsystem
جهش بزرگ طلا: پایان بحران نقدینگی و فرصت خرید جدید!
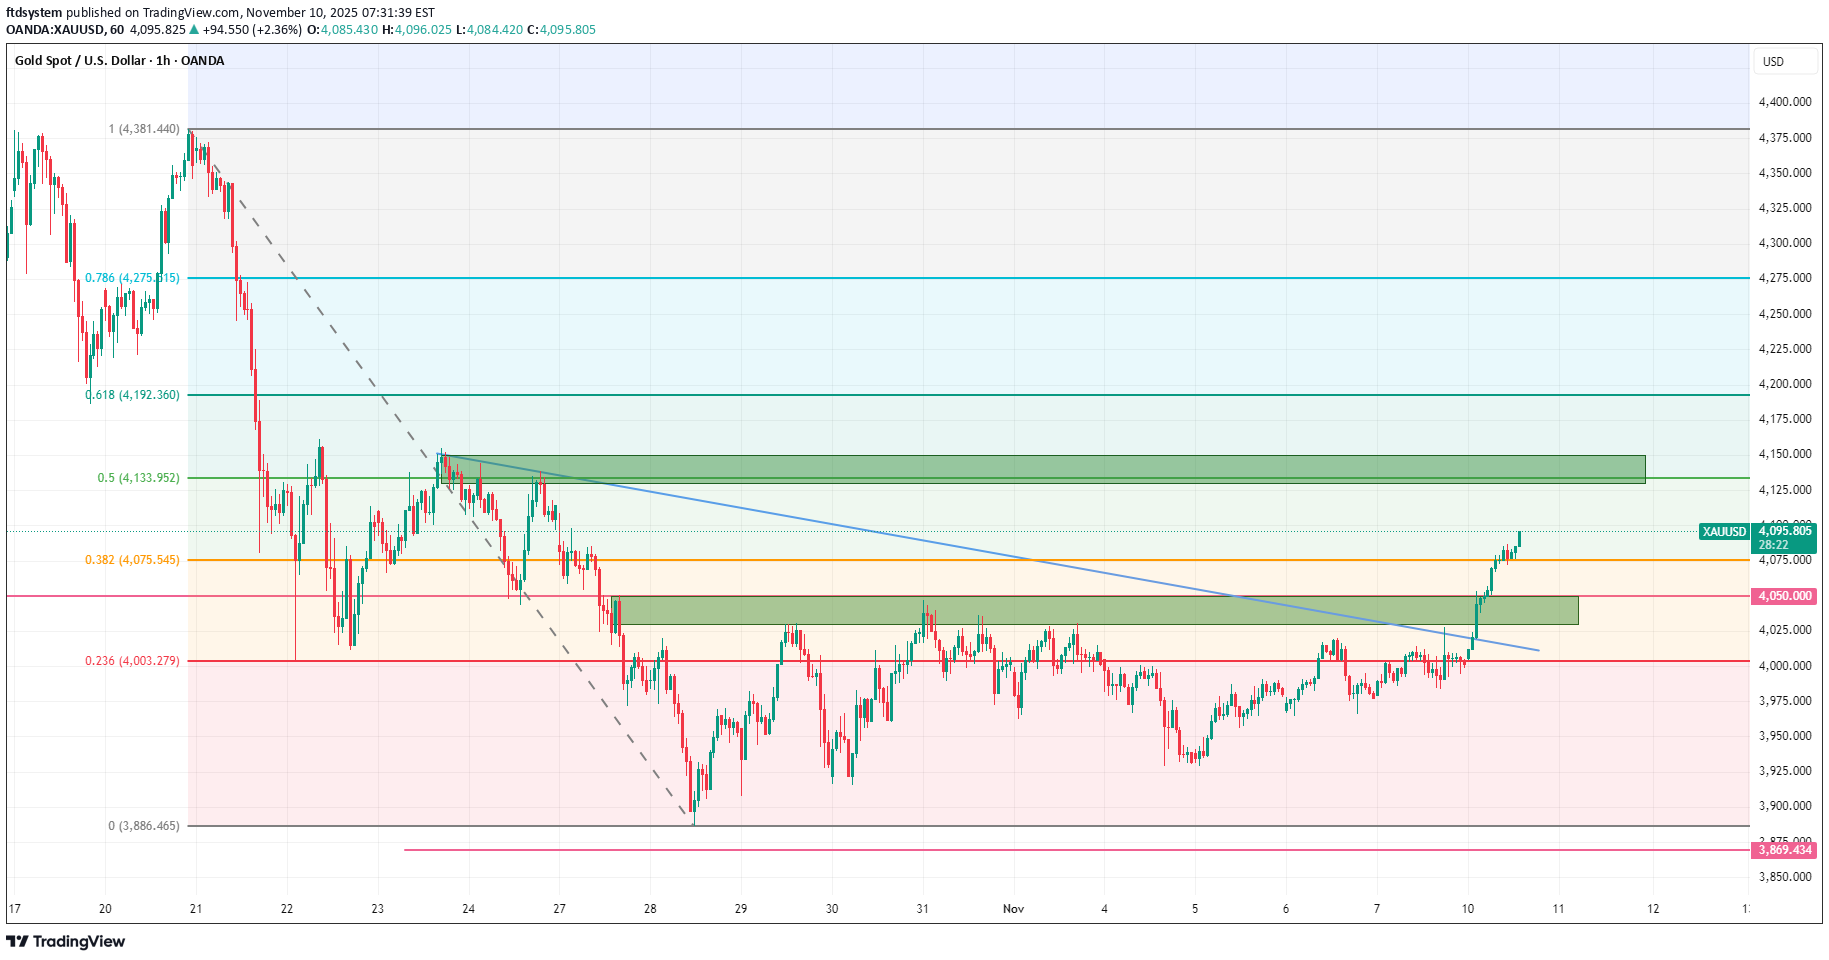
Over the weekend, Trump’s $2000 tariff dividend announcement and the Senate’s first step toward ending the shutdown gave a strong boost to gold prices. Both developments are helping to ease the dollar liquidity crunch that has pressured gold in recent days. It’s not over yet, but after testing the 4130–4150 resistance zone, gold might see a short-term selloff that could present a new buying opportunity. With quantitative tightening set to end in December, bullish pressure is likely to persist in the medium term.
ftdsystem
توافق آمریکا و چین؛ آیا دوران طلایی طلا به پایان رسید؟
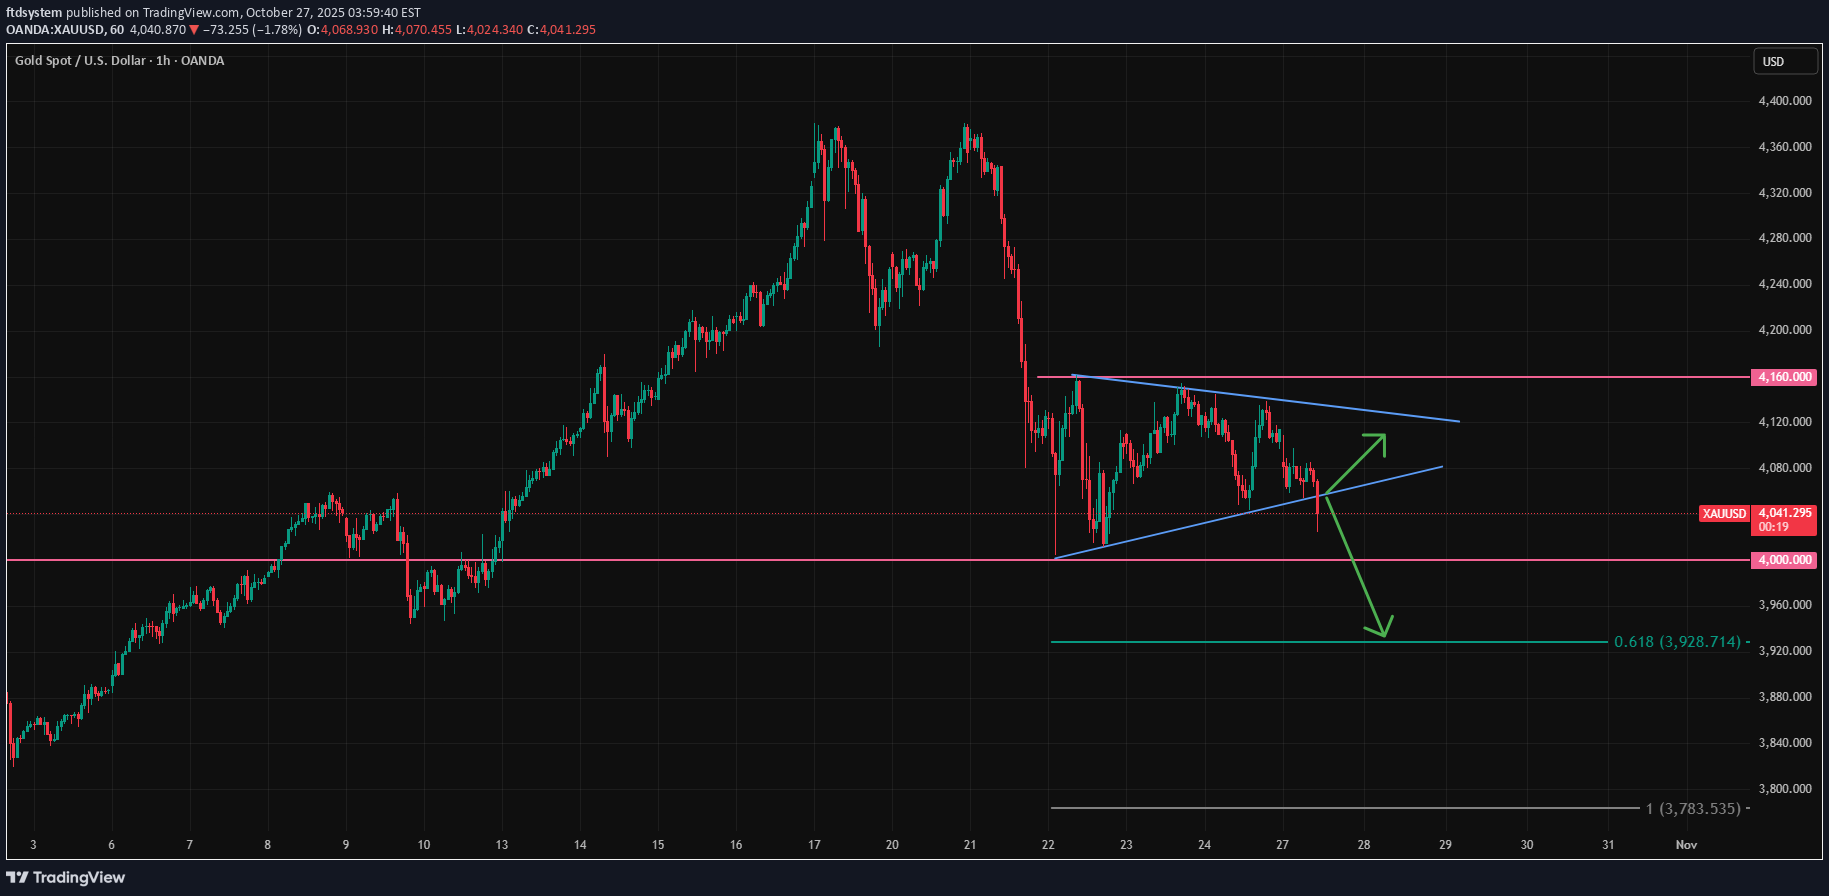
Gold started the week on a bearish note following reports that the US and China reached a new trade agreement. The pennant formation is currently being tested to the downside. If it breaks, the first target will be the 4000 support level, with the potential for further declines. Key support levels to watch are 4045, 4000, 3930, and 3775. Traders should be ready for a volatile week filled with central bank meetings, the Trump–Xi summit, and developments related to the US government shutdown.
ftdsystem
تست کلیدی طلا: آیا کف دوقلو شکسته میشود یا منتظر بازگشت هستیم؟
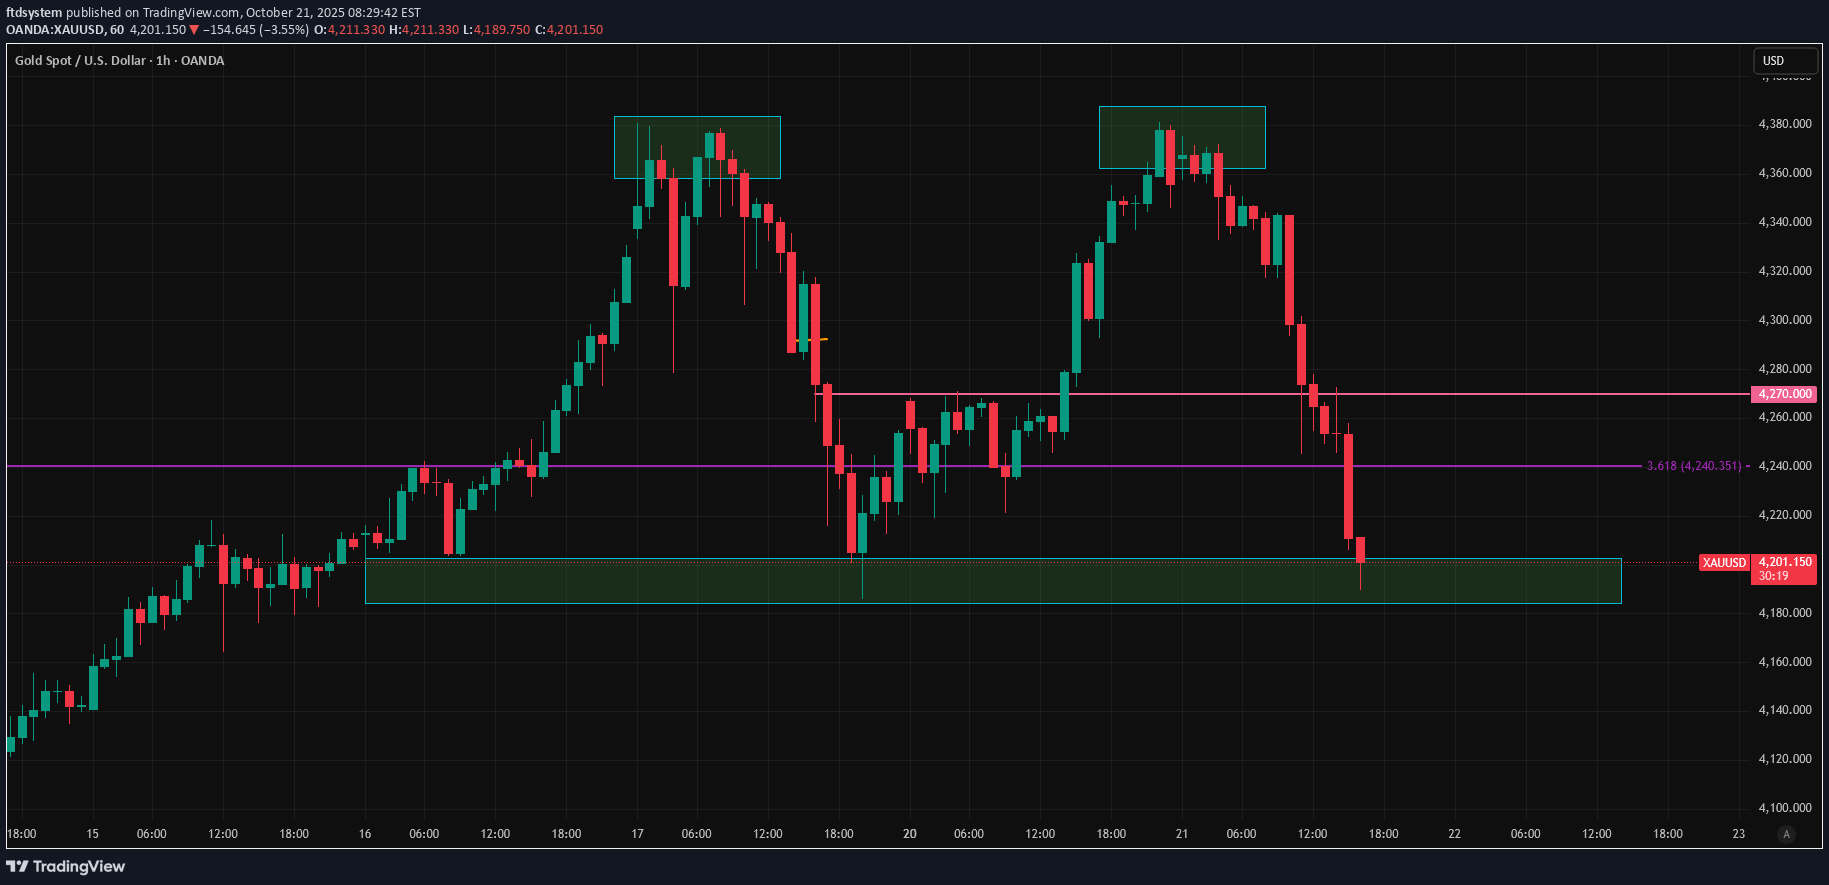
Gold is testing the neckline of the double-top pattern. The selloff has been sharp, so a clean break below support is unlikely today, even if it retreats below 4200. The base case is a short-term rebound toward the 4250–4270 zone before a potential break lower.
ftdsystem
آیا سقوط انویدیا فقط یک توقف کوتاه است؟ بازگشت قدرتمند NVDA در راه!
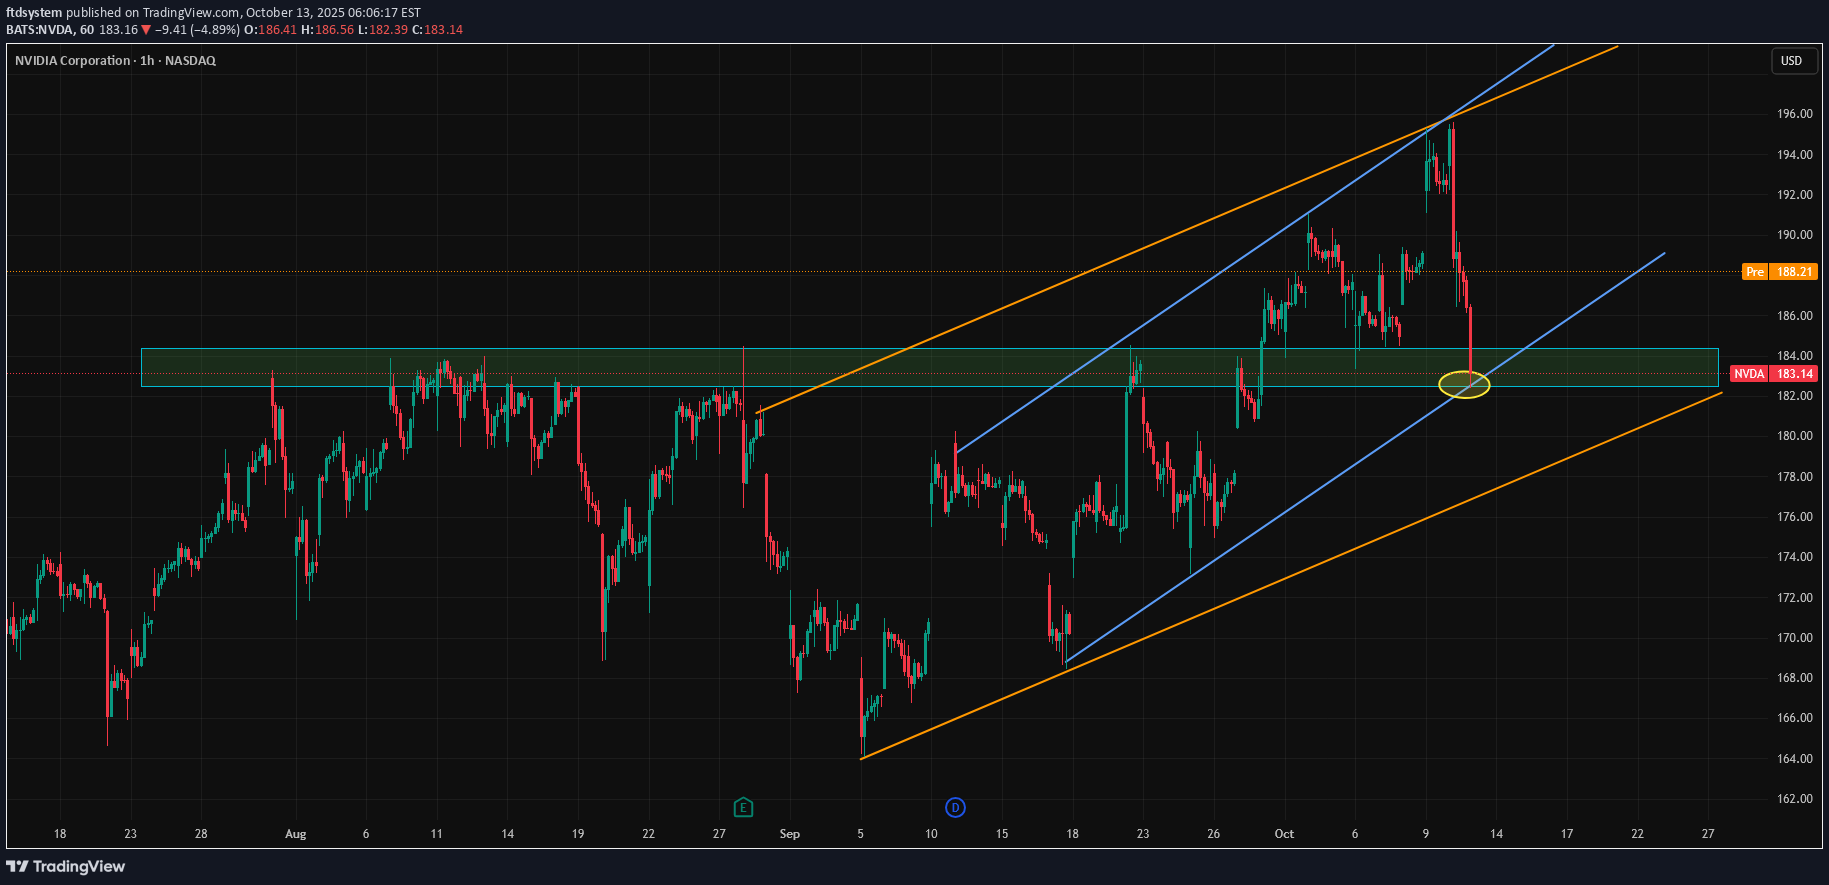
Trump’s remarks about China close to Friday’s weekly close sent markets into a brief panic. Nvidia had just made a new all-time high, breaking through the previous top and resistance near 184, and was attempting another leg higher despite the US government shutdown. His comments triggered a 7 percent selloff, causing NVDA to retest the previous resistance zone from above. The 182–184 area is now the primary support. After Trump slightly eased tensions, the stock is up 3 percent in premarket trading today. The road ahead may be bumpier than bulls would like, but the upside remains the base case for now. If both the 182–184 zone and the 177 support fail, that would be the point where the bullish outlook should be reconsidered for the short to medium term.
ftdsystem
طلا دوباره 4000 را هدف گرفت؛ تلههای احتمالی در این سطح چیست؟
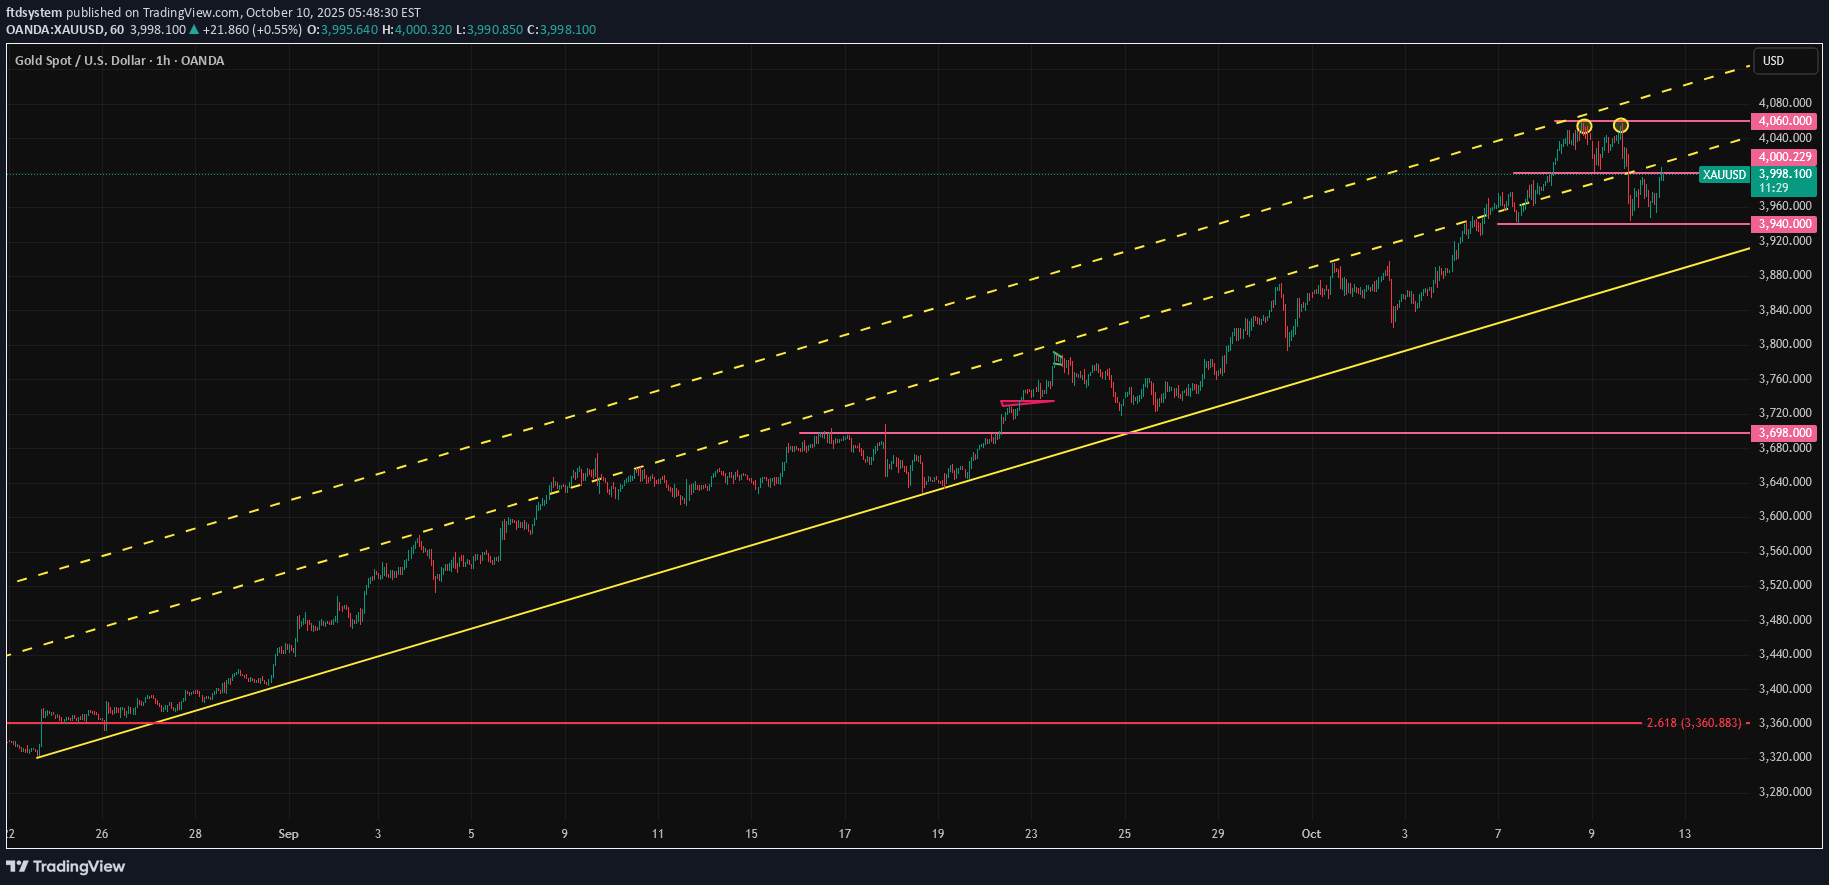
Gold formed a double top and reached the 3,940 formation target during yesterday’s selloff. It is now testing the 4,000 level from below. If this level holds, a slightly negative outlook for the next couple of days will be the base case, with gold moving closer to the main trendline. The trend currently sits around 3,885 and is rising. If gold manages to recapture 4,000 on a sustained basis, upward pressure toward 4,060 may continue. Traders should beware of possible traps around the 4,000 level.
ftdsystem
ETHUSD Retests Broken Trend on Weekly Timeframe
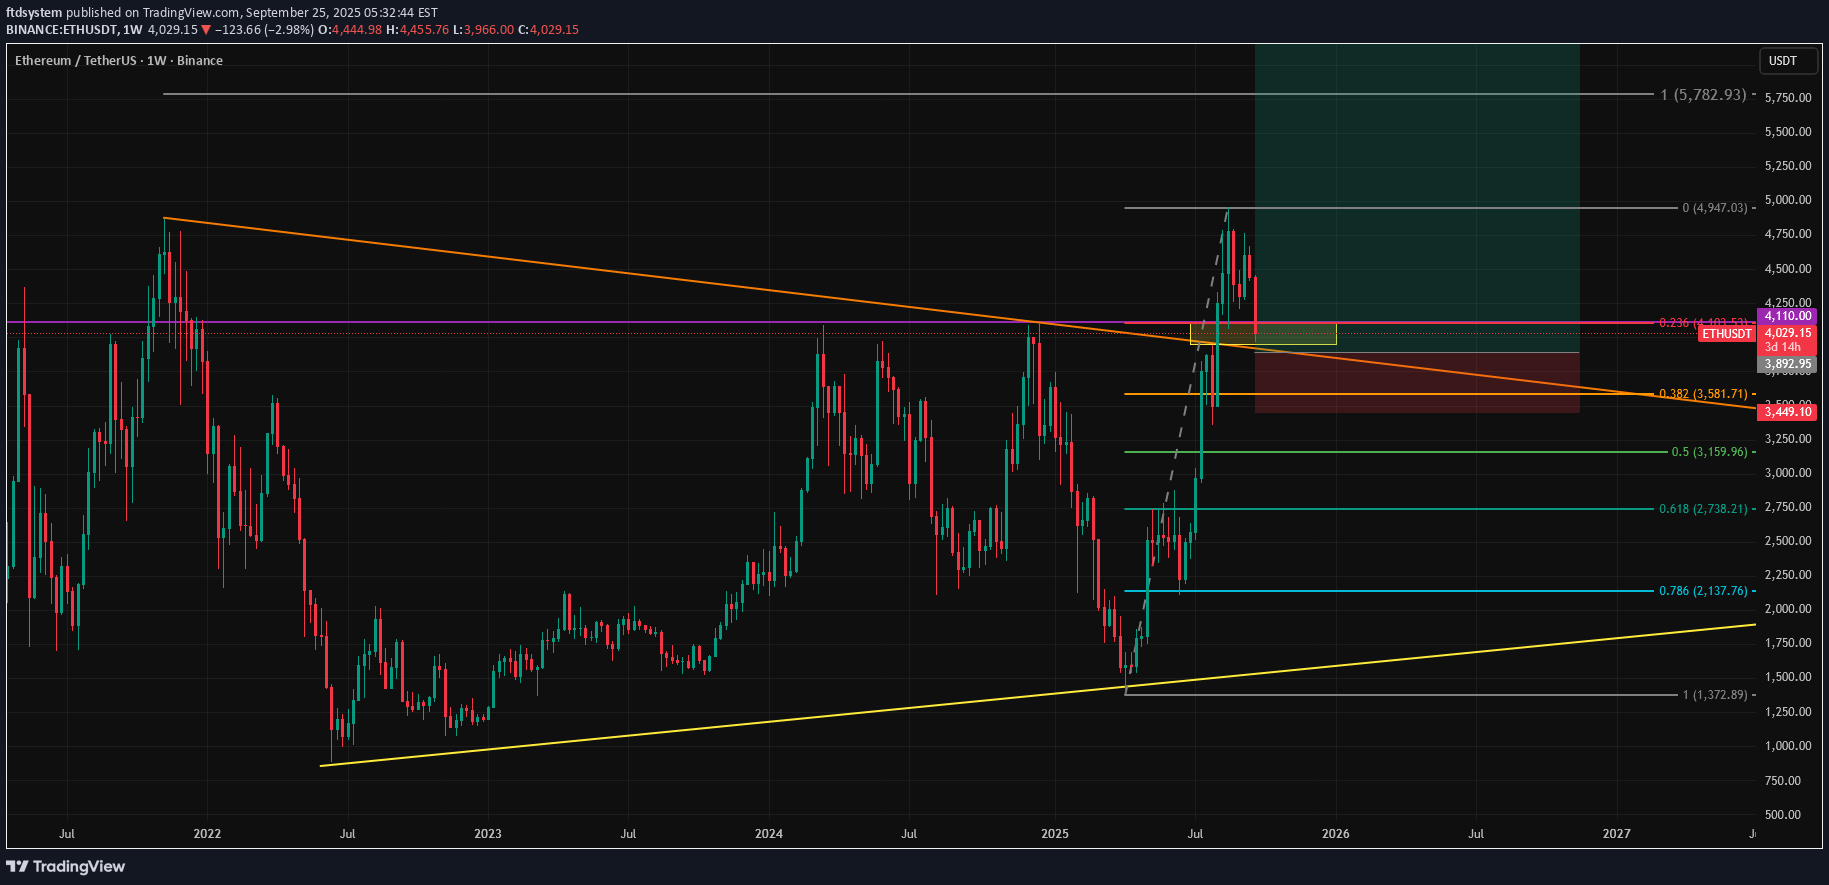
Ethereum is retesting the broken trendline and is likely setting up for another leg higher. Unless there is persistent pricing below $4,000, this selloff is likely to become a buying opportunity for those who missed the earlier rally. Our year-end (or end of the first quarter of 2026) target above $7,000 still stands. The main risk is a potential selloff in the US stock market, which could drag crypto lower if the correlation remains intact.Ether is up more than 20% from the retest and 50% more to go from here if our cycle top target reached. It will be total of 80% from the signal if it reached.
ftdsystem
S&P 500 Reaches Resistance in Both 1H and 1W Timeframes
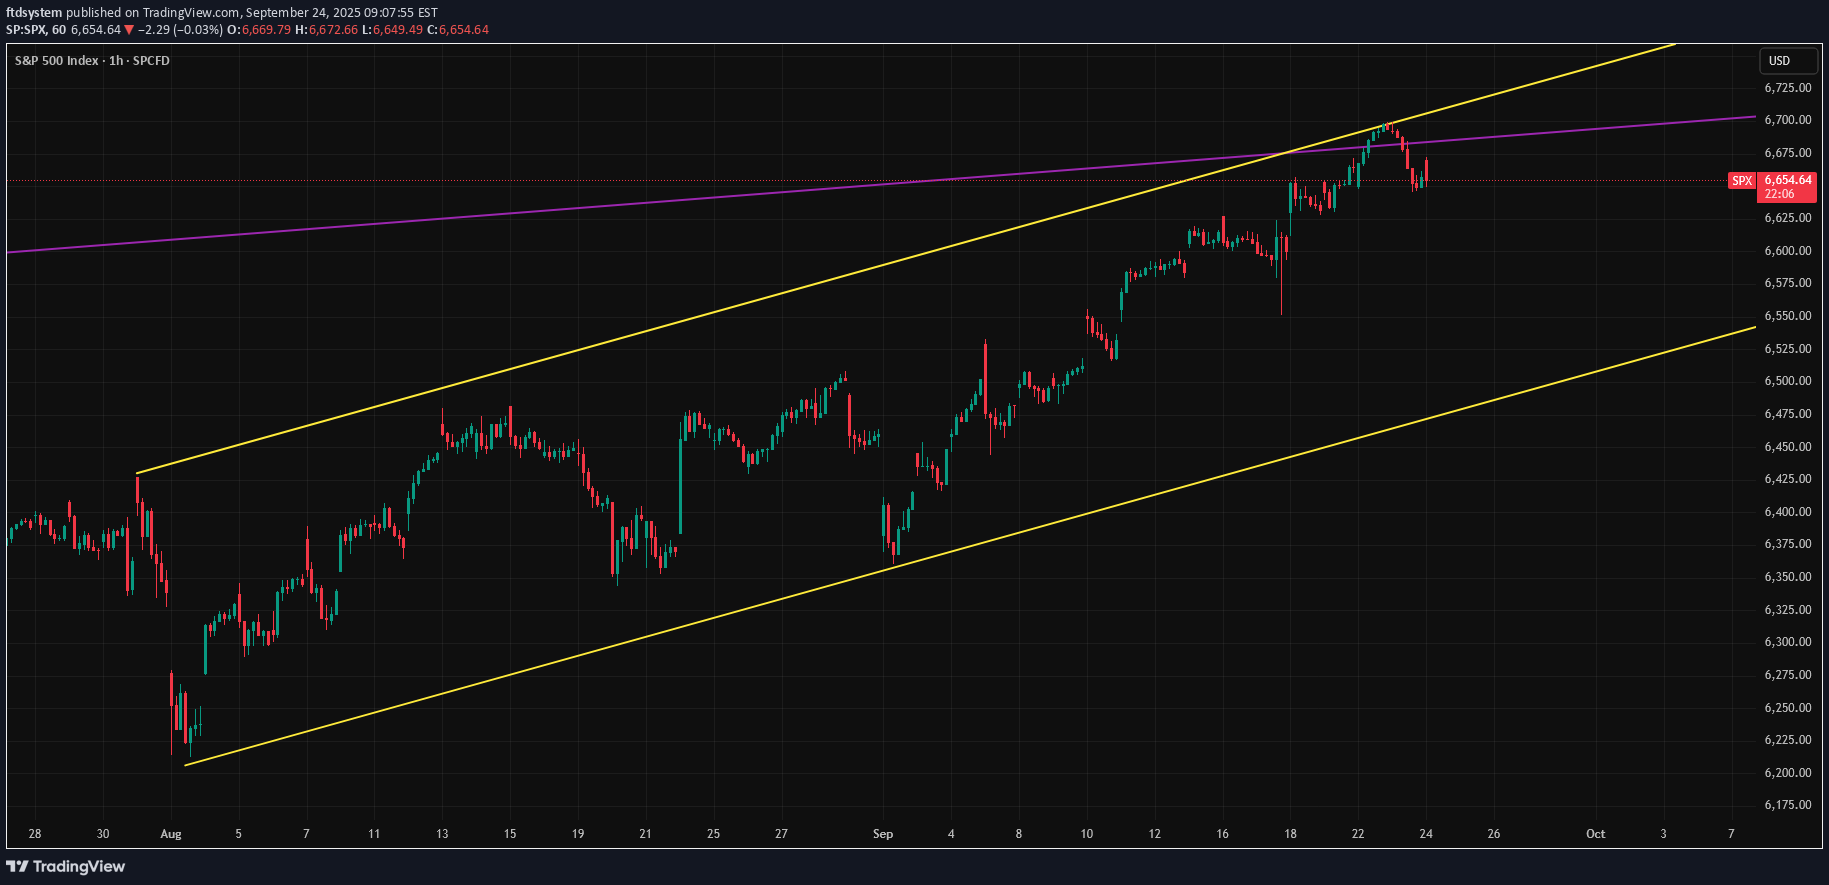
The S&P 500 has made nearly a 40 percent run from the April dip despite rising stagflation risks. Traders have chosen to focus on earnings and AI optimism, and that is likely to continue. However, the market has now reached a point where the upper lines of both the 1H and 1W trend channels are being tested, which should not be ignored. There is no reason to dismiss the strength of this magnificent bull market, but a bit of caution may be wise for those fully loaded with stocks or long the index via CFDs. In the short term, there is a risk of a correction toward 6,500.
ftdsystem
Gold May Face Resistance, Possible Pullback to 3698
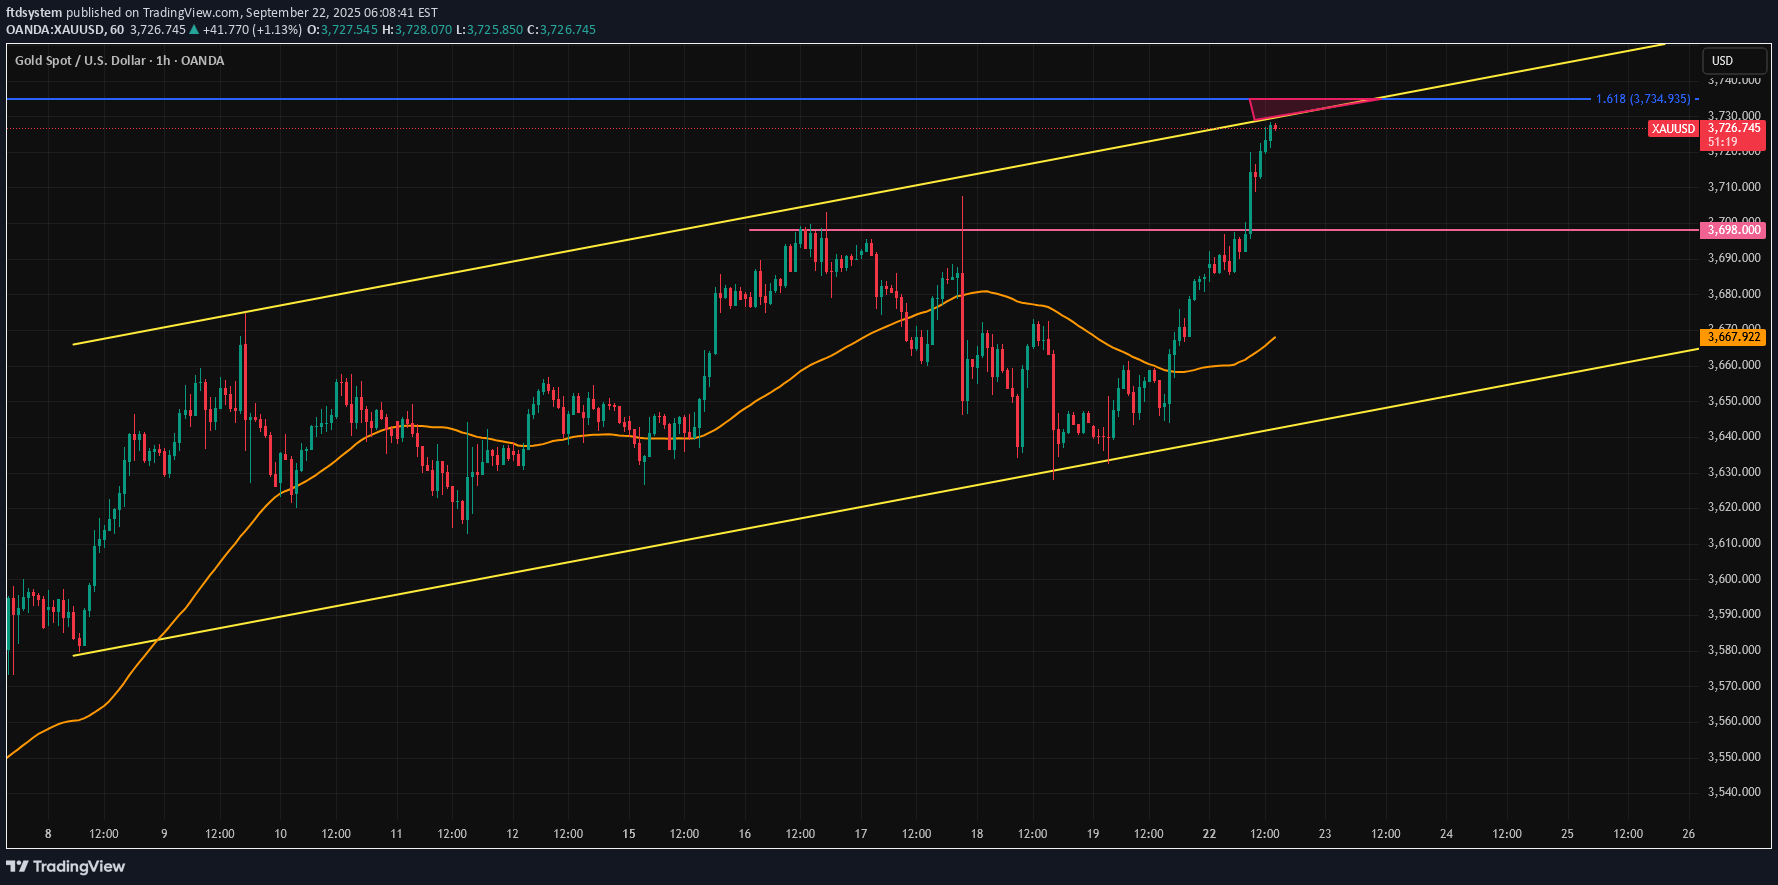
Gold continues to make new all-time highs, and this trend will likely persist for some time. In the short term, however, a significant resistance zone is being tested. Both the upper line of the short-term bullish trend channel and the 1.618 Fibonacci extension converge around the 3,725–3,735 area. This level could trigger a small downward reaction early this week, with an initial target near 3,698. The main trend remains upward, so any bearish trades should be considered risky and managed with tight stops.
ftdsystem
Ethereum Might be Ready for the Next Leg Up
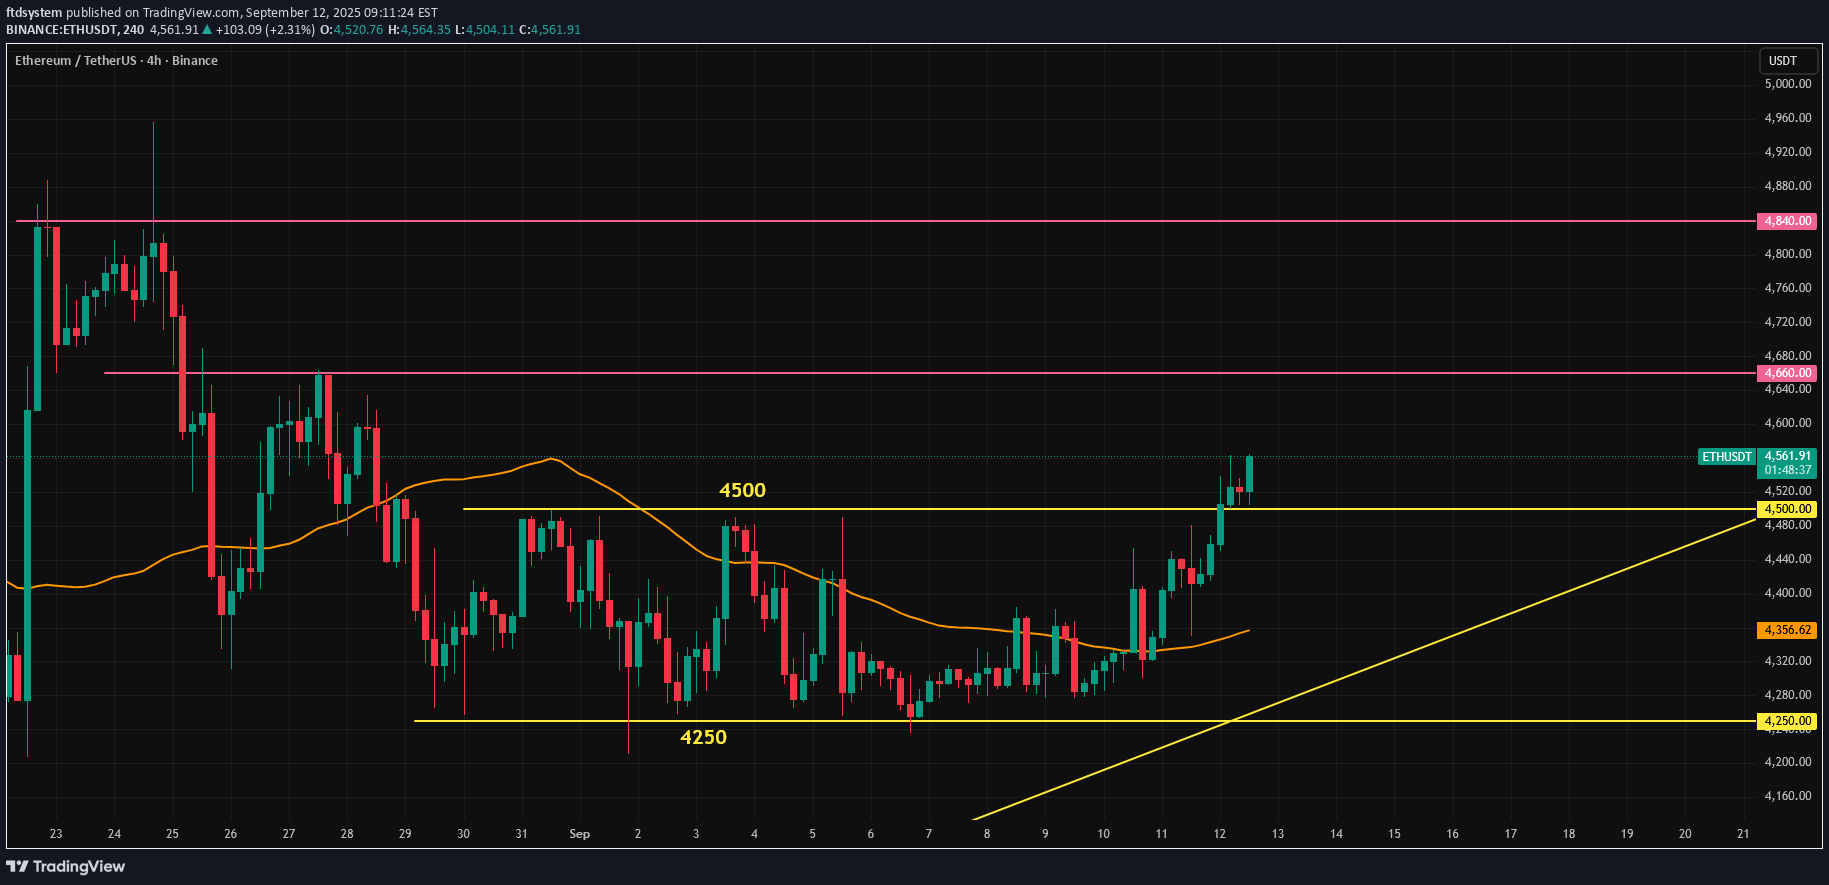
After nearly two weeks, ETH has finally broken above the 4,250–4,500 range. Upward pressure from the broader bull market can be expected to continue, at least through the end of this year. As Bitcoin approaches its cycle target range of 135k–150k, Ethereum may take the torch and accelerate the transition into altcoin season. In the short to medium term, 4,660 and 4,840 are possible targets for ETH.First target reached.
Disclaimer
Any content and materials included in Sahmeto's website and official communication channels are a compilation of personal opinions and analyses and are not binding. They do not constitute any recommendation for buying, selling, entering or exiting the stock market and cryptocurrency market. Also, all news and analyses included in the website and channels are merely republished information from official and unofficial domestic and foreign sources, and it is obvious that users of the said content are responsible for following up and ensuring the authenticity and accuracy of the materials. Therefore, while disclaiming responsibility, it is declared that the responsibility for any decision-making, action, and potential profit and loss in the capital market and cryptocurrency market lies with the trader.