Technical analysis by ftdsystem about Symbol BTC: Buy recommendation (7/16/2025)

ftdsystem
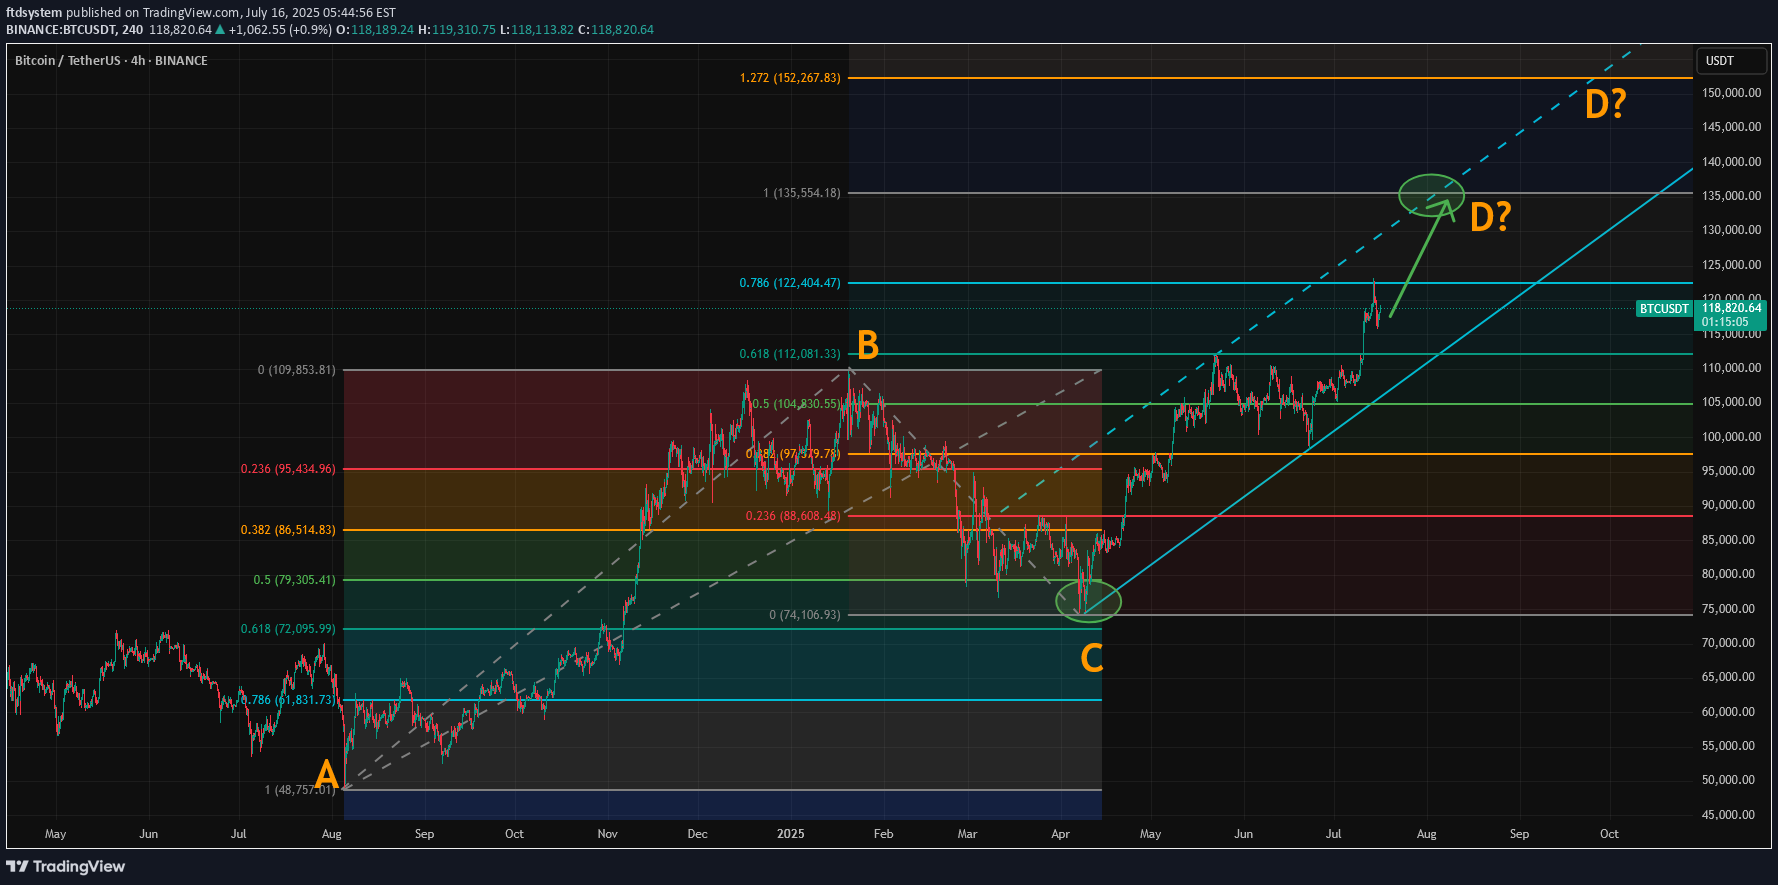
With the breakout above resistance around 110,000, Bitcoin’s rally appears to be back on track. If you've been following our crypto analysis, either here or on our website, you’ll know our target range for this bull cycle is between 135,000 and 150,000, with the top of the range possibly extending further depending on the strength of the final wave. Now, a possible ABCD pattern is forming, with point D potentially landing at either 135,000 or 150,000. A coincidence? Maybe, maybe not. How Did We Arrive at the 135K–150K Target? We based this range on historical halving cycle returns: Halving Year - Return to Cycle Top 2012 - 9,076% 2016 - 2,122% (↓ 4.27x) 2020 - 541% (↓ 3.92x) Two things stand out: Each cycle has shown diminishing returns. The rate of decline appears roughly consistent, dropping by around 4x each time—but slightly less with each cycle. So depending on the multiplier used: If returns fall by 4.27x again → target: 135K If reduced by 4x → target: 140K If reduced by 3.92x → target: 142K If the rate of reduction itself slows (difference of 0.35 between 4.27 and 3.92) → target: 150K While the sample size is too small, we believe the model holds reasonable logic with fundamental backing from various metrics. The chart now shows a possible ABCD pattern: If it becomes a classic AB = CD structure, point D could form near 135K. If it becomes an extended ABCD (with CD = AB × 1.272), then point D could reach just above 150K. These technical targets align closely with our halving model projections, increasing our confidence in the 135K–150K range as a likely top zone for this cycle. Also, please check our earlier post for possible altseason start. A correlation between BTC/ETH and Gold/Silver might give some tips about possible Ether surge.
