
exprwebdev
@t_exprwebdev

What symbols does the trader recommend buying?
Purchase History
پیام های تریدر
Filter
exprwebdev
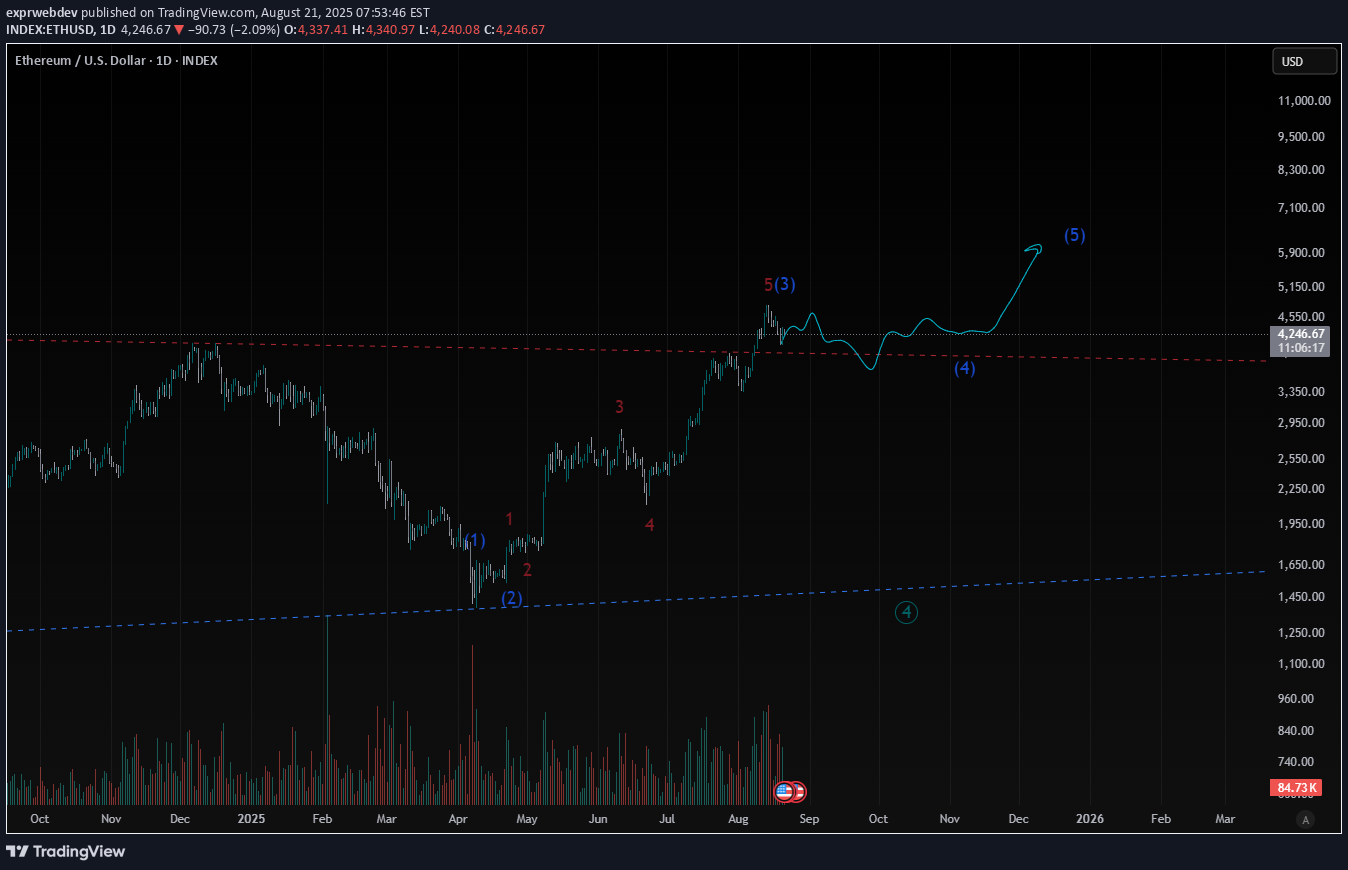
ETHUSD: Is This The Start Of Ethereum's Move To $6,000?
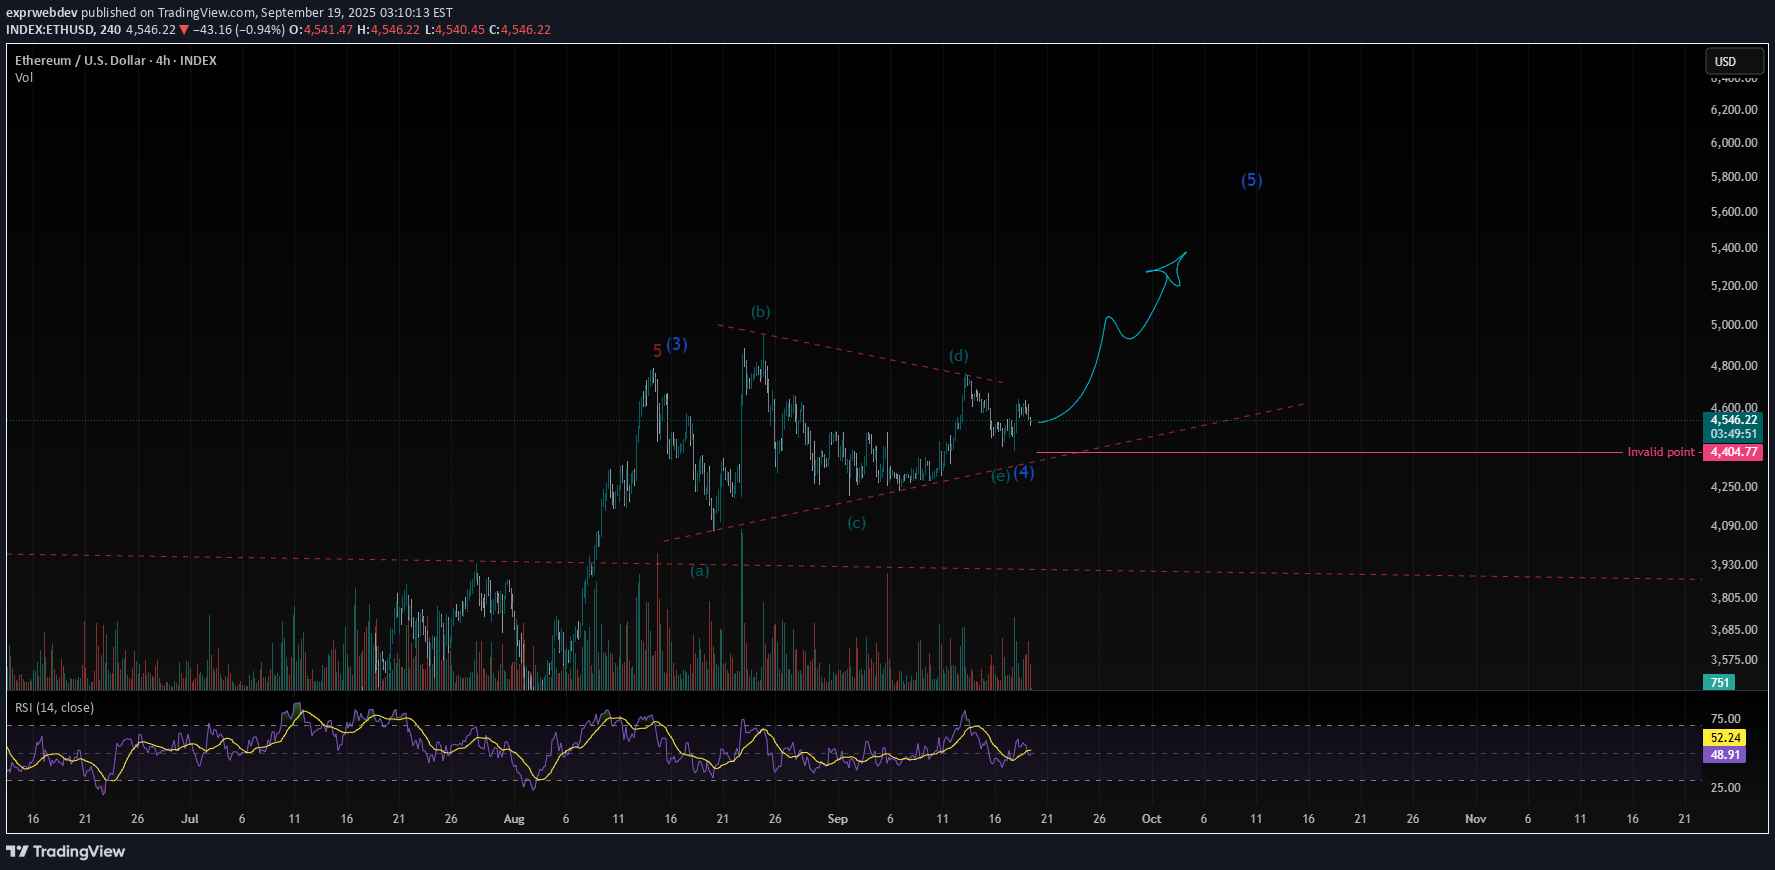
The recent consolidation on the ETH chart appears to be a completed triangle pattern (4th wave), suggesting that the corrective phase is over. We are now in a prime position for the final impulse leg of this cycle. This setup points to the start of a strong 5th wave upswing. Key Levels to Watch: Minimum Target: $6,000 🎯 Invalidation Point: A break below $4,404.77 would invalidate this entire setup and require a new count. Disclaimer This is for informational and educational purposes only and is not financial advice. All trading and investment decisions should be made based on your own research and due diligence. The analysis presented here is based on a specific technical theory and is not a guarantee of future results. Trading cryptocurrencies involves substantial risk and you may lose money. Always consult with a qualified financial professional before making any investment decisions.
exprwebdev
FLUX: The Next Big Move for FLUX Is Here?
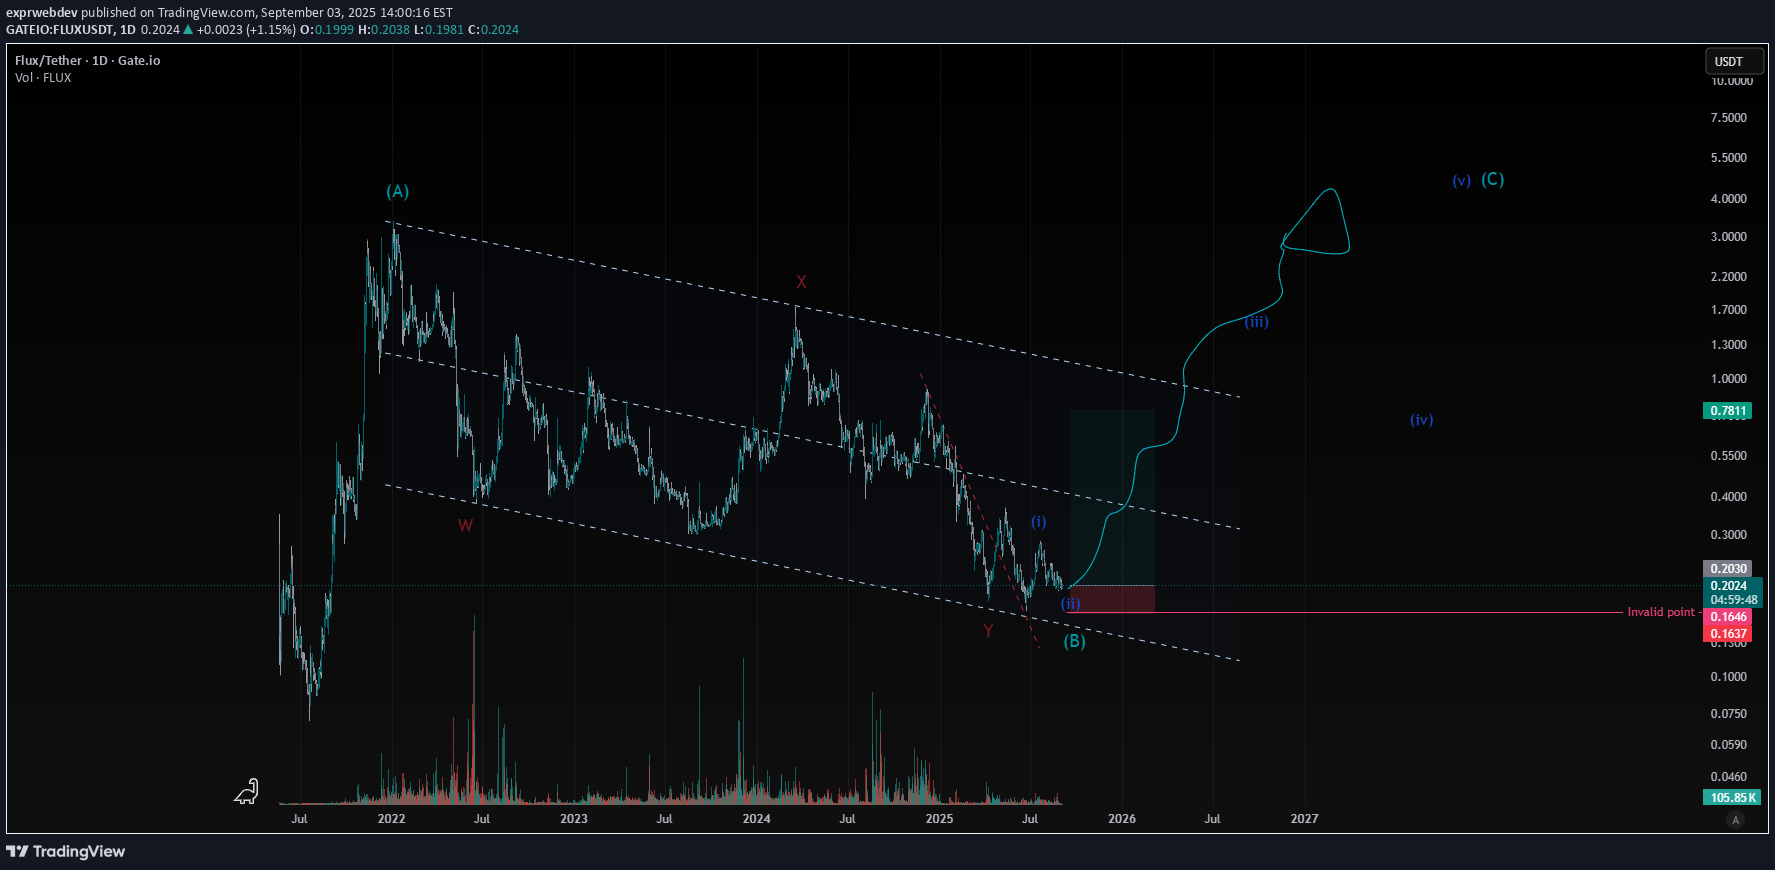
This analysis suggests that Flux (FLUX) may have completed a major "B-wave" correction and could be entering a new "C-wave" to the upside. Key Points: The current price action is the start of a bullish C-wave. Invalidation Point: My analysis is invalidated if the price falls and closes below $0.1619. This is my stop-loss level. Disclaimer: This content is for educational and informational purposes only and is not financial advice. Elliott Wave Theory is a subjective form of technical analysis, and past performance is not indicative of future results. The cryptocurrency market is highly volatile, and trading involves significant risk, including the potential loss of all your capital. You should always conduct your own research (DYOR) and consult with a qualified professional before making any investment decisions. #FLUX #Crypto #ElliottWave #TechnicalAnalysis #TradingView #Cryptocurrency #BTC #Altcoin #Trading #Investing
exprwebdev
XRPUSD: Is The Final Rally Starting?
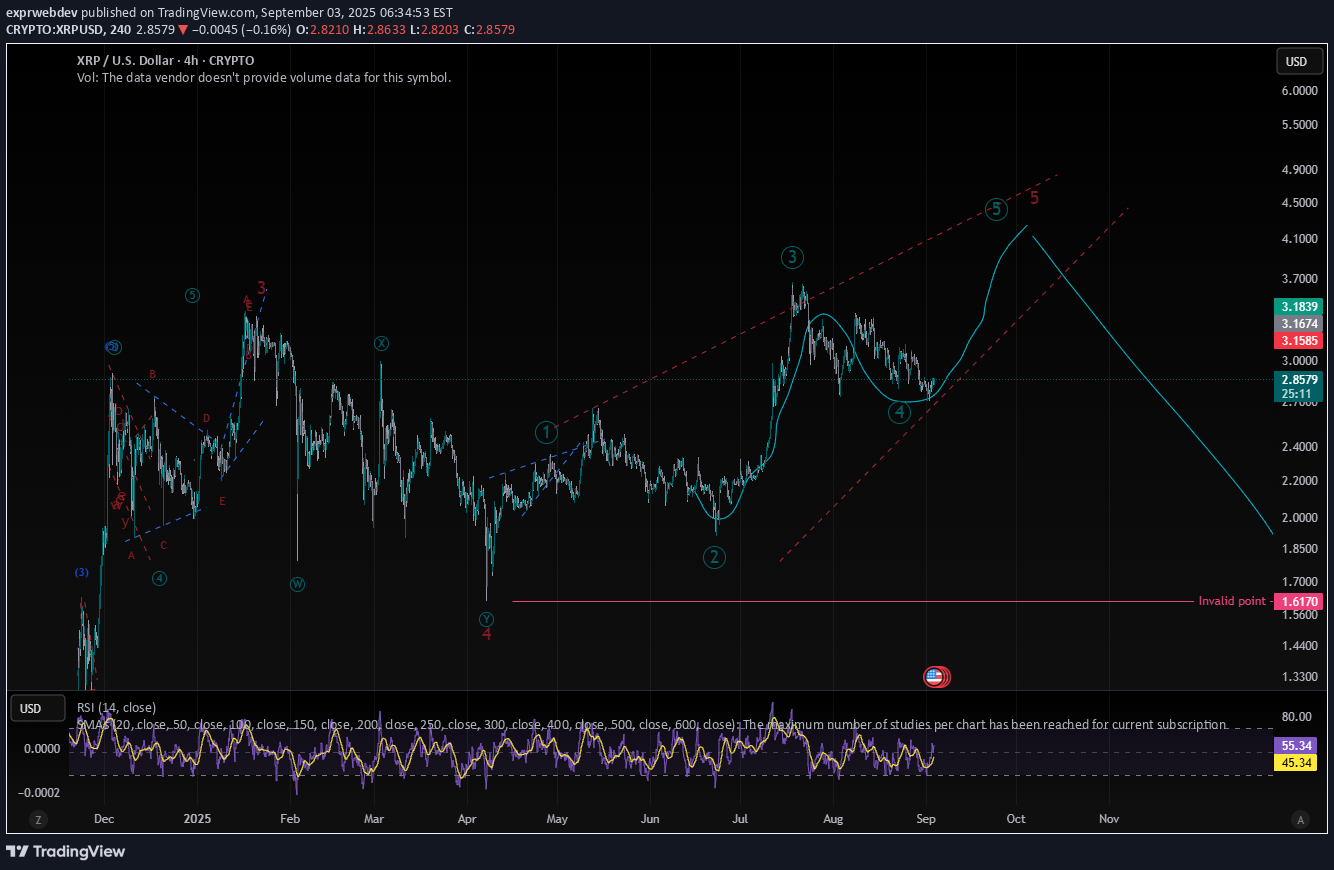
XRP looks to be completing its Wave 4 correction. The next move up is a potential Wave 5 impulse. Wave 5 is the final leg of the trend. Watch for momentum divergence. A new price high with a lower RSI could signal the end of this wave. Disclaimer: This is not financial advice. Trading cryptocurrencies is highly speculative and involves substantial risk. You could lose some or all of your money. Always conduct your own research before investing. #XRP #ElliottWave #Crypto #Trading #Ripple #XRPCommunity #CryptoTrading #TechnicalAnalysis
exprwebdev
FIL: The Zigzag is Over, New Uptrend Begins!
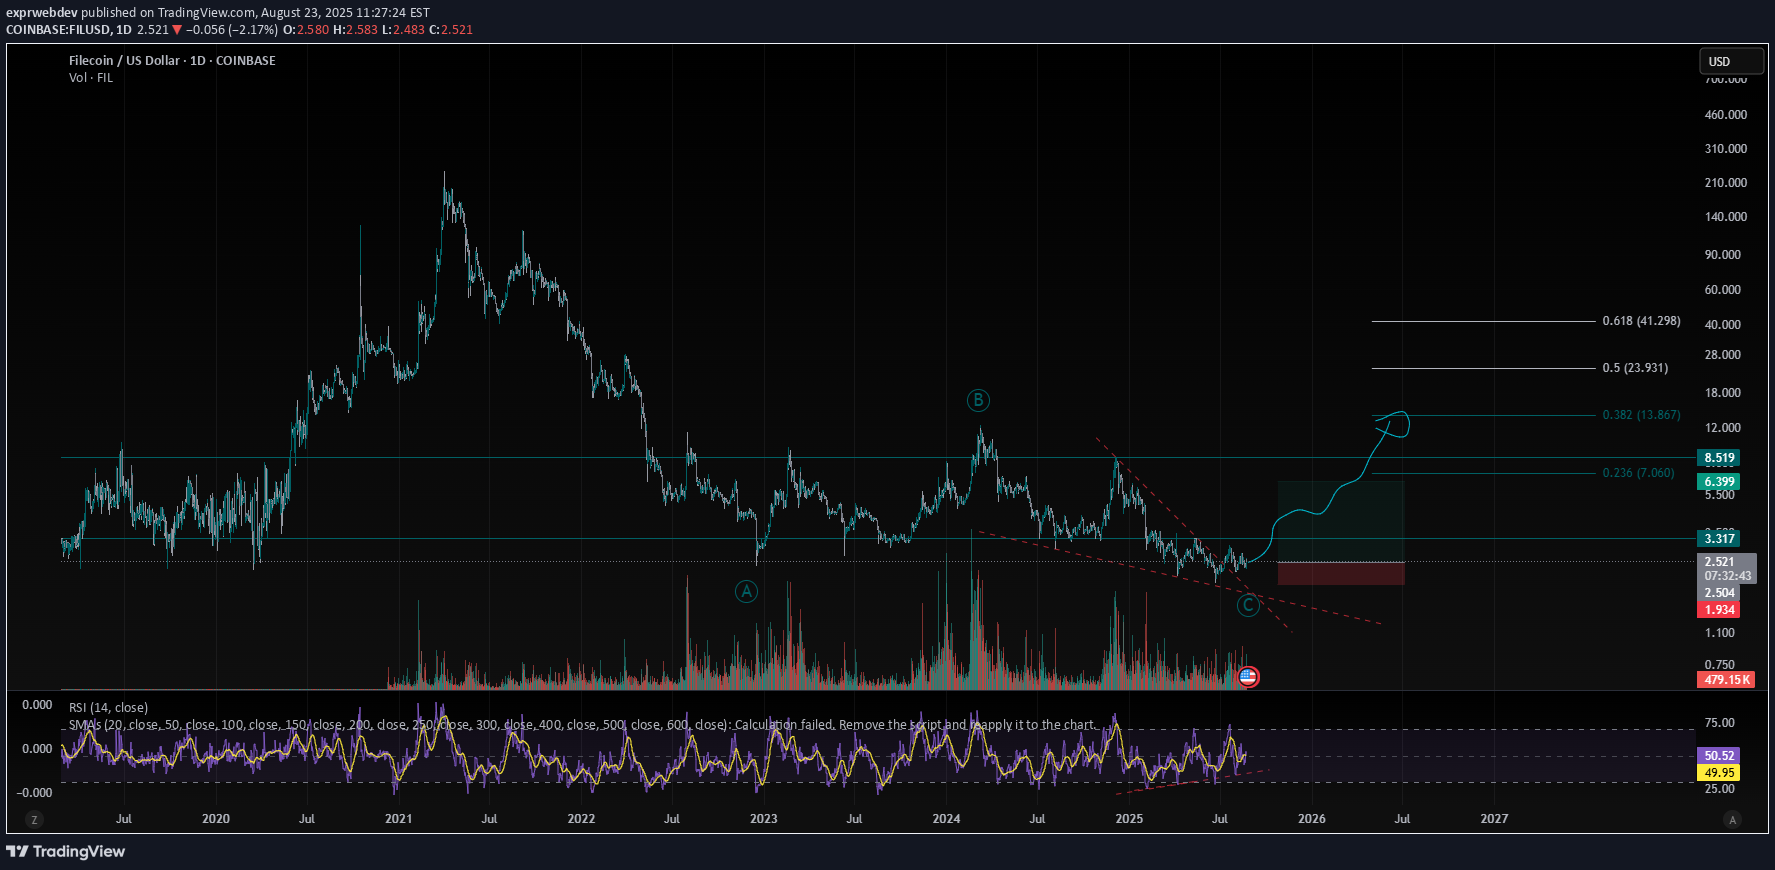
My Elliott Wave analysis shows the long-term zigzag correction is complete, confirmed by a broken diagonal channel. A new uptrend is starting! Key support is $1.90 - $2.20. Invalidation at $1.929. Disclaimer: This is my personal Elliott Wave analysis and is for educational purposes only. It is not financial advice. Trading involves risk, and you should always do your own research and consult a financial professional before making any investment decisions.
exprwebdev
APT: Get Ready for the Bullish C-Wave Impulse
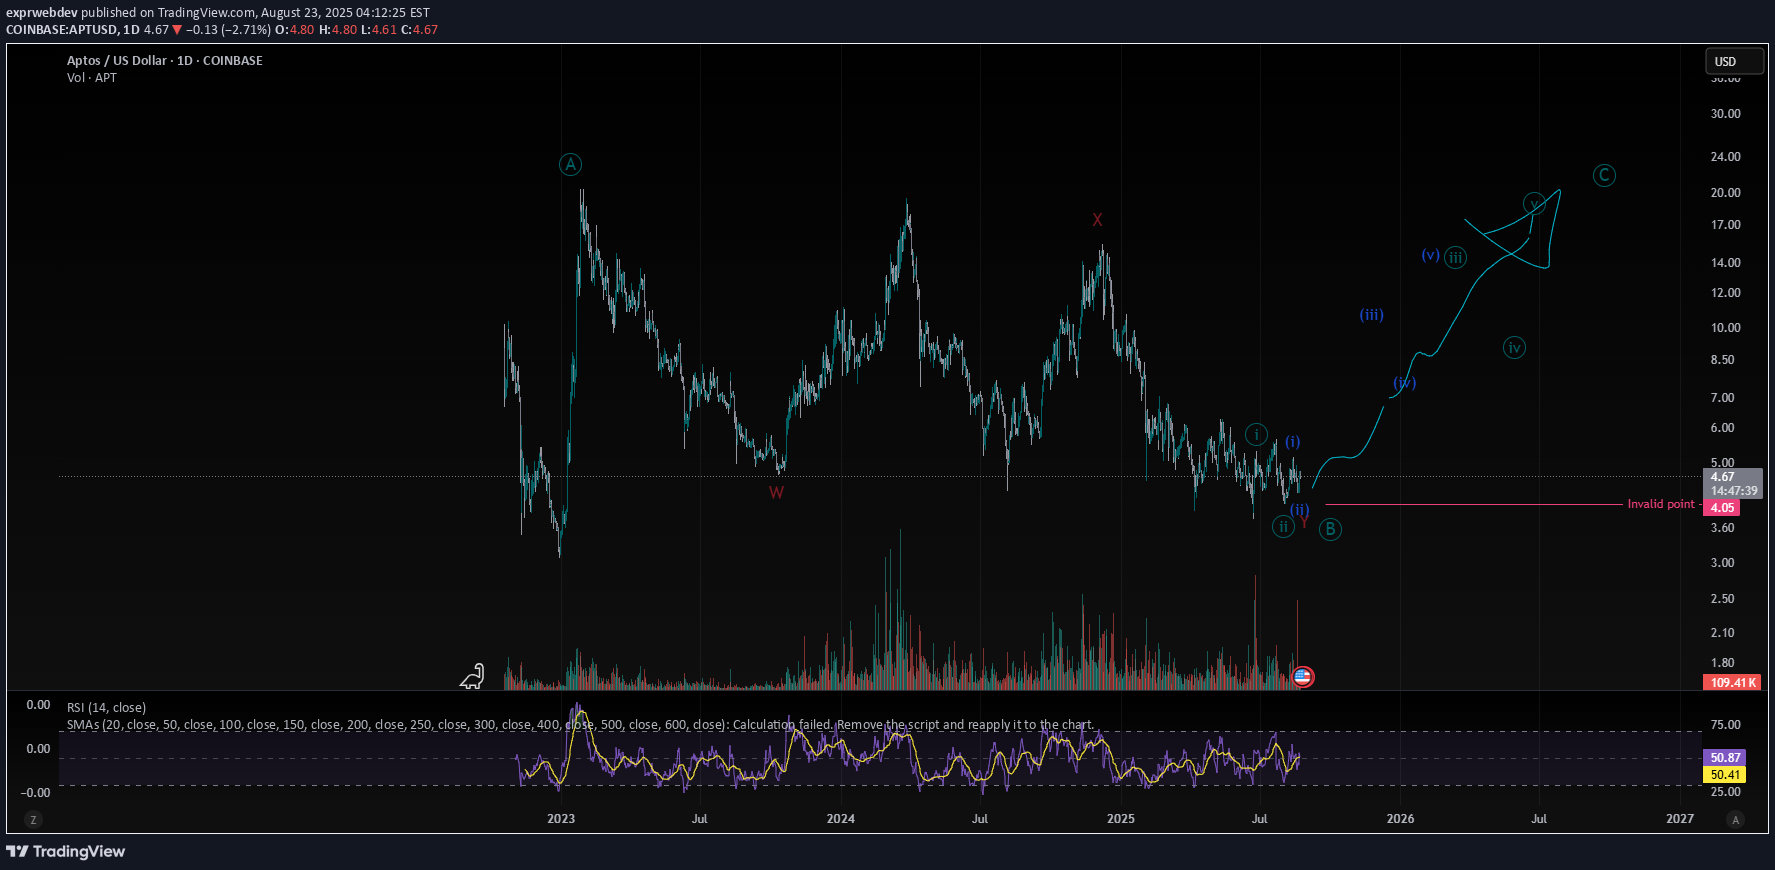
My Elliott Wave count on APT shows a completed zigzag pattern. We've seen a clear A-B-C structure, and it appears the corrective B-wave has ended. The final C-wave impulse is now beginning. This C-wave is a powerful, five-wave motive move to the upside, which often has a 1:1 relationship with the A-wave. I am expecting a significant bullish rally from this point. Key Point: My analysis is invalidated if the price drops below $4.01. A break of this support would suggest a different market structure is at play. Invalidation Point: $4.01 Disclaimer: This is an educational analysis based on Elliott Wave Theory and not financial advice. Trading involves risk, and you should always do your own research.
exprwebdev
BTC: Are We Entering the Last Leg of This Bull Run?
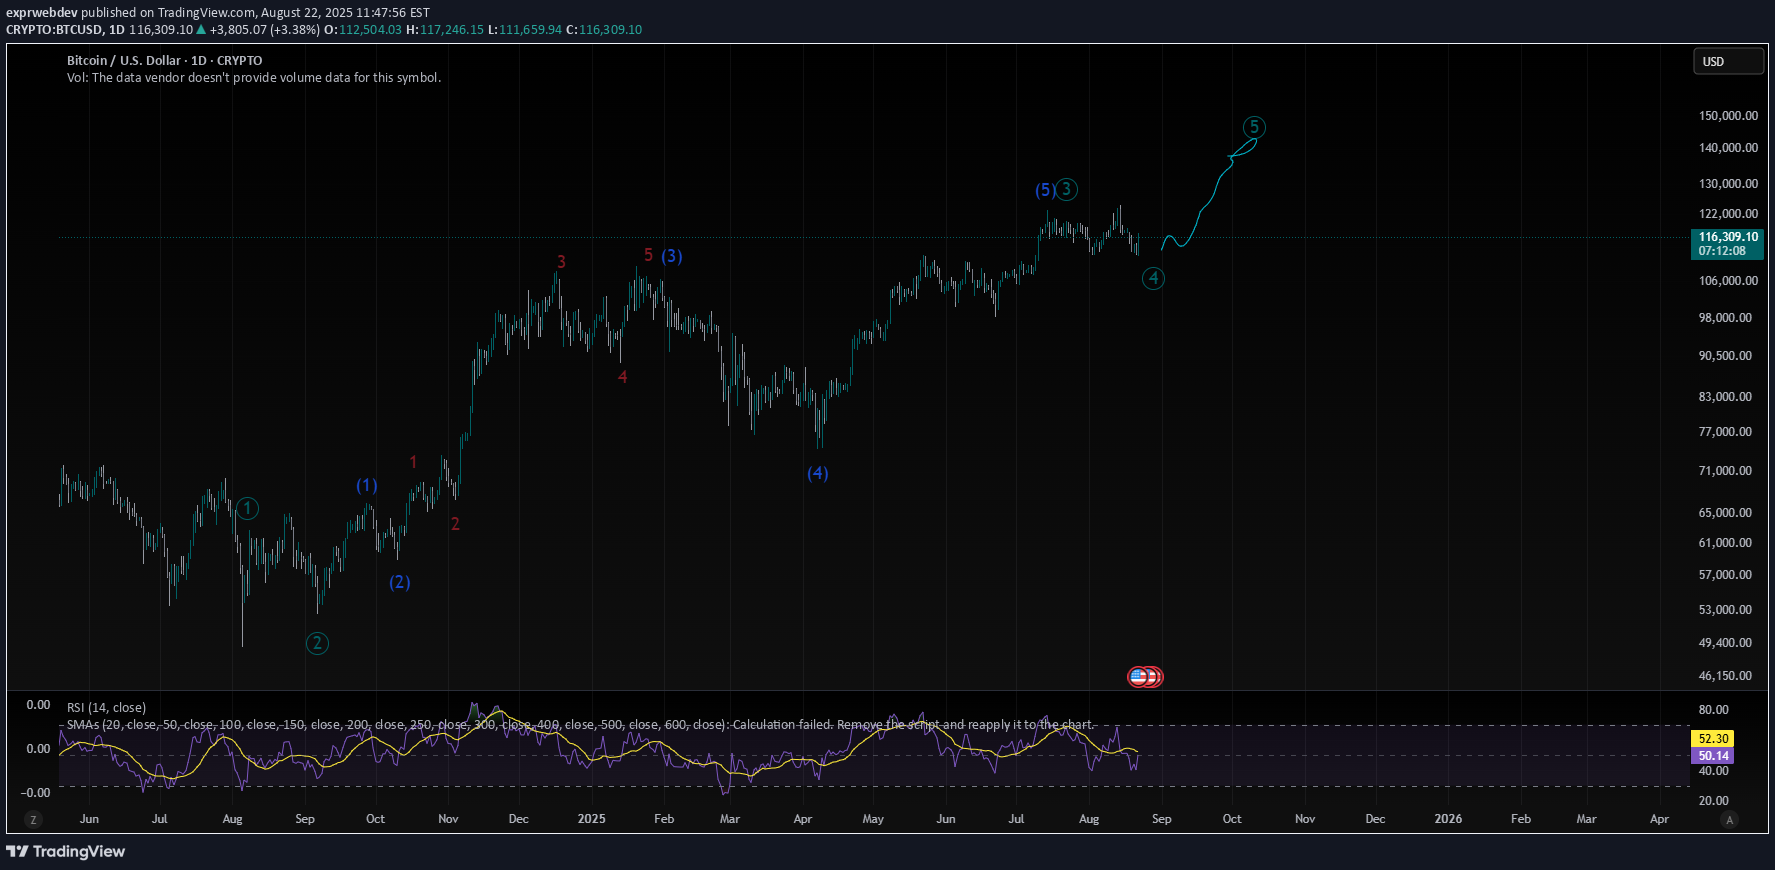
Based on my Elliott Wave analysis, I believe Bitcoin is on the cusp of its final, fifth wave of the bull rally. The recent consolidation appears to be a healthy Wave 4, setting the stage for a strong, impulsive move to new all-time highs. While my primary count points to this final push, I'm closely monitoring for a potential wave extension. Given the current macro-economic conditions and increasing institutional interest, this last leg could be more powerful than a typical Wave 5, leading to a higher-than-expected price peak. After this final surge, I anticipate a significant market top followed by a major correction. I'm approaching this with a long bias but with strict risk management. Disclaimer: This is not financial advice. This content is for educational and informational purposes only and is based on my personal Elliott Wave analysis. Trading and investing in cryptocurrencies is highly speculative and carries a high degree of risk. The past performance of a security, an industry, a sector, or a financial product does not guarantee future results or returns. Always conduct your own research and consult with a qualified financial advisor before making any investment decisions.
exprwebdev
Litecoin (LTC): On the Verge of a Massive Move?
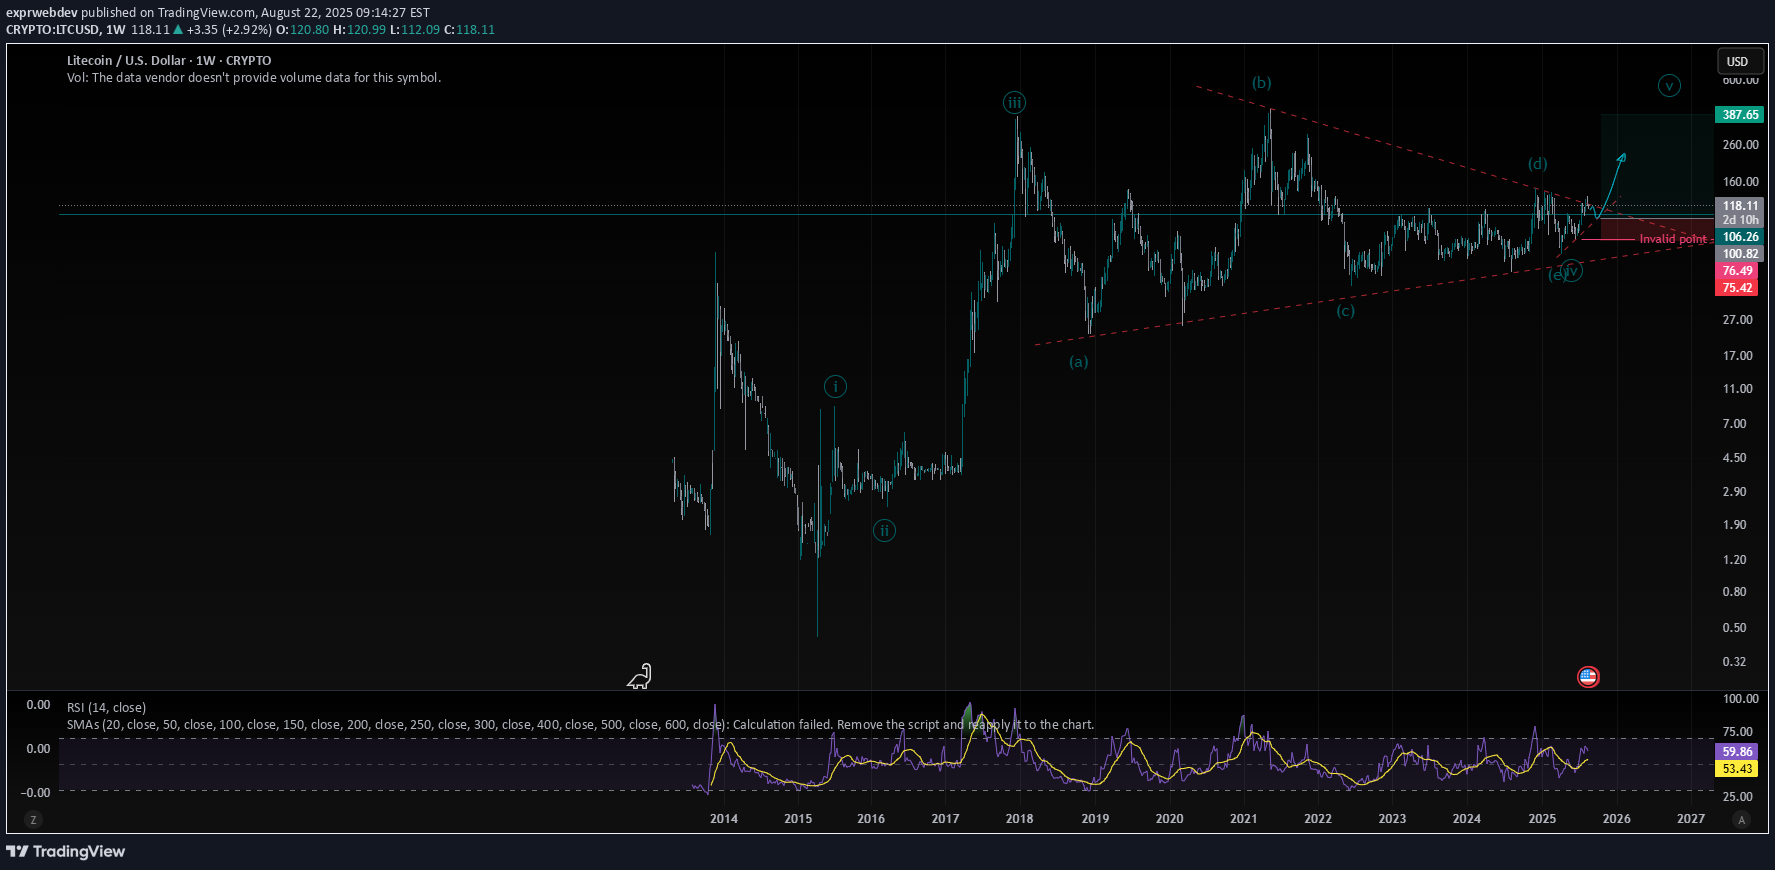
Litecoin (LTC) appears to be on the verge of a significant move, with price action suggesting it is at the apex of a long-term consolidation triangle. While a confirmed breakout has not yet occurred, the setup is highly compelling for a potential 5th wave impulse. Bulls are testing a key resistance level, and a decisive push higher could signal the end of this long corrective period. The invalidation point for this entire thesis remains at $74.78. A drop below this critical support would suggest the bullish setup is off the table. Disclaimer: This is not financial advice. All trading involves risk. The content provided is for educational and informational purposes only. Always conduct your own research (DYOR) and consult with a qualified financial professional before making any investment decisions.
exprwebdev
ETH: Get Ready for the Final Rally (Elliott Wave 5)
ETH is now in the 4th wave of a major uptrend. The next move is expected to be the final and powerful 5th wave. What to watch for: Wave 5 Target: Typically, the 5th wave is less dynamic than the 3rd, but it can still be a strong move. Look for it to be equal in length to Wave 1, or a Fibonacci extension of the combined Waves 1-3. Volume & Momentum: Volume is often lower in a 5th wave compared to the 3rd. Watch for potential divergences on indicators like RSI or MACD as a sign of a nearing top. Invalidation: This count is invalidated if the price of the 4th wave retraces into the price territory of the 1st wave. Disclaimer: This is an Elliott Wave analysis for educational purposes and not financial advice. Do your own research and risk management.
exprwebdev
Link: Major Wave 3 Bull Run Underway, Eyes New Highs
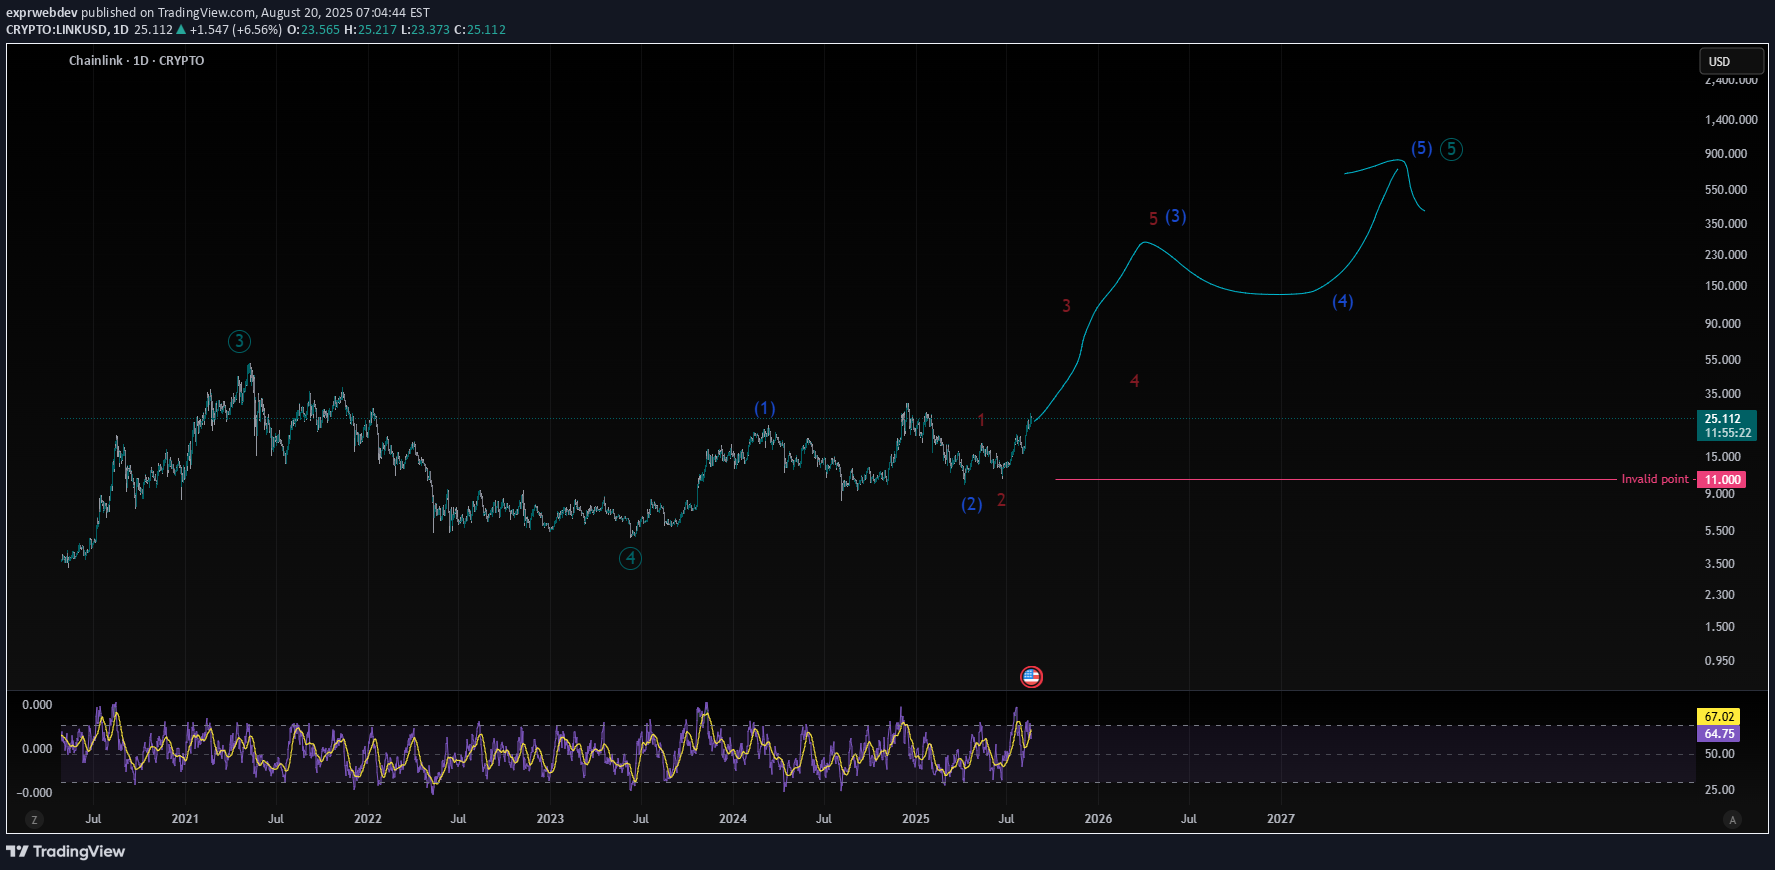
My Elliott Wave analysis of Chainlink (LINK) suggests we're in a powerful major third wave. This is typically the most explosive part of a market trend, marked by strong upward momentum. Rationale: The price has completed a corrective wave 2 and is now extending into wave 3. This indicates strong buying pressure and a potential move to new highs. Invalidation Point: My bullish thesis is invalidated if LINK closes below $10.809. This level is critical. A break below it would suggest a different, more bearish, wave count is in play. Strategy: I'm looking to be long on LINK, targeting significant upside. Always manage your risk with a stop-loss order below the invalidation point. Disclaimer: This is for educational purposes and is not financial advice. Trade at your own risk.
exprwebdev
SOL/USDT: Elliott Wave - Is a new impulse beginning?
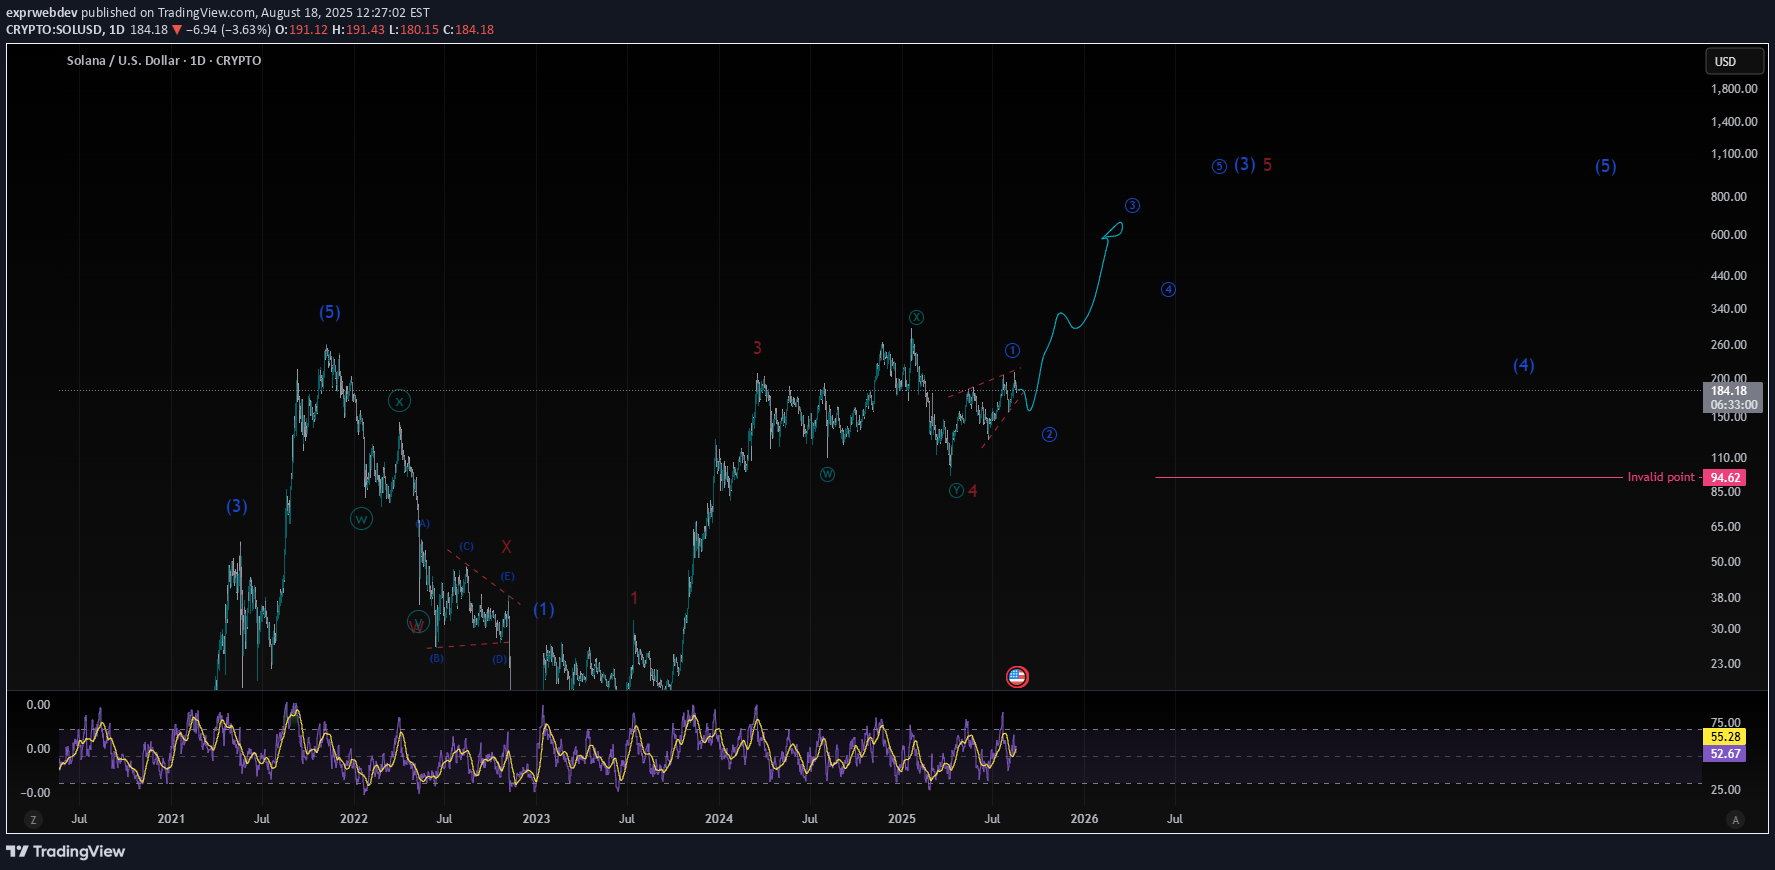
My chart shows SOL appears to have completed Wave 1 and is currently in a healthy Wave 2 correction. The invalidation point is marked on the chart at $93.55. A break below this level would invalidate this bullish count. I'm looking for a potential entry as Wave 2 completes, with a tight stop loss just below that key level. Wave 3 is next, and that's where the explosive move up should happen. Trade safe! Disclaimer: This is not financial advice. I am not a financial advisor. This is my personal analysis for educational purposes only. Always do your own research and manage your risk.
Disclaimer
Any content and materials included in Sahmeto's website and official communication channels are a compilation of personal opinions and analyses and are not binding. They do not constitute any recommendation for buying, selling, entering or exiting the stock market and cryptocurrency market. Also, all news and analyses included in the website and channels are merely republished information from official and unofficial domestic and foreign sources, and it is obvious that users of the said content are responsible for following up and ensuring the authenticity and accuracy of the materials. Therefore, while disclaiming responsibility, it is declared that the responsibility for any decision-making, action, and potential profit and loss in the capital market and cryptocurrency market lies with the trader.