
dgfacpe
@t_dgfacpe

What symbols does the trader recommend buying?
Purchase History
پیام های تریدر
Filter
Ethereum Falls Again!
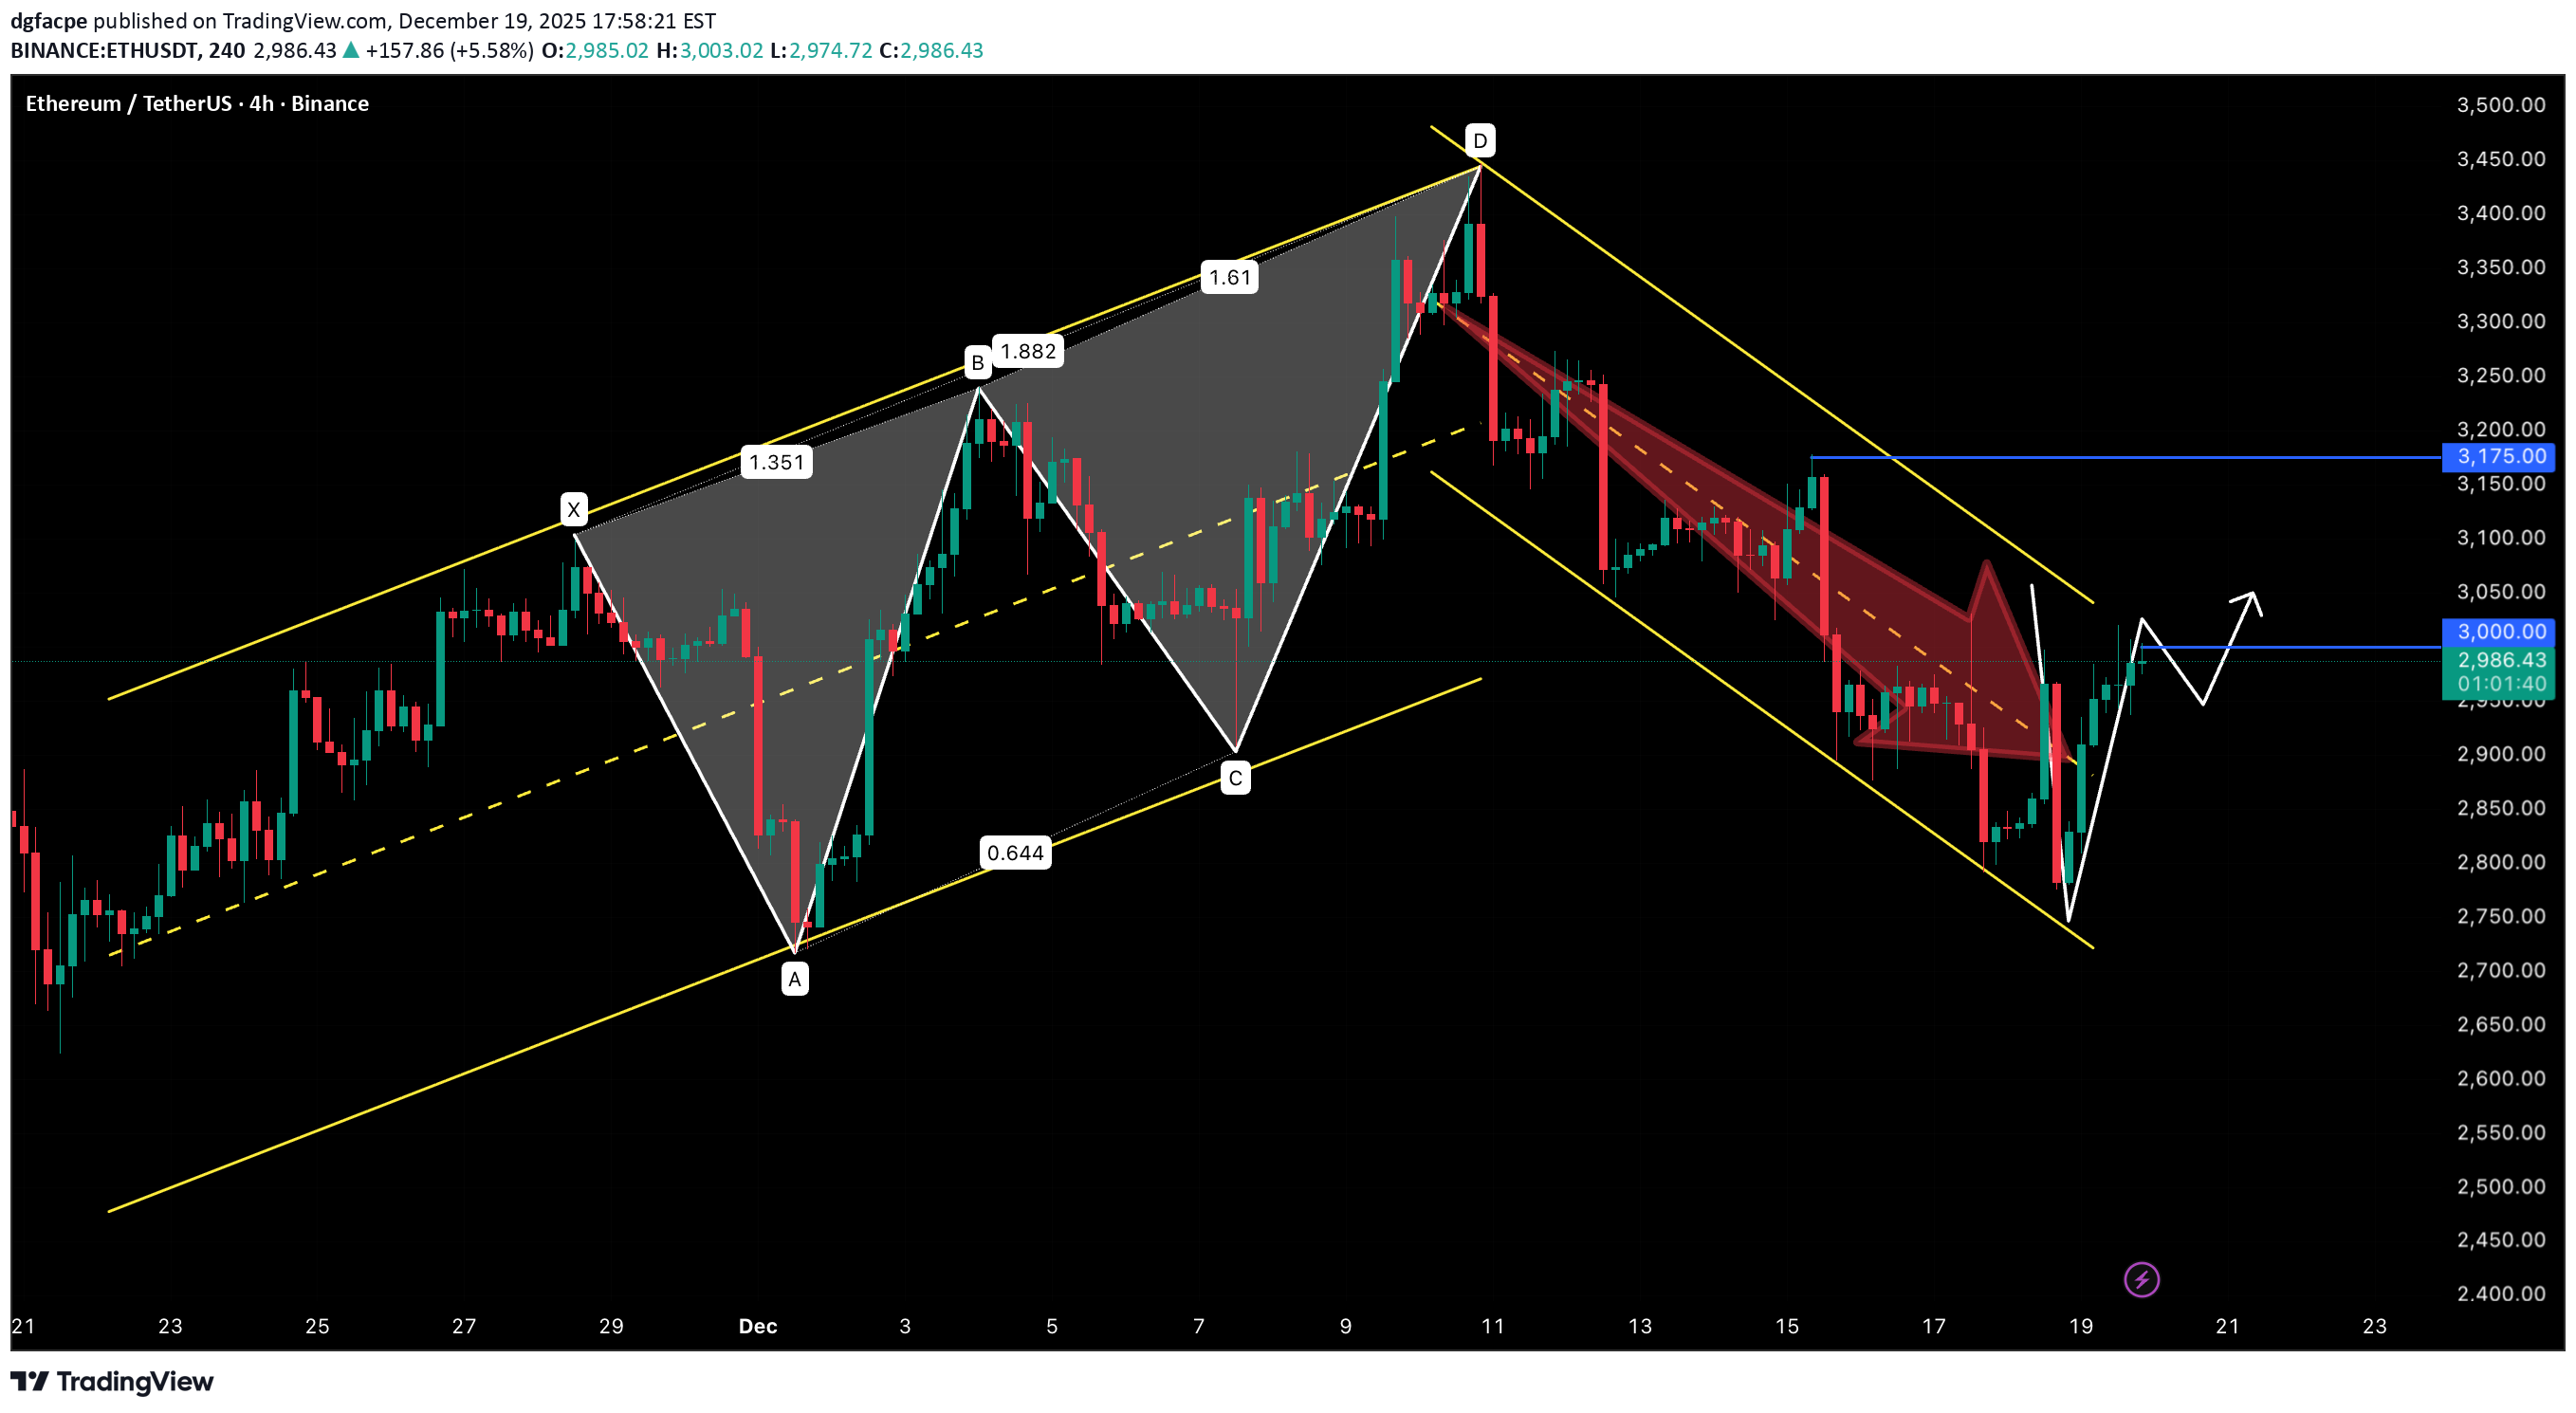
Both Bitcoin and Ethereum ETFs have moved further into negative territory as investor caution resurfaced, while Solana and XRP continued to attract steady inflows. This trading session reflects that the market is still selectively rotating rather than completely exiting cryptocurrency exposure. Momentum in the ETF market cooled rapidly, with Bitcoin's brief rally giving way to another day of redemptions. Ethereum followed suit, continuing its downward trend, even as funds continued to flow into alternative cryptocurrency funds, balancing broader market activity rather than showing a clear bearish bias. Bitcoin ETFs recorded net outflows of $161.32 million, primarily dragged down by a massive sell-off in Fidelity's FBTC. The fund lost $170.28 million in a single day, exceeding the day's net decline. Additional pressure came from Ark & 21Shares' ARKB and Bitwise's BITB, which lost $12.27 million and $11.54 million respectively. While Blackrock's IBIT attempted to offset the weakness with an inflow of $32.76 million, it was not enough to reverse the trend. Trading remained active, with volume reaching $5.16 billion, while net assets fell to $111.04 billion. The Ethereum ETF saw net outflows for the sixth consecutive trading day, recording a net outflow of $96.62 million. Blackrock's ETHA was again in focus, recording a large outflow of $102.24 million. This pressure was partially offset by moderate inflows into Grayscale products, with the Ether Mini Trust and ETHE adding $2.89 million and $2.74 million respectively. Despite continued redemptions, trading activity remained stable, with volume at $2.15 billion and net assets holding steady at $17.07 billion. Overall, this day highlighted a familiar pattern. Bitcoin and Ethereum continued to face tactical pullbacks, while Solana and XRP benefited from investors selectively repositioning within the digital asset ETF space rather than exiting entirely. Therefore, the cryptocurrency market does not move in a uniform fashion; what we need to do is trade precisely in the volatile crypto market to profit! The exact price is not important to us traders; we can profit from both rises and falls!My friend, Christmas is just around the corner, and we've made a substantial profit during this trading period. Listen, December will also see many news events, potentially making it an even more lucrative time. However, without the right methods, you won't make money. If you want to make money, follow me. Your profits will double, and your returns will continue to grow. If you persevere, you can expect to earn at least 150% to 300% profit during this period. You can contact me, and I will help you! t.me/+-CYRAGyBuqtlNmU8 Signals free on Telegram: t.me/+f1MGvACIxPQ5ZWM8
Bitcoin Falls Again!
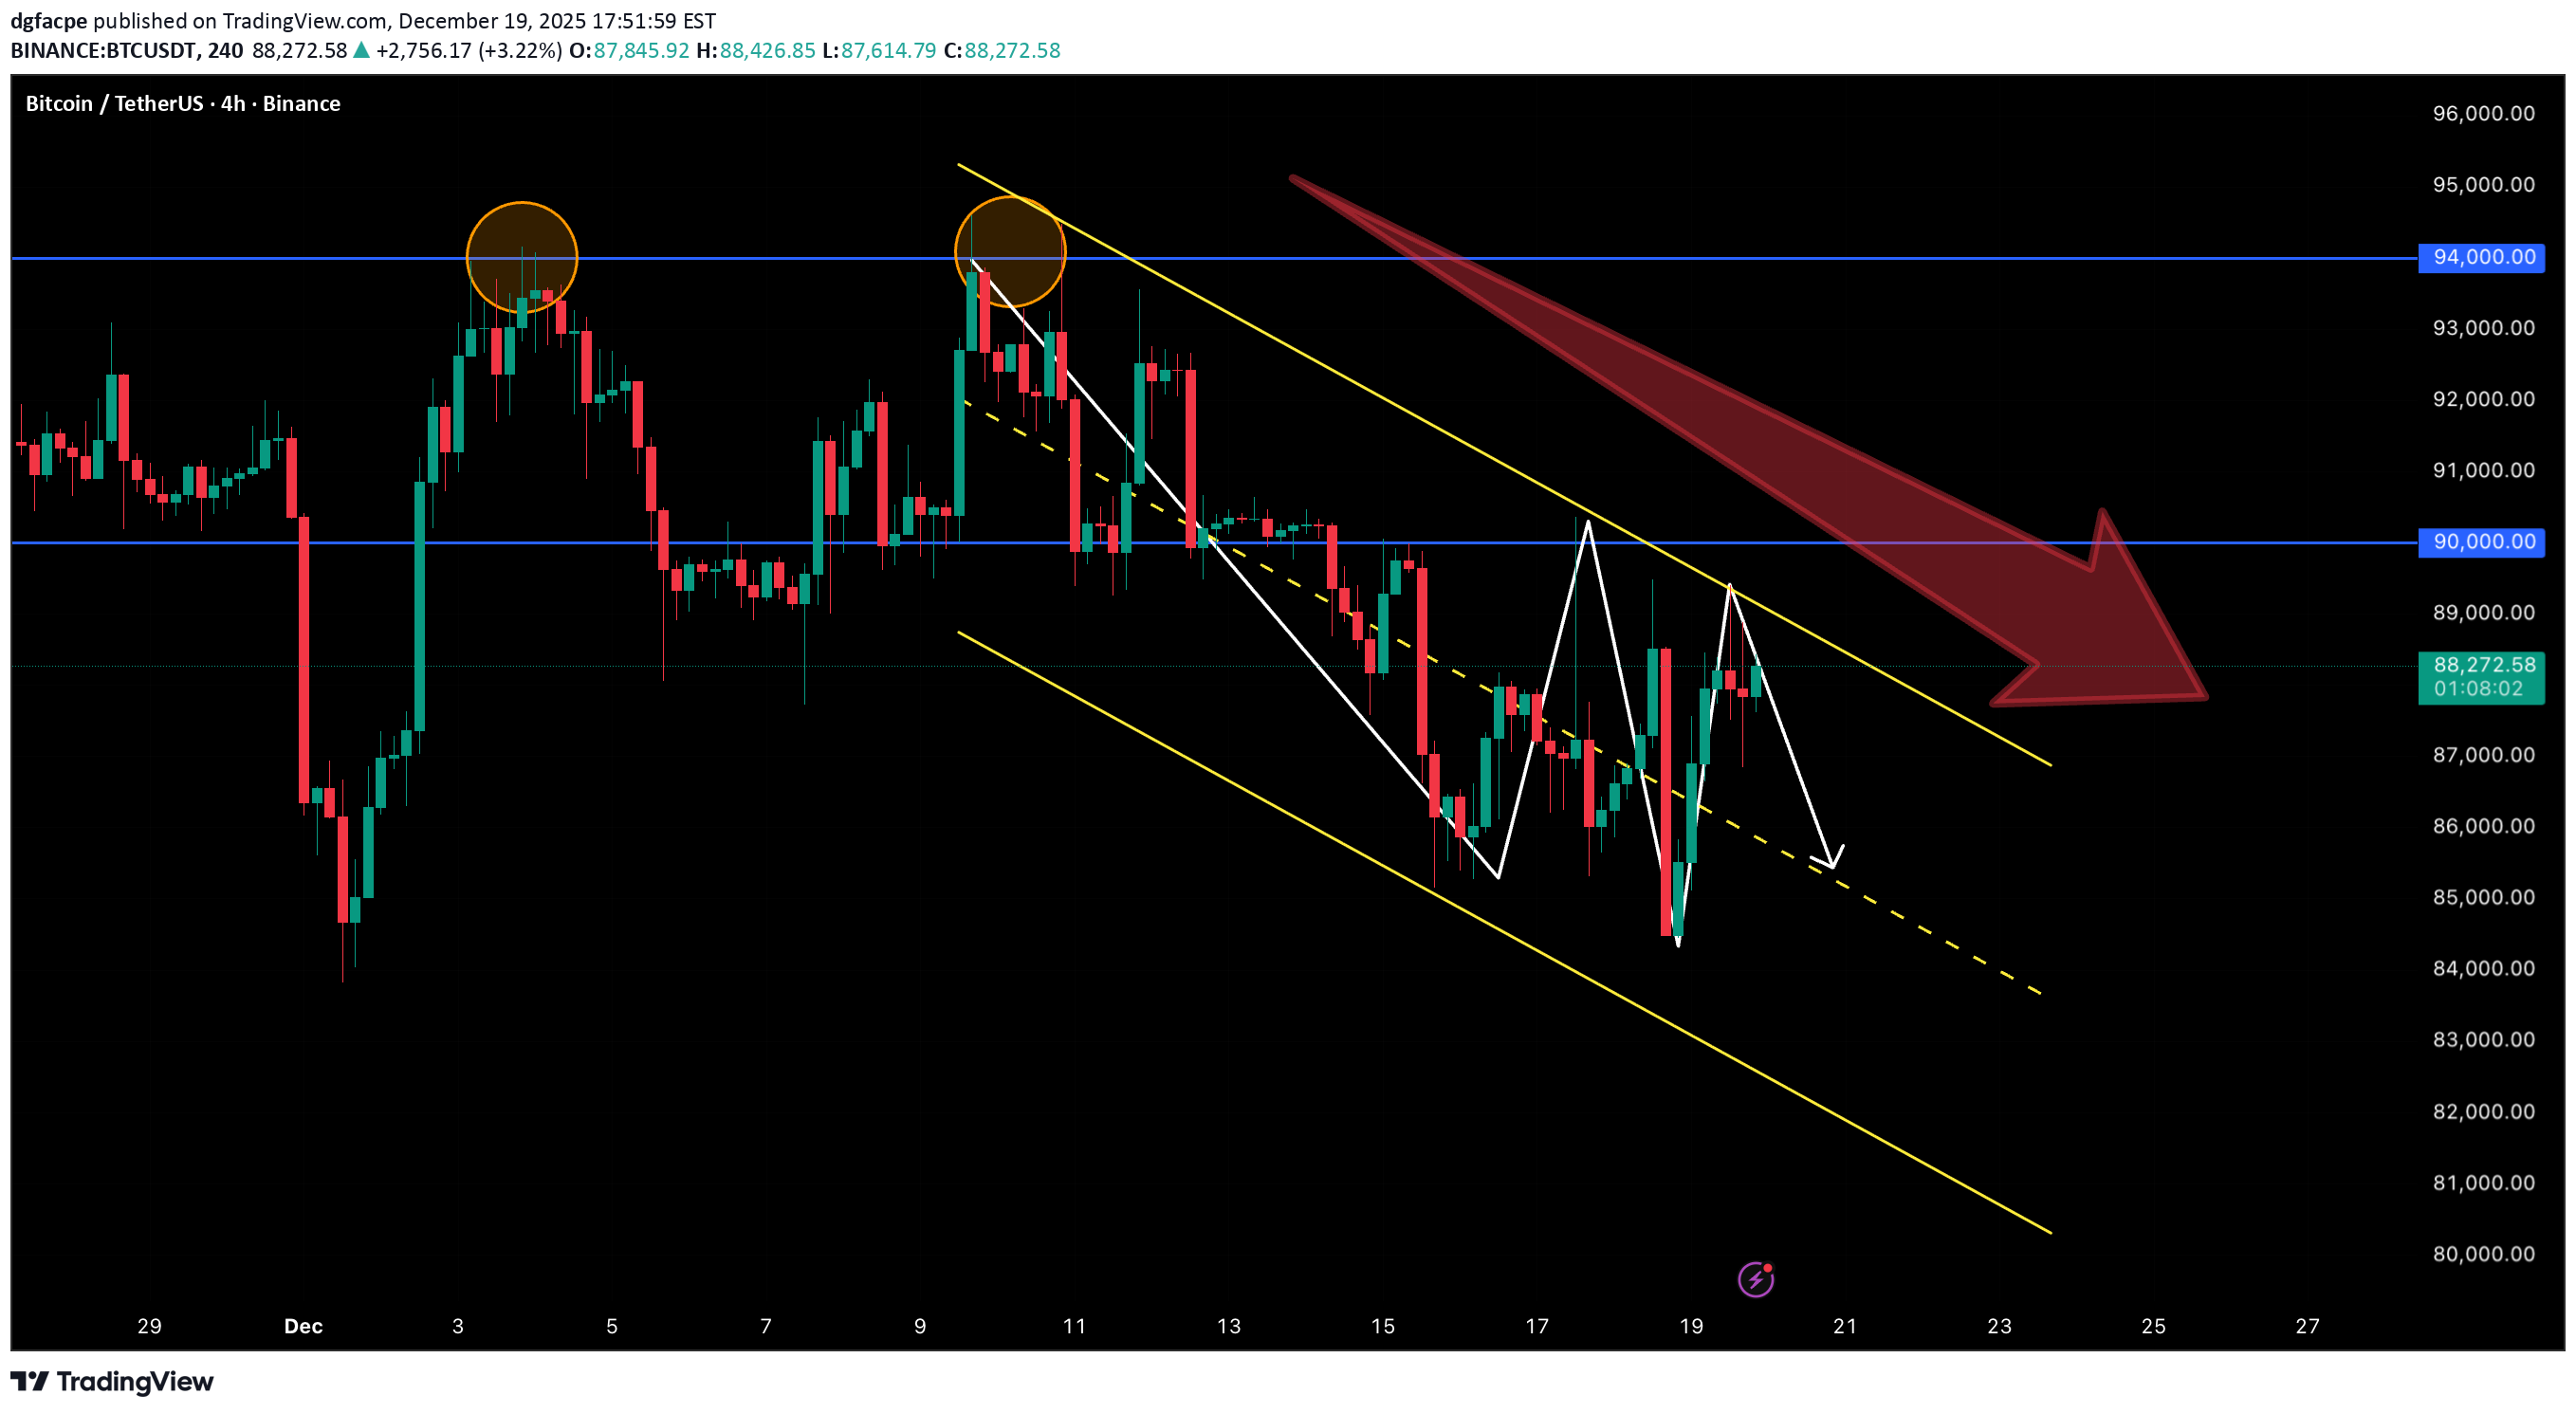
Both Bitcoin and Ethereum ETFs have moved further into negative territory as investor caution resurfaced, while Solana and XRP continued to attract steady inflows. This trading session reflects that the market is still selectively rotating rather than completely exiting cryptocurrency exposure. Momentum in the ETF market cooled rapidly, with Bitcoin's brief rally giving way to another day of redemptions. Ethereum followed suit, continuing its downward trend, even as funds continued to flow into alternative cryptocurrency funds, balancing broader market activity rather than showing a clear bearish bias. Bitcoin ETFs recorded net outflows of $161.32 million, primarily dragged down by a massive sell-off in Fidelity's FBTC. The fund lost $170.28 million in a single day, exceeding the day's net decline. Additional pressure came from Ark & 21Shares' ARKB and Bitwise's BITB, which lost $12.27 million and $11.54 million respectively. While Blackrock's IBIT attempted to offset the weakness with an inflow of $32.76 million, it was not enough to reverse the trend. Trading remained active, with volume reaching $5.16 billion, while net assets fell to $111.04 billion. The Ethereum ETF saw net outflows for the sixth consecutive trading day, recording a net outflow of $96.62 million. Blackrock's ETHA was again in focus, recording a large outflow of $102.24 million. This pressure was partially offset by moderate inflows into Grayscale products, with the Ether Mini Trust and ETHE adding $2.89 million and $2.74 million respectively. Despite continued redemptions, trading activity remained stable, with volume at $2.15 billion and net assets holding steady at $17.07 billion. Overall, this day highlighted a familiar pattern. Bitcoin and Ethereum continued to face tactical pullbacks, while Solana and XRP benefited from investors selectively repositioning within the digital asset ETF space rather than exiting entirely. Therefore, the cryptocurrency market does not move in a uniform fashion; what we need to do is trade precisely in the volatile crypto market to profit! The exact price is not important to us traders; we can profit from both rises and falls!My friend, Christmas is just around the corner, and we've made a substantial profit during this trading period. Listen, December will also see many news events, potentially making it an even more lucrative time. However, without the right methods, you won't make money. If you want to make money, follow me. Your profits will double, and your returns will continue to grow. If you persevere, you can expect to earn at least 150% to 300% profit during this period. You can contact me, and I will help you! t.me/+-CYRAGyBuqtlNmU8 Signals free on Telegram: t.me/+f1MGvACIxPQ5ZWM8
A pullback after a surge presents a good buying opportunity!
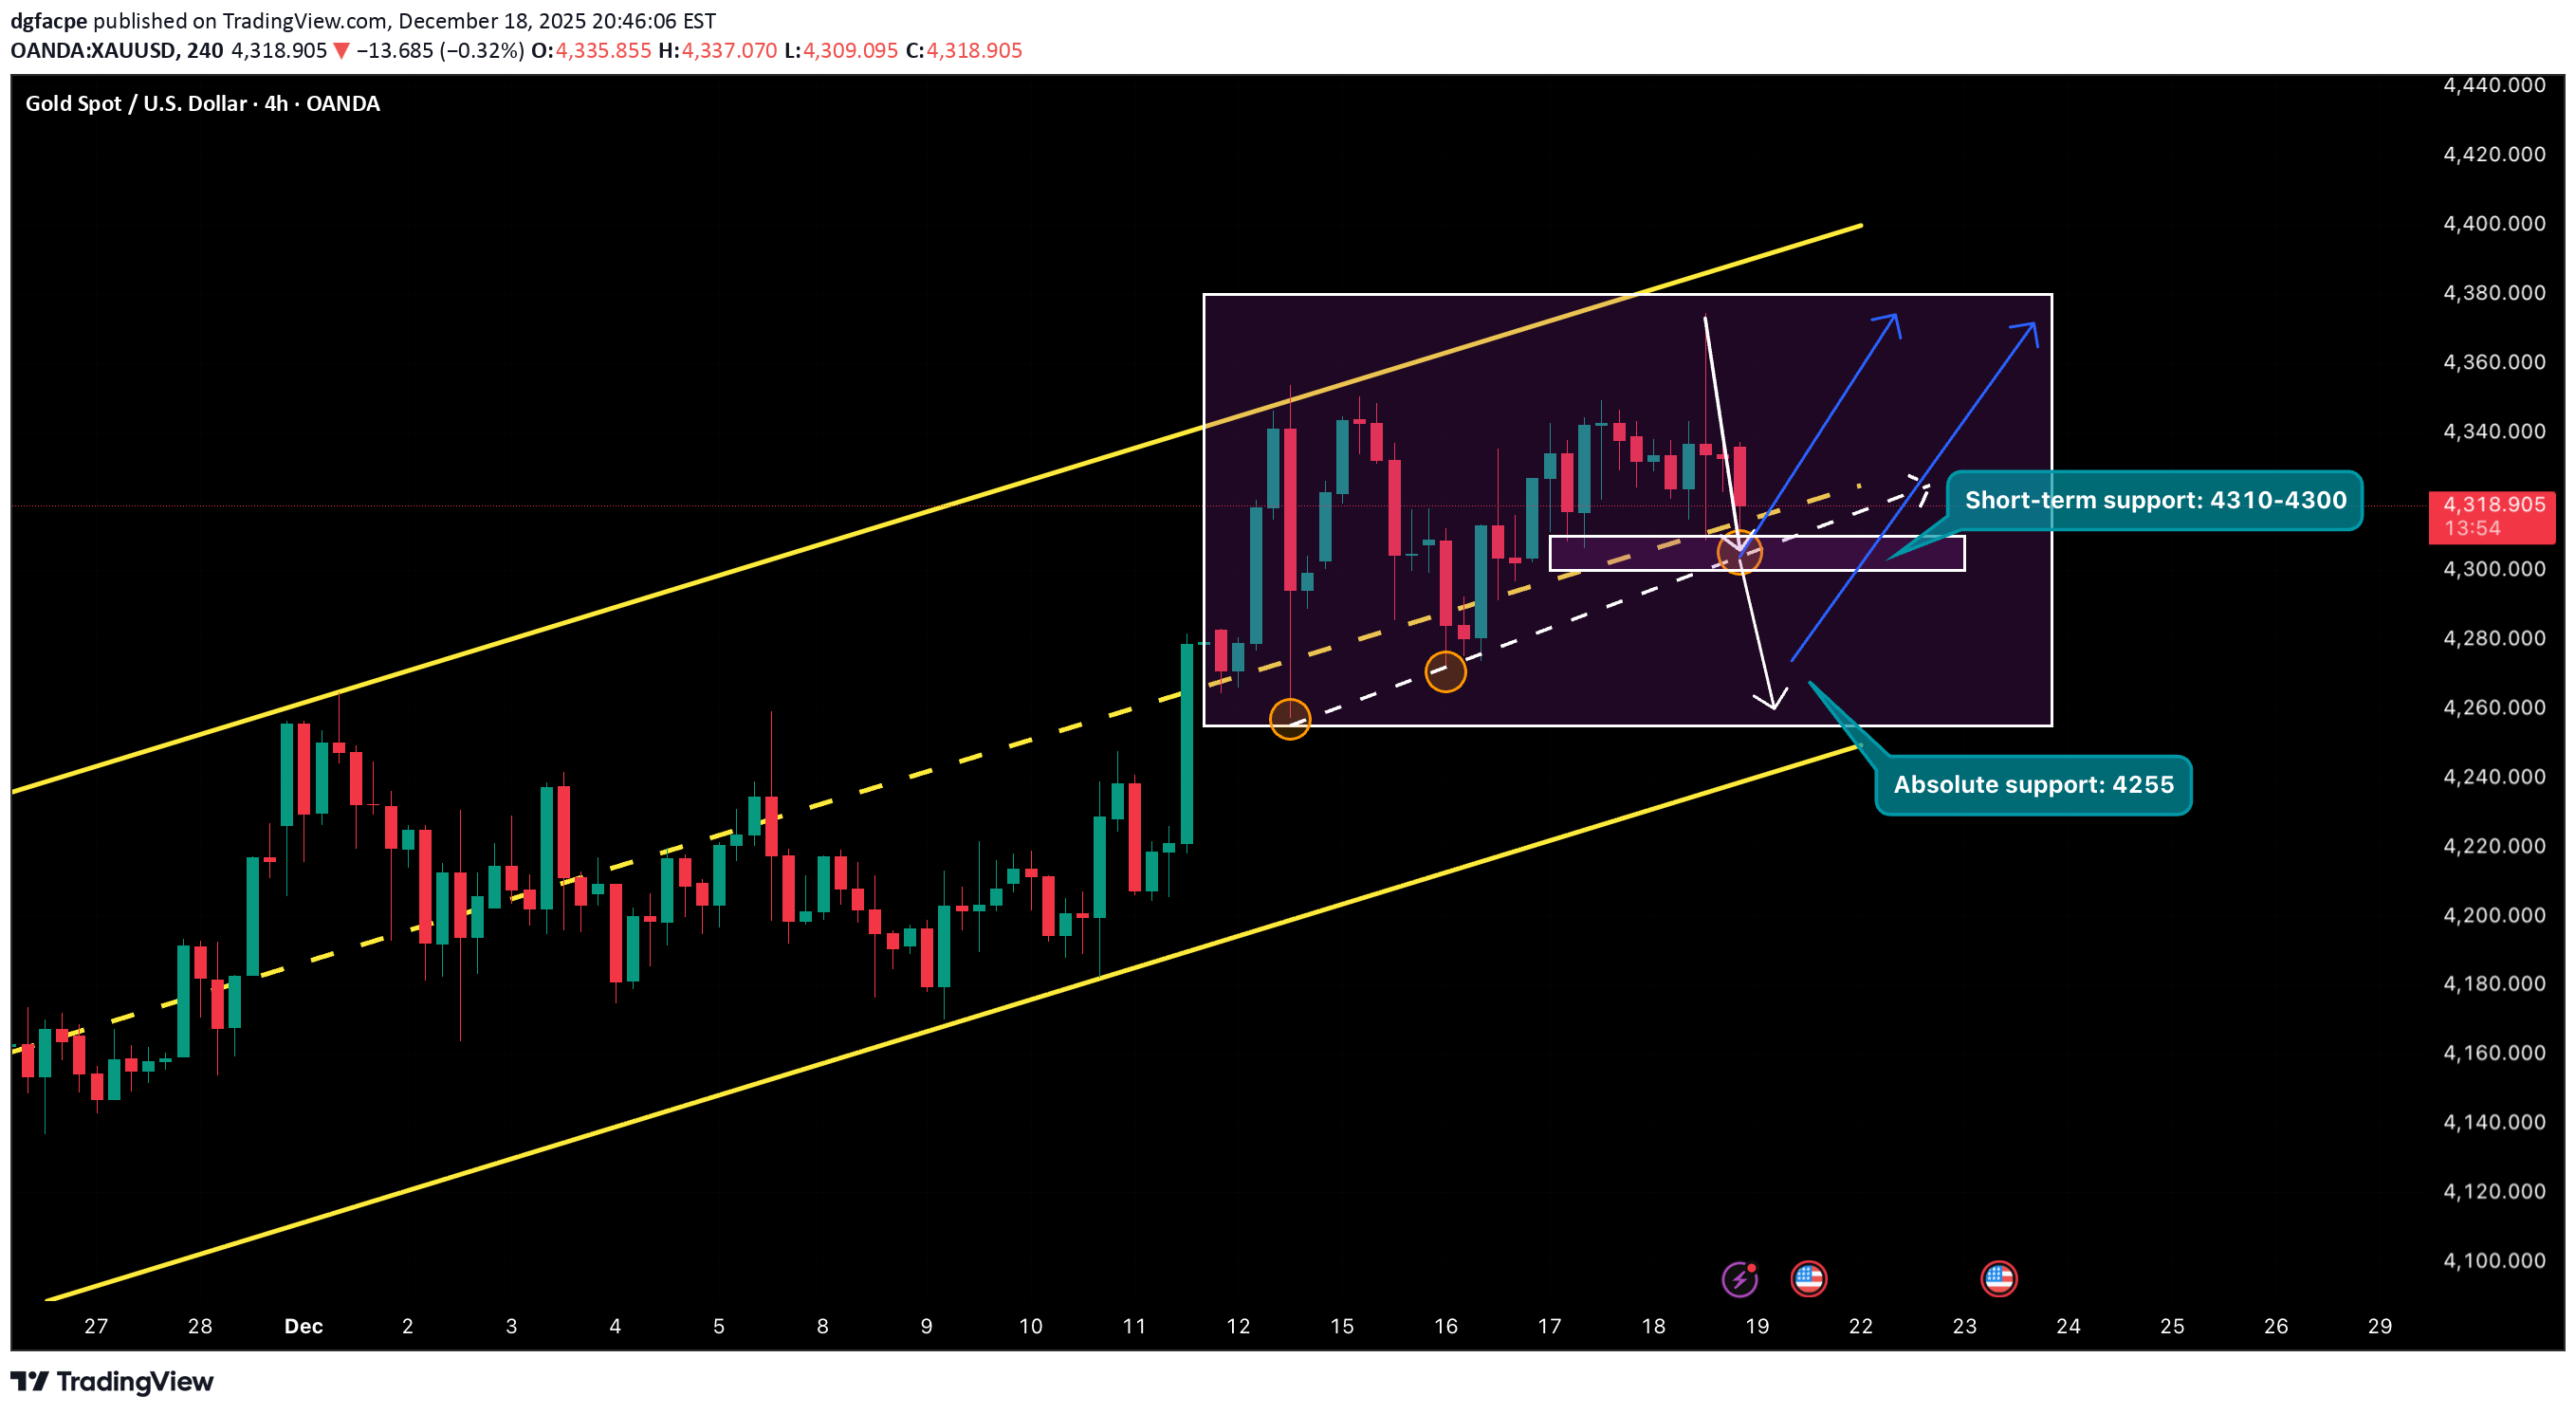
The US November unadjusted core CPI annual rate came in at 2.6%, the lowest since March 2021. The European Central Bank kept interest rates unchanged, in line with market expectations. ECB officials stated that the rate-cutting cycle is likely over. Trump Media Technology Group plans to acquire nuclear fusion startup TAE; the merged entity will begin site selection and construction of a fusion power plant in 2026. Federal Reserve's Goolsby: November inflation data was good, but he is uneasy about an earlier rate cut. Terminal interest rates will be far lower than current levels. The Bank of England lowered its benchmark interest rate from 4.00% to 3.75%, in line with market expectations. Governor Bailey stated that the pace of rate cuts will slow! U.S. stocks closed on Thursday with the Dow Jones Industrial Average initially up 0.14%, the S&P 500 up 0.79%, and the Nasdaq Composite up 1.38%. International gold prices surged to 4374.5 before retreating, just shy of breaking through the 4381 high. After encountering resistance at the high, the pullback essentially erased all gains, resulting in another doji candlestick on the daily chart. Yesterday's prediction of 4300 support for gold was very accurate, but the upward momentum was somewhat lacking. However, it still maintained a relatively high level of consolidation, indicating continued strength. The strategy should remain primarily to buy on dips. However, today, Friday's trading day, carries too much uncertainty. Gold prices may see significant movement today, given their prolonged period of consolidation at high levels. A new trend is likely imminent, meaning a breakout from the current trading range. Yesterday's pullback after a surge suggests a potential for further downward movement in the short term. Therefore, while maintaining a bullish outlook, caution is advised, along with robust risk management. Overall, a pullback from higher levels may indicate further consolidation. Position management is recommended above 4300, maintaining a bullish stance. A break below 4300 carries the risk of further significant correction. Short-term support is at 4310-4300. The final long position for the day should be reserved at the key support level of 4258-4260. Short-term support: 4310-4300 Absolute support: 4255My friend, Christmas is just around the corner, and we've made a substantial profit during this trading period. Listen, December will also see many news events, potentially making it an even more lucrative time. However, without the right methods, you won't make money. If you want to make money, follow me. Your profits will double, and your returns will continue to grow. If you persevere, you can expect to earn at least 150% to 300% profit during this period. You can contact me, and I will help you! t.me/+-CYRAGyBuqtlNmU8 Signals free on Telegram: t.me/+f1MGvACIxPQ5ZWM8
Gold's decline was in line with expectations!
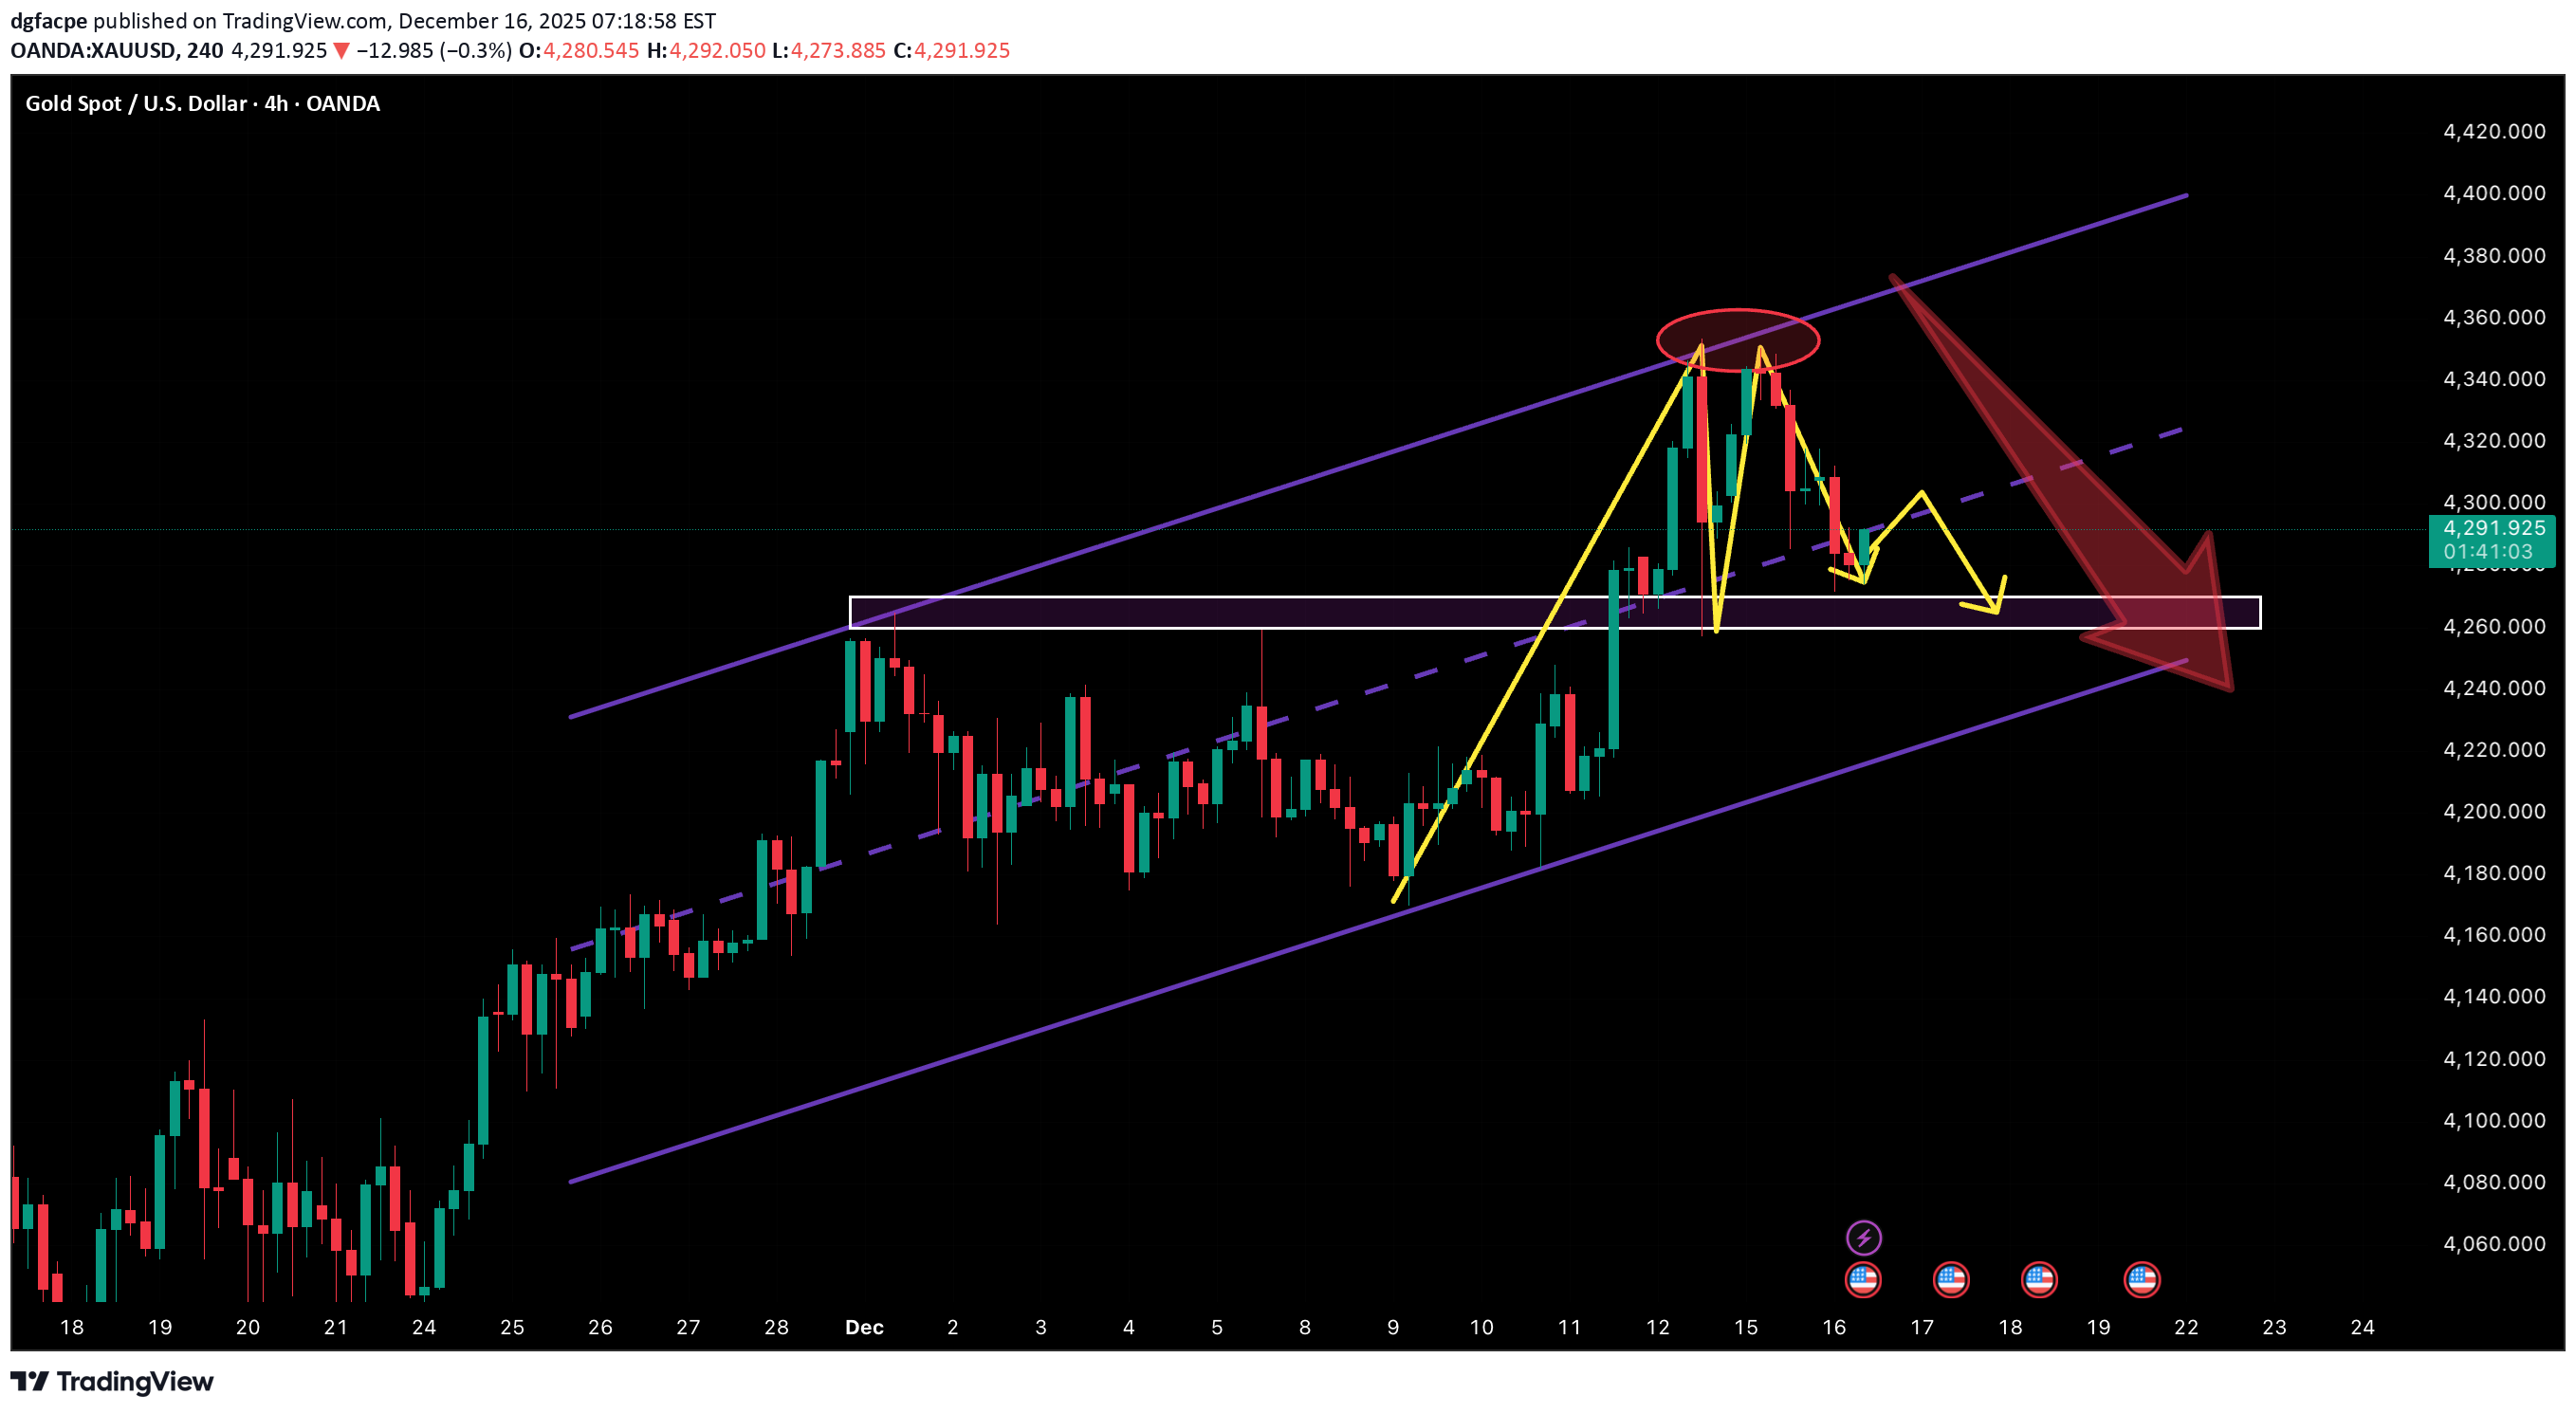
On Thursday (December 18th) in early European trading, the US dollar index was around 98.49; gold prices were around $4326. Today, investors will focus on US CPI data and the interest rate decisions of the European Central Bank and the Bank of England, which are expected to trigger significant market movements. Currently, the market lacks effective stimulus, but undercurrents are strong. The news of a Japanese yen interest rate hike has not yet been finalized, resulting in a lack of continuity in gold's price movements. While I have emphasized that the overall bullish trend for gold remains unchanged, I cautioned against the risk of a pullback. After Monday's sharp rise and fall, Tuesday's wide-ranging fluctuations, and Wednesday's phased rise, gold is currently still oscillating under the previous double-top resistance at 4350. Therefore, this Thursday and Friday, we should also pay attention to the strength of any correction within this strong upward trend and be cautious about stubbornly sticking to a single-directional movement. I believe there is room for a decline in gold on Thursday and Friday. In the short term, watch for support at 4280, and if the downward momentum is strong, it could reach 4250. Please adjust your strategy accordingly. From a technical perspective, the daily and 4-hour charts clearly show that the strong upward trend on the daily chart remains unchanged. With the strong moving averages, a break above 4355 could lead to 4385. However, if the moving average support is broken, and the market reacts differently, the downside potential could widen, potentially reaching last week's low of 4260. The 4-hour chart shows a range-bound movement, with Bollinger Bands narrowing and moving averages converging. The double top at 4350 hasn't been broken. Therefore, shorting below 4350 and targeting a correction is a viable strategy, provided 4355 holds. Thursday's trading should also focus on shorting the trend while also buying on dips. This view remains unchanged for Thursday and Friday: expect an upward move within the trend, but be aware of potential corrections. Based on the current market conditions, Shengfu anticipates gold will test the 4280 and 4260 lows on Thursday and Friday. In summary, the recommended short-term trading strategy for gold is to primarily sell on rallies and secondarily buy on dips. The key resistance level to watch in the short term is 4350-4353, while the key support level is 4270-4280. Please keep up with the pace of the market.My friend, Christmas is just around the corner, and we've made a substantial profit during this trading period. Listen, December will also see many news events, potentially making it an even more lucrative time. However, without the right methods, you won't make money. If you want to make money, follow me. Your profits will double, and your returns will continue to grow. If you persevere, you can expect to earn at least 150% to 300% profit during this period. You can contact me, and I will help you! t.me/+-CYRAGyBuqtlNmU8 Signals free on Telegram: t.me/+f1MGvACIxPQ5ZWM8
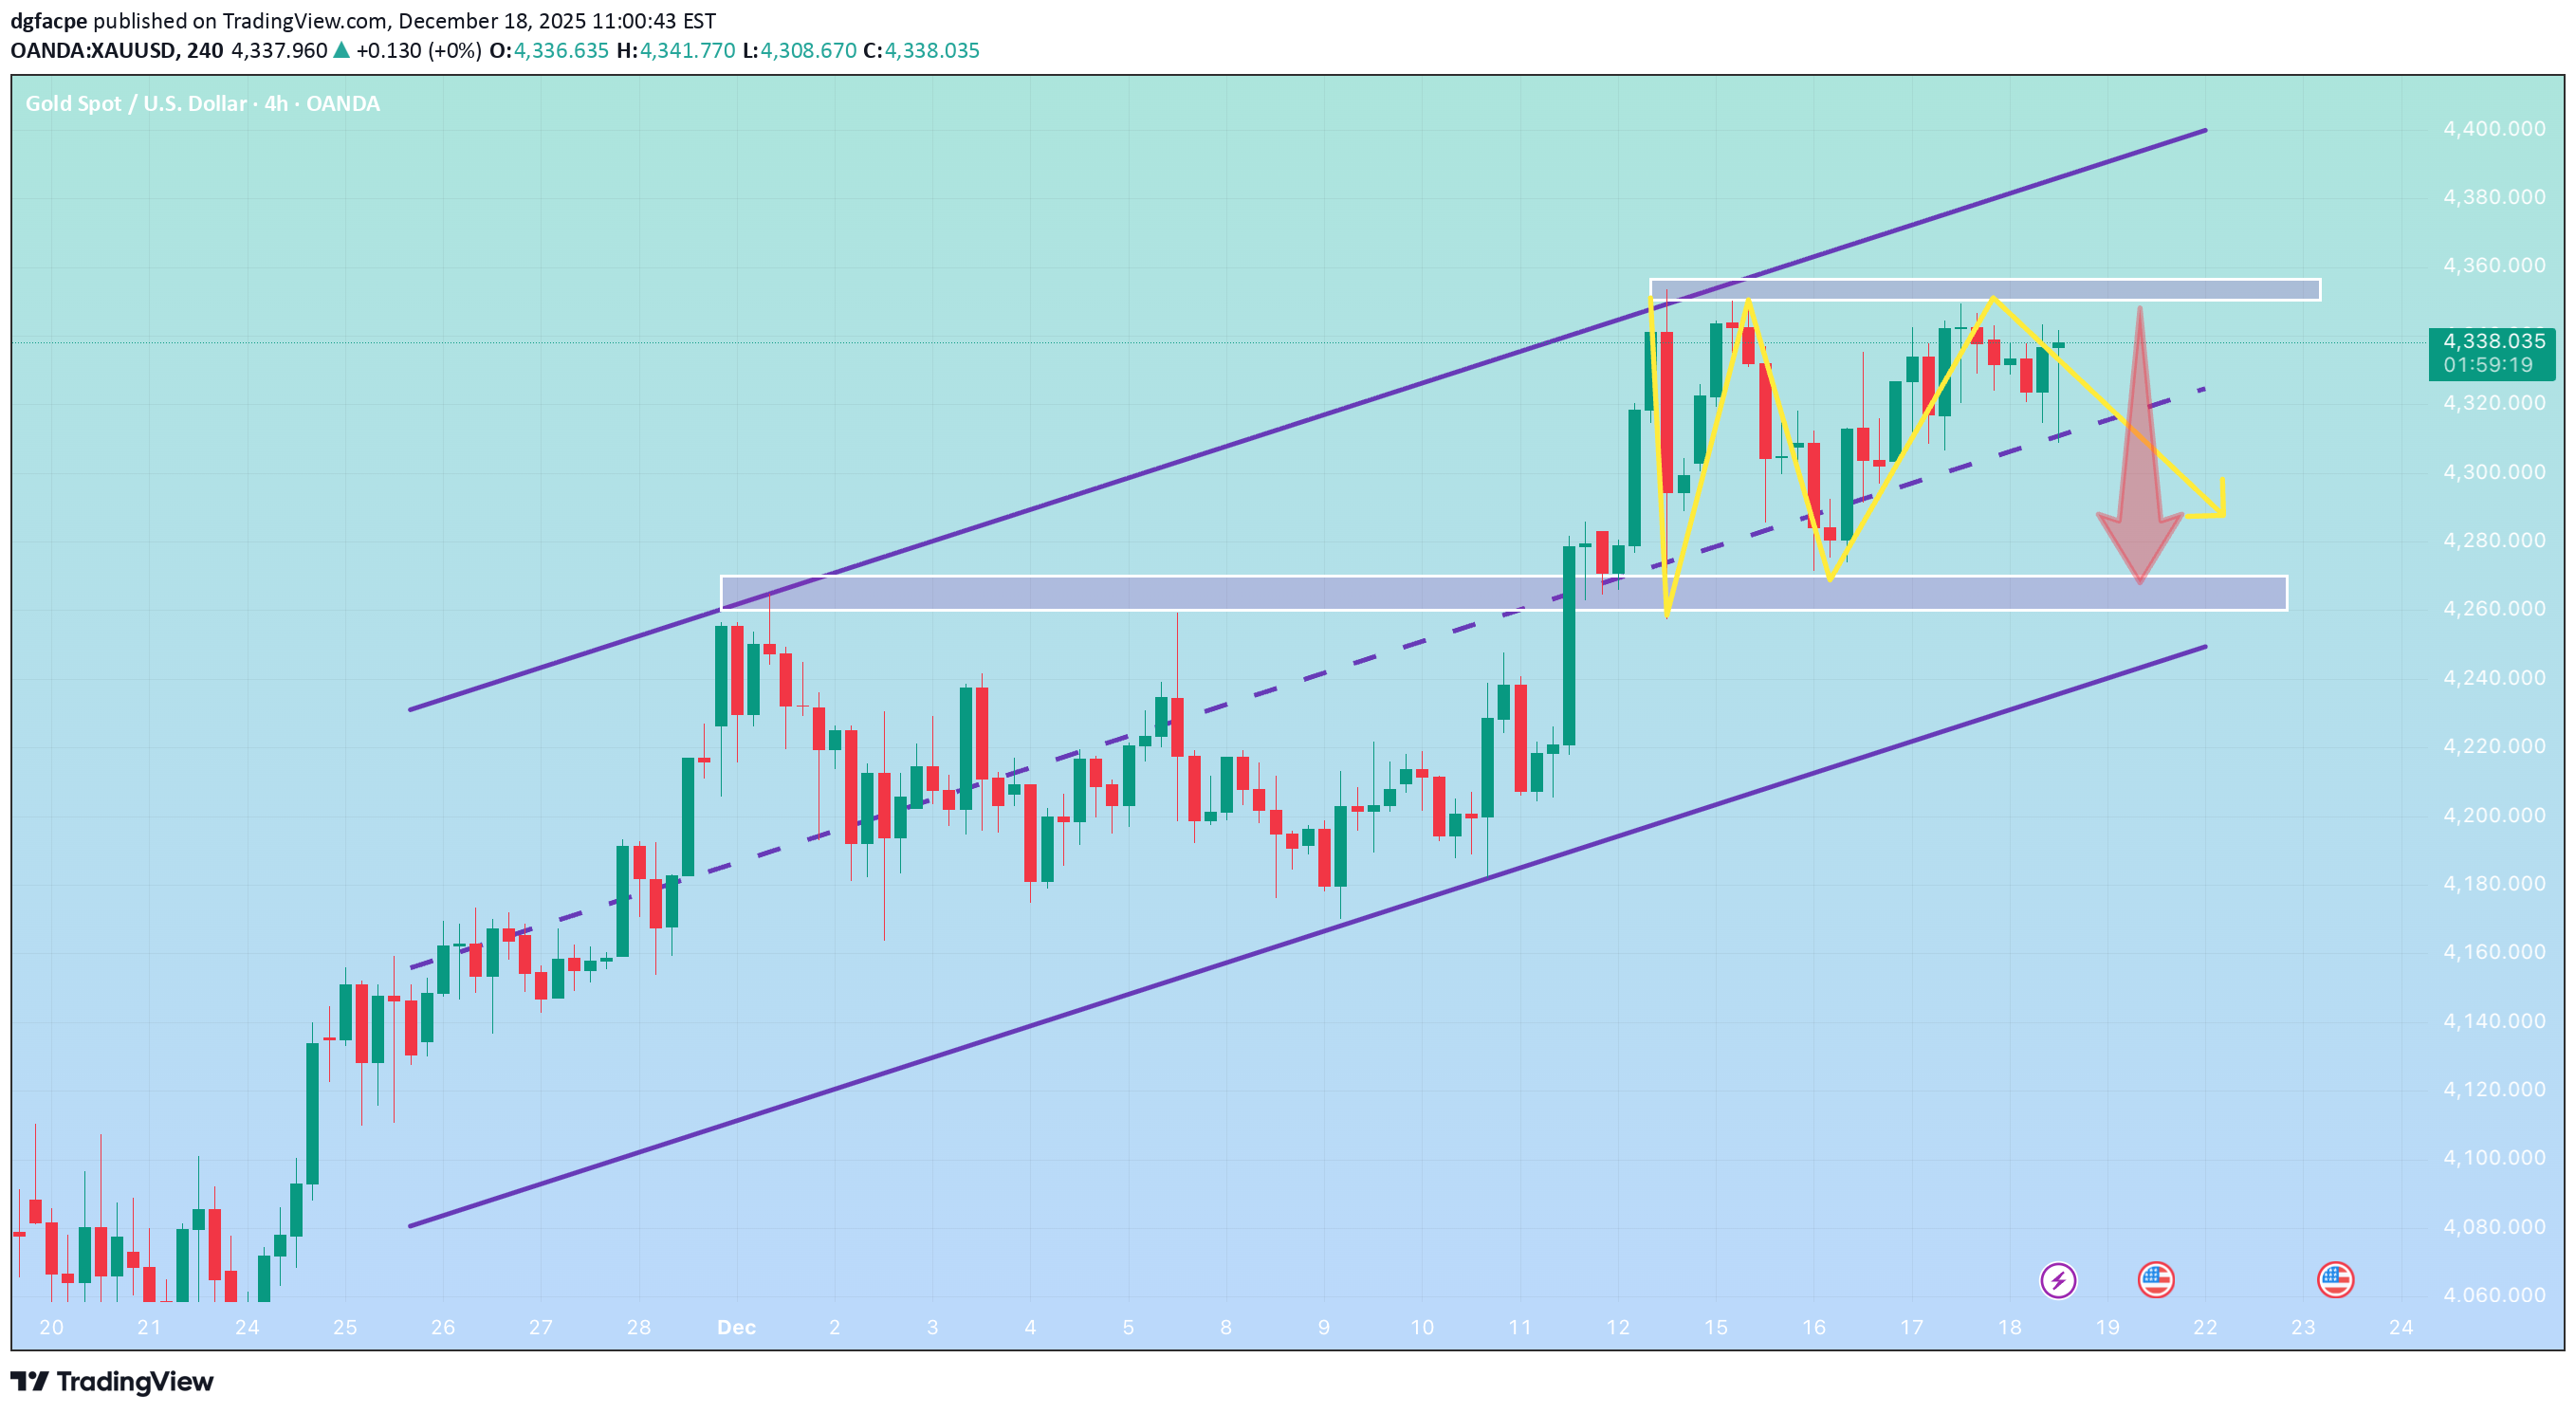
Gold's Double Top Pattern Emerging!
Gold is currently trading at $4288. Gold experienced a sharp rise and fall on Monday, briefly approaching the psychological high of $4350 due to market expectations of a Federal Reserve rate cut and fluctuations in the US dollar exchange rate. This nearly touched the more than seven-week high reached last Friday. However, as safe-haven demand cooled rapidly, gold quickly gave back most of its gains, ultimately closing at $4304.91, a slight increase of only about 0.1%. The main driver of this change was the progress made in important talks between US officials and Ukrainian President Zelensky regarding ending the war, which significantly reduced market demand for safe-haven assets. Meanwhile, global traders are turning their attention to the upcoming key US employment data, which will further reveal the Fed's future monetary policy path. The long wait is finally over. The US Bureau of Labor Statistics will release its November and October non-farm payroll reports in just over an hour. Traders are now closely awaiting the US non-farm payroll report and retail sales data scheduled for release on Tuesday, which will provide more clues about the Fed's policy path. This report will also have a significant impact on expectations for Fed rate cuts next year. Currently, the market expects two more rate cuts before September next year, while the Fed only expects one. If last month's employment data is stronger than expected, market expectations may align with the Fed's. If this happens, the dollar index may rise back to around 99.30, the 200-day simple moving average, and cyclical stocks may come under pressure. This could also push gold prices back to the record high of October, as it could indicate that the Fed's 75 basis point rate cuts since September were too rapid. If November's employment data is stronger than expected, gold prices may see a pullback. In addition to the non-farm payroll data, today's trading session will also see the release of the US October retail sales month-on-month rate (commonly known as "the terror data"), the US October industrial production month-on-month rate, and the US December SPGI manufacturing PMI preliminary value, which investors should pay attention to. Additionally, news related to the Venezuelan geopolitical situation should be monitored. Overall, the progress of the Ukraine peace talks has brought short-term pressure to the global gold market, and the weakening of safe-haven demand has led to a narrowing of gold price gains, but the release of the US employment data will be the next key turning point. Strong data could further boost the dollar and suppress gold prices; conversely, weak data could reignite expectations of interest rate cuts, driving a gold price rebound. Investors need to closely monitor the interaction between geopolitical developments and economic indicators to seize market opportunities. In the current environment of uncertainty, gold will continue to play its role as a safe-haven asset, but short-term volatility cannot be ignored. Gold Price Trend Analysis: After fluctuating wildly in the US session yesterday, gold continued to trade in a range. The European session's rise failed to break the historical high, and with the non-farm payroll data release today, significant gains are unlikely, with a low probability of breaking the previous high. Range-bound trading is the most probable scenario. Continue to be cautious of a pullback after a surge in gold prices; avoid chasing highs. The Asian morning session continued yesterday's US session trend, weakening further. Therefore, the market is likely to see a greater pullback, and a test of 4265 is probable today, with the key support level at 4258, the low of the large bullish candle. Gold is showing early signs of a double top on the 1-hour chart. If today's rebound is weak and breaks below the 4285 support level, the double top pattern will be confirmed. Furthermore, the current hourly chart shows short-term consolidation, requiring close monitoring. The price's lack of upward movement suggests a potential reversal and a sharp, high-volume decline. In terms of trading strategy, with data releases today, a double top formation at 4353 is possible. The hourly chart is currently consolidating at low levels, but there's been little upward momentum or follow-through. Be aware of a potential minor correction followed by a second decline. Short-term volatility is high; consider shorting near the 4320 resistance level in the early morning. In summary, Jin Shengfu's short-term trading strategy for gold is primarily to sell on rallies, with buying on dips as a secondary approach. Key resistance levels to watch are 4320-4330, and key support levels are 4260-4250. Please follow the trading recommendations closely.Selling Strategy: Sell gold in batches around 4338-4340, targeting 4310-4290; a break above this level would target 4280. Buying Strategy: Buy gold in batches around 4280-4285, targeting 4300-4310; a break above this level would target 4320.My friend, Christmas is just around the corner, and we've made a substantial profit during this trading period. Listen, December will also see many news events, potentially making it an even more lucrative time. However, without the right methods, you won't make money. If you want to make money, follow me. Your profits will double, and your returns will continue to grow. If you persevere, you can expect to earn at least 150% to 300% profit during this period. You can contact me, and I will help you! t.me/+-CYRAGyBuqtlNmU8 Signals free on Telegram: t.me/+f1MGvACIxPQ5ZWM8
Gold Market Analysis for Next Week.
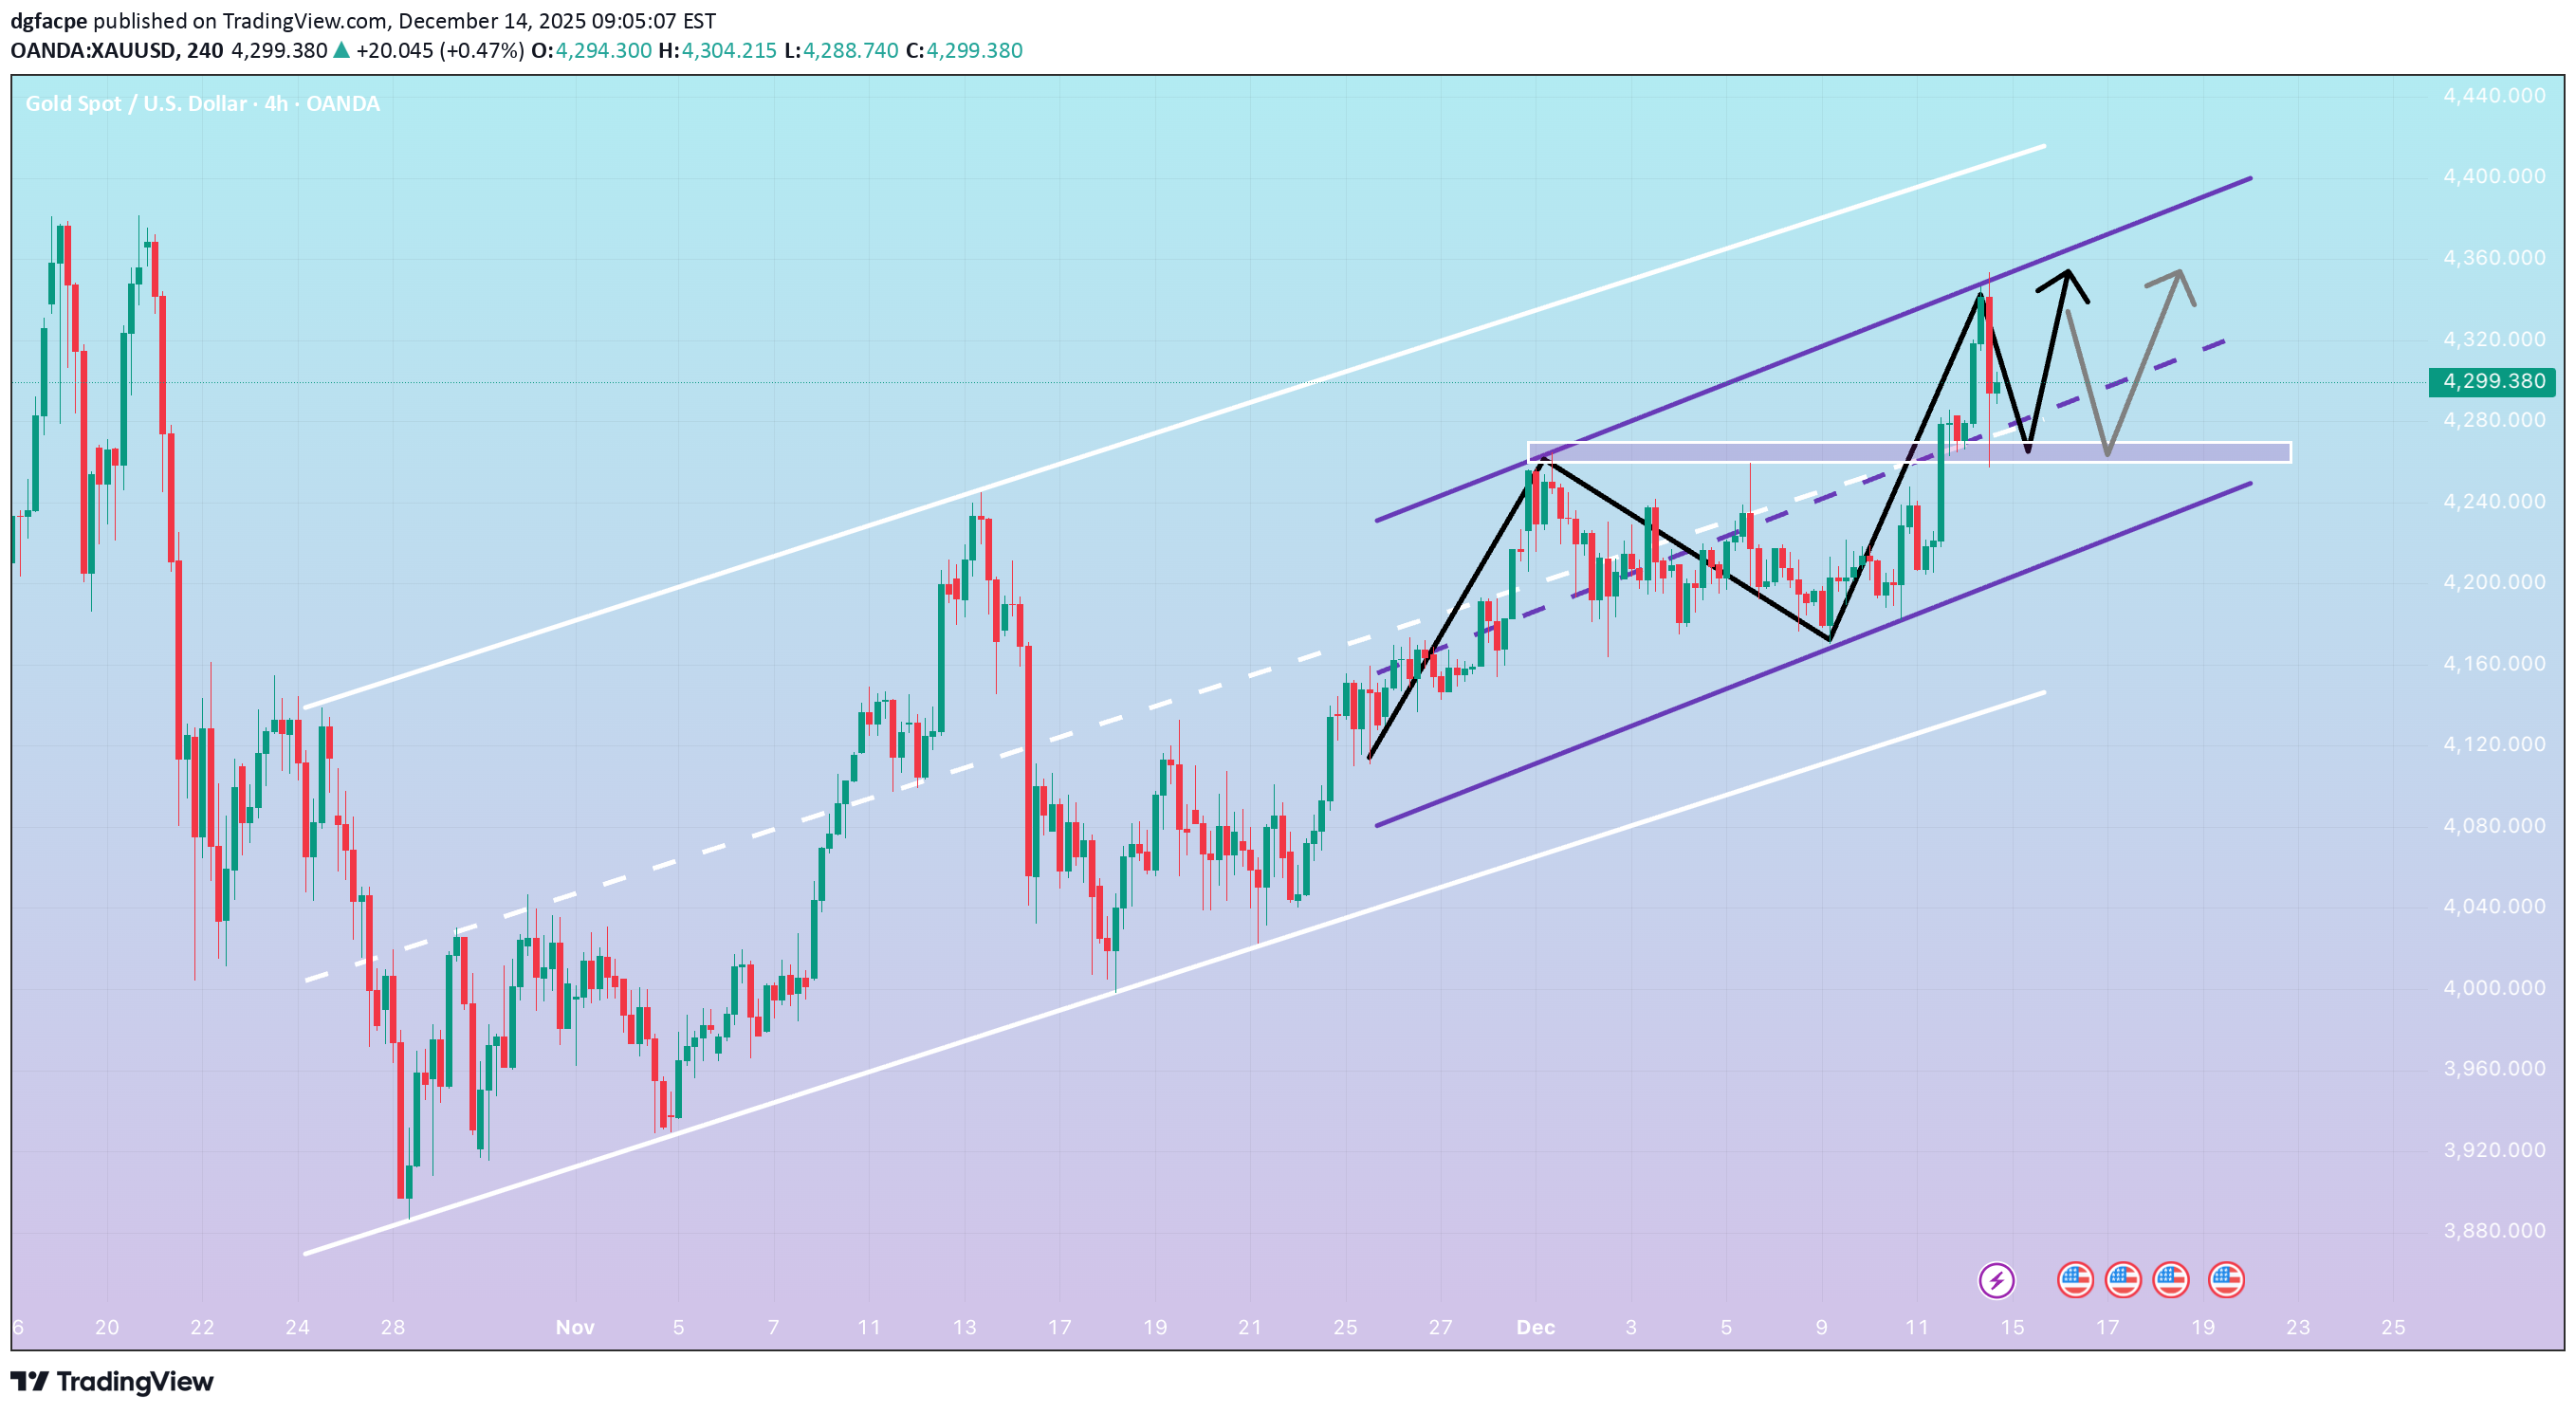
Gold rose $101.80 or 2.42% this week, briefly touching around $4353 on Friday before closing at $4299.87. It's worth noting that this rally didn't occur during a typical period of heightened risk aversion, but rather in an environment of recovering risk appetite, primarily driven by a broad weakening of the US dollar. As investors reassessed the Federal Reserve's future policy path, high-yield assets generally rebounded, while the dollar weakened, and gold benefited in tandem. Gold prices surged this week, approaching historical highs again, as market expectations rose that cooling inflation and slowing economic activity would force the Fed to further cut interest rates. The broad-based weakening of the dollar, coupled with a shift in the interest rate outlook, provided solid support for gold prices. Although the approaching year-end holidays may amplify short-term volatility, the medium-term upward logic for gold remains intact, given the expectation of interest rate cuts, central bank gold purchases, and the unbroken technical trend. Looking ahead to next week, a flurry of US macroeconomic data will be released, with employment and inflation remaining the market focus. S&P Global will release its preliminary December PMI figures, and the US will also release October retail sales data and the November non-farm payroll report (including some supplementary October data). The US will also release its latest CPI data and initial jobless claims. Analysts point out that because these key data releases occur after the Fed's decision, rather than before, coupled with the approaching year-end holidays and decreased market liquidity, short-term price volatility may be significantly amplified. If the data continues to show signs of economic and employment weakness, the probability of the dollar remaining weak until the end of the year is high. The market has already priced in at least two Fed rate cuts, and coupled with a weaker dollar and continued central bank gold purchases, these factors may drive the upward trend in gold prices into 2026. Regarding the interest rate path, policymakers expect one rate cut in 2026 and another in 2027. Powell emphasized at the press conference that policymakers are striving to strike a balance between suppressing inflation and avoiding unnecessary shocks to the labor market, and clearly stated that rate hikes are not currently under discussion. Although official guidance is relatively cautious, the market interpretation is more dovish. Investors generally expect the Federal Reserve to implement at least two more interest rate cuts in 2026, a factor that is suppressing the dollar and boosting gold. Analysts summarize that, supported by multiple factors including expectations of rate cuts, a weakening dollar, and continued central bank gold purchases, the medium- to long-term upward logic for gold remains valid, with short-term fluctuations depending more on data releases and holiday liquidity changes. Gold Price Trend Analysis: With half a month left until the end of 2025, 4353 is likely the high for this month; a new high is not expected at this time. Although the weekly chart shows a large bullish candle, Friday's sharp drop was followed by a rapid rebound, indicating continued bullish strength. Key support is around 4260, a key level for next week's market direction; above this level, there will be strong upward movement, while a break below will turn the market bearish. Short-term resistance is around 4320, the second-highest point in the US session, which is also close to the 0.618 Fibonacci retracement level; then there's Friday's high and the historical high area. I believe the probability of breaking the historical high is low. Gold prices plunged from their highs on Friday, which was understandable given their proximity to historical highs. So, how should we position ourselves for gold next week after this decline? The 4-hour chart for gold remains relatively bullish, but strong resistance and selling pressure persist, ultimately causing gold to retreat from its highs. Next week, the key level to watch is the resistance around 4340, the 4-hour chart's actual high. If it holds above 4340, gold may enter a new large-range consolidation phase, with support around 4360. Gold is likely to trade within this large range at the beginning of the week, followed by the release of Tuesday's non-farm payroll data, Thursday's CPI data, and Friday's Bank of Japan interest rate decision to see if a rate hike will occur. With numerous data releases next week, market volatility is likely to be high. However, given the current easing environment, pullbacks still present buying opportunities. In summary, the recommended short-term trading strategy for gold next Monday is to primarily buy on dips and secondarily sell on rallies. The key resistance level to watch in the short term is 4340-4350, while the key support level is 4260-4265. Please keep up with the pace of the market.Short Selling Strategy: Sell gold in batches around 4340-4345, with a target of 4320-4300, and a further target of 4280 if it breaks through. Long Selling Strategy: Buy gold in batches around 4275-4280, with a target of 4305-4320, and a further target of 4340 if it breaks through.My friend, Christmas is just around the corner, and we've made a substantial profit during this trading period. Listen, December will also see many news events, potentially making it an even more lucrative time. However, without the right methods, you won't make money. If you want to make money, follow me. Your profits will double, and your returns will continue to grow. If you persevere, you can expect to earn at least 150% to 300% profit during this period. You can contact me, and I will help you! t.me/+-CYRAGyBuqtlNmU8 Signals free on Telegram: t.me/+f1MGvACIxPQ5ZWM8
Gold Price Surge Expectations Perfectly Realized!
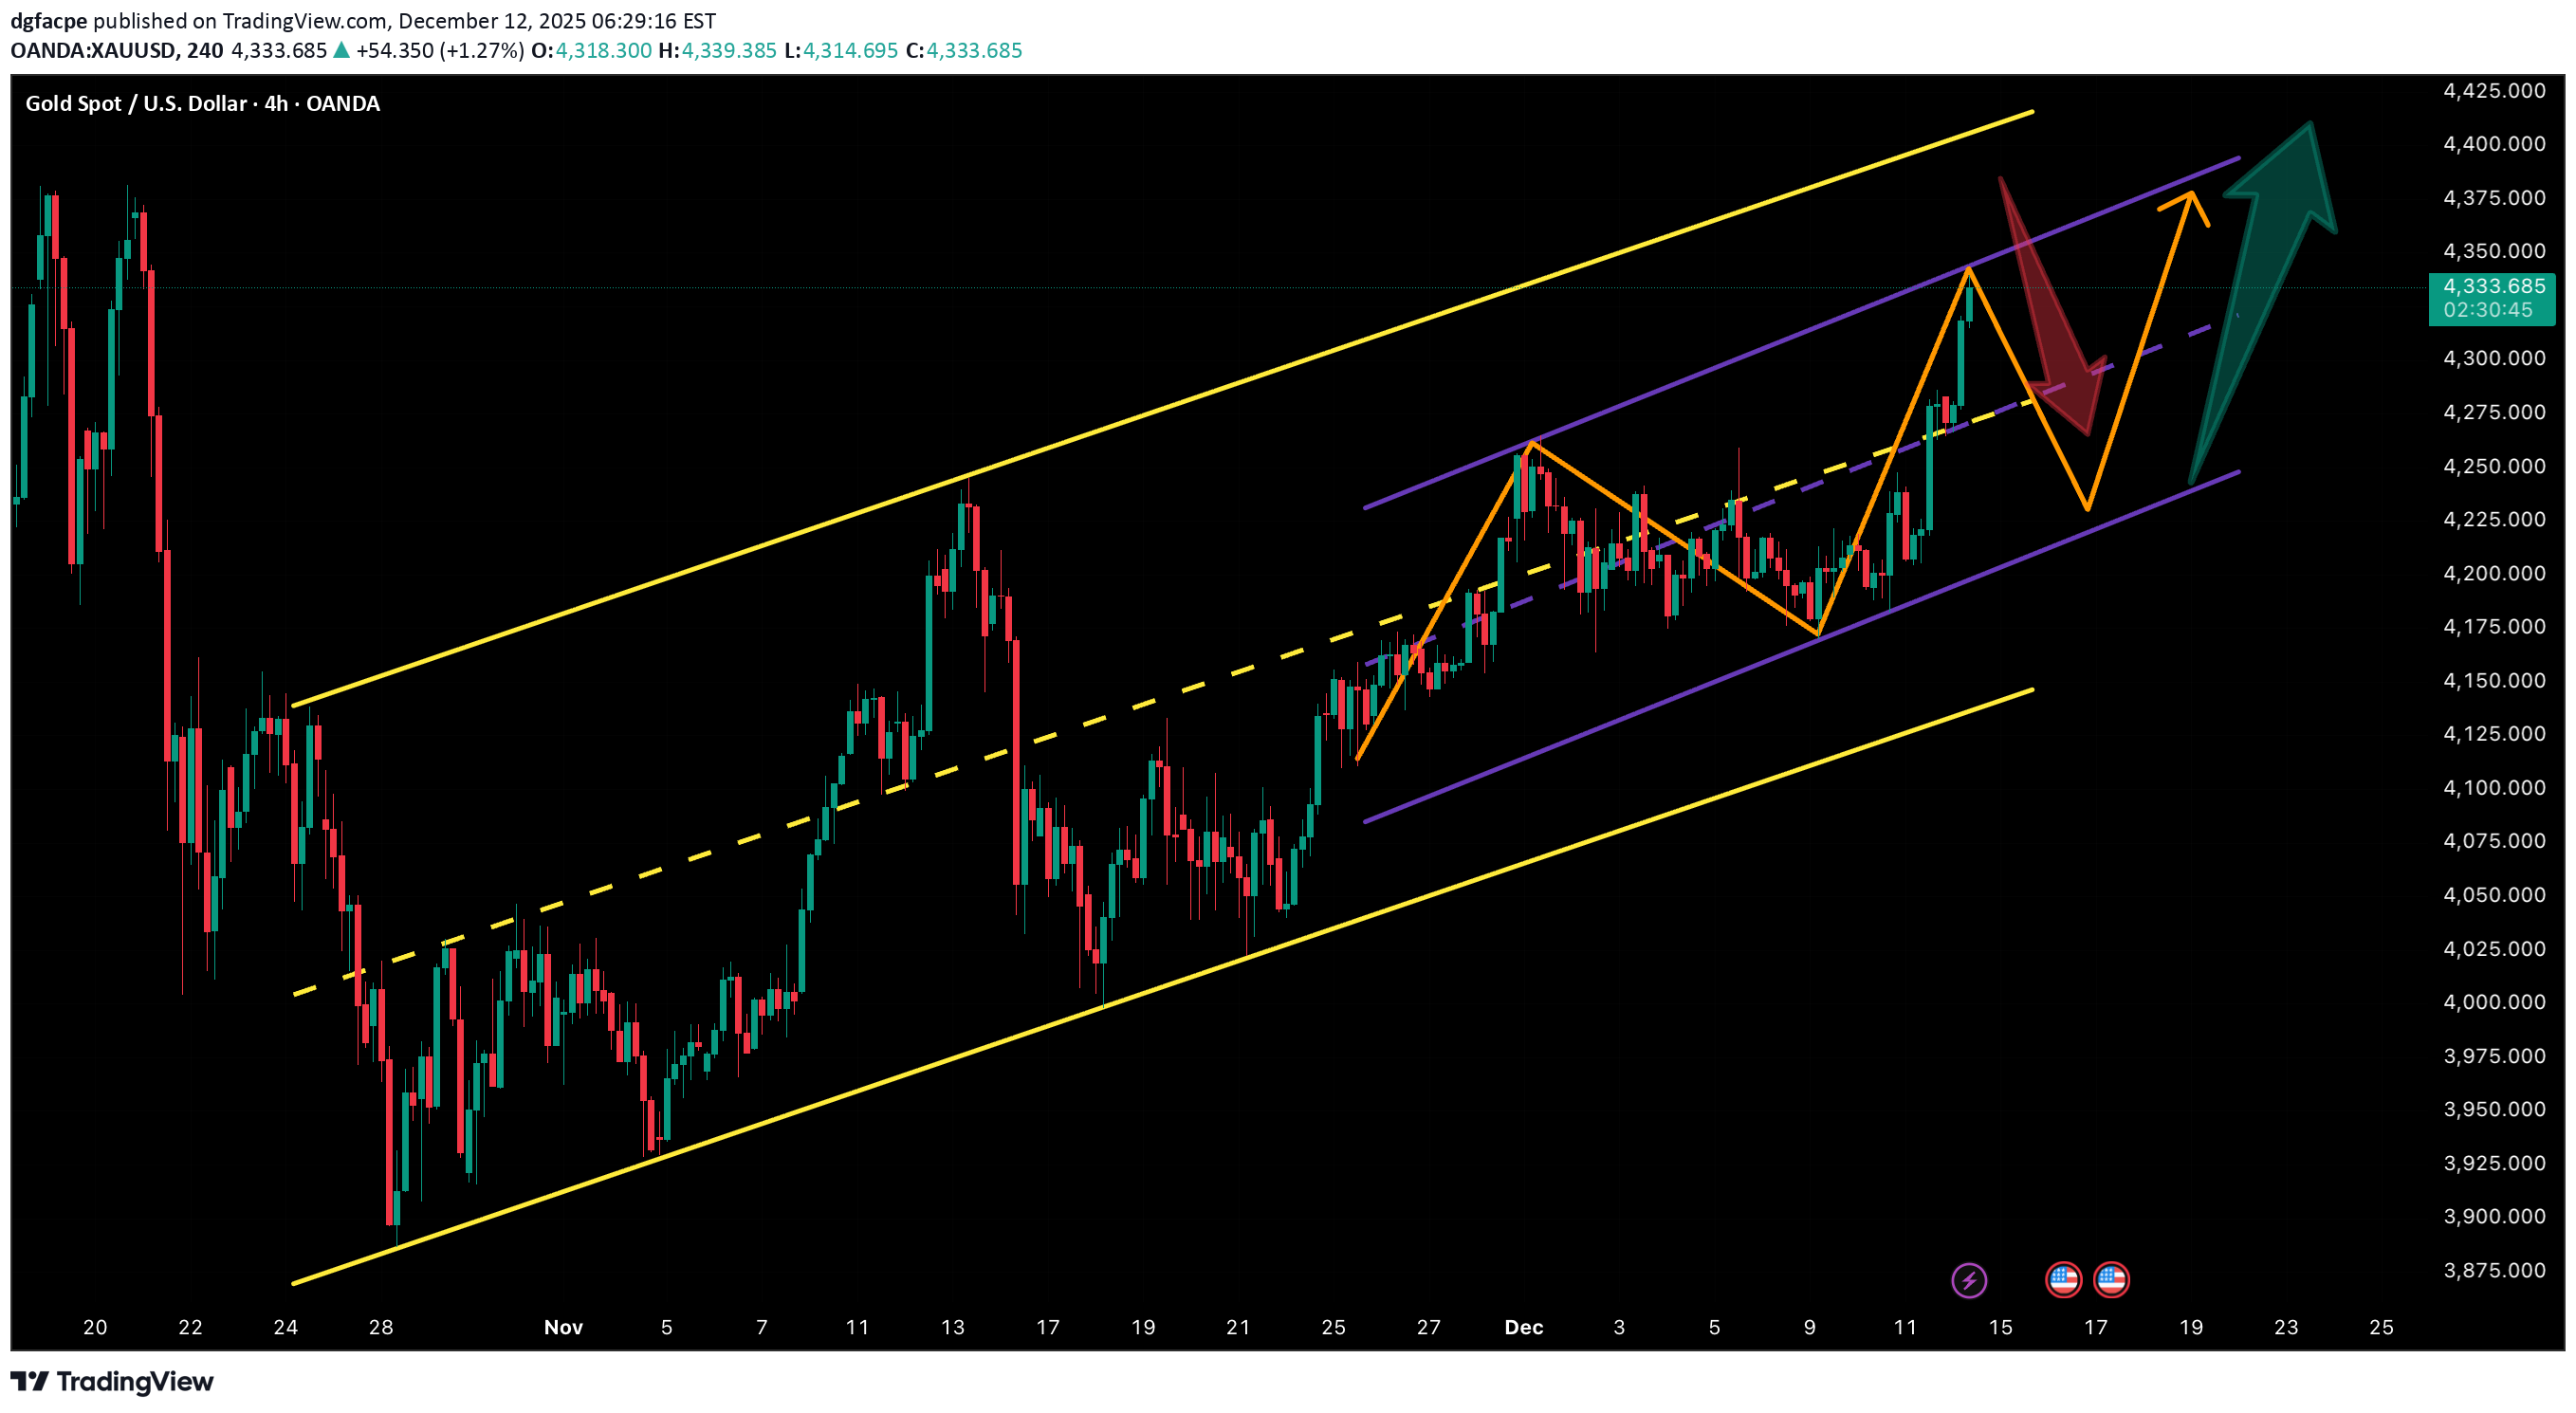
On Friday (December 12th) during the European session, spot gold traded in a narrow range, currently hovering around $4330. The market continued its trading theme driven by expectations of further easing following the Fed's policy decision. The dollar index rebounded slightly after hitting a seven-week low of 98.13 on Thursday, but its overall weakness remained unchanged. The most important event this week was undoubtedly the Fed's interest rate decision and its subsequent guidance. The Fed announced a 25 basis point rate cut on Wednesday, lowering the target range for the federal funds rate to 3.50% to 3.75%, a move in line with market expectations. However, market focus quickly shifted to the policy statement and Chairman Powell's press conference. The dot plot showed that policymakers expect the federal funds rate to fall to 3.4% by the end of 2026, implying only one rate cut opportunity next year. Despite this, Powell emphasized at the press conference that the US labor market faces significant downside risks, and the Fed does not want its policies to stifle job creation. This wording was interpreted by the market as a dovish signal, leading some traders to bet on two rate cuts next year, rather than the one suggested by the dot plot. This subtle divergence in policy expectations has provided significant support for the gold market. As a non-interest-bearing asset, the cost of holding gold is inversely related to interest rate levels. When the market expects interest rates to level off or even decline, gold's relative attractiveness increases. The Federal Reserve's continued easing cycle with inflation pressures still above its 2% target, ruling out a pause in rate cuts, has put pressure on the dollar and provided upward momentum for gold prices. The dollar index fell to a more than two-month low on Thursday, reflecting the market's repricing of the Fed's policy path. Although the dollar attempted to stabilize during Friday's Asian session, the overall trend remained weak, creating a favorable exchange rate environment for dollar-denominated gold. In addition to monetary policy factors, geopolitical risk premiums are also an important variable supporting gold's performance. Next week's US non-farm payroll data will also be an important market driver. Powell's emphasis on labor market risks means that marginal changes in employment data could significantly impact policy expectations. If employment data unexpectedly weakens, market bets on interest rate cuts may intensify, which would benefit gold. Conversely, if employment remains resilient, the dollar may gain a breather, and gold prices will face some downward pressure. From a longer-term perspective, gold's dual attributes as an inflation hedge and safe-haven asset give it unique allocation value in the current complex macroeconomic environment. Global central bank gold purchases remain active, and the increase in gold reserves by central banks reflects a reassessment of long-term confidence in the fiat currency system. This structural demand change provides solid bottom support for gold prices and is an important reason for market optimism in the face of short-term volatility. Gold Price Trend Analysis: Gold's recent price movement is completely consistent with my analysis. This week, I have consistently emphasized buying on dips, and have repeatedly provided strategies and real-time notifications for placing long positions at lower levels. I believe those who follow me have seen this. I particularly emphasized that gold is stabilizing above 4260, accumulating strength, and awaiting a rally. Why didn't you see that? Our long position at 4265 was closed with a profit again, and the price ultimately surged as expected, breaking through 4310. We've achieved two consecutive wins for gold long positions today! Gold has been soaring recently, but a drop is inevitable. It's not far from our target of 4340, so we sold directly at 4340. We'll test the top first, and today is Black Friday, with support levels at 4260, or even around 4230. Such a strong upward move in gold requires caution. We don't support chasing the highs and lows. In short, we expect a pullback below 4260. Overall, our short-term trading strategy for gold today is primarily to sell on rallies, with buying on dips as a secondary approach. The key resistance level to watch in the short term is 4320-4330, and the key support level is 4250-4260. Please follow our recommendations closely.As I said, a continuous rise in gold prices is inevitably followed by a sharp fall! Friends, this is based on over ten years of trading experience!
Gold Awaits Interest Rate Decision for Direction!
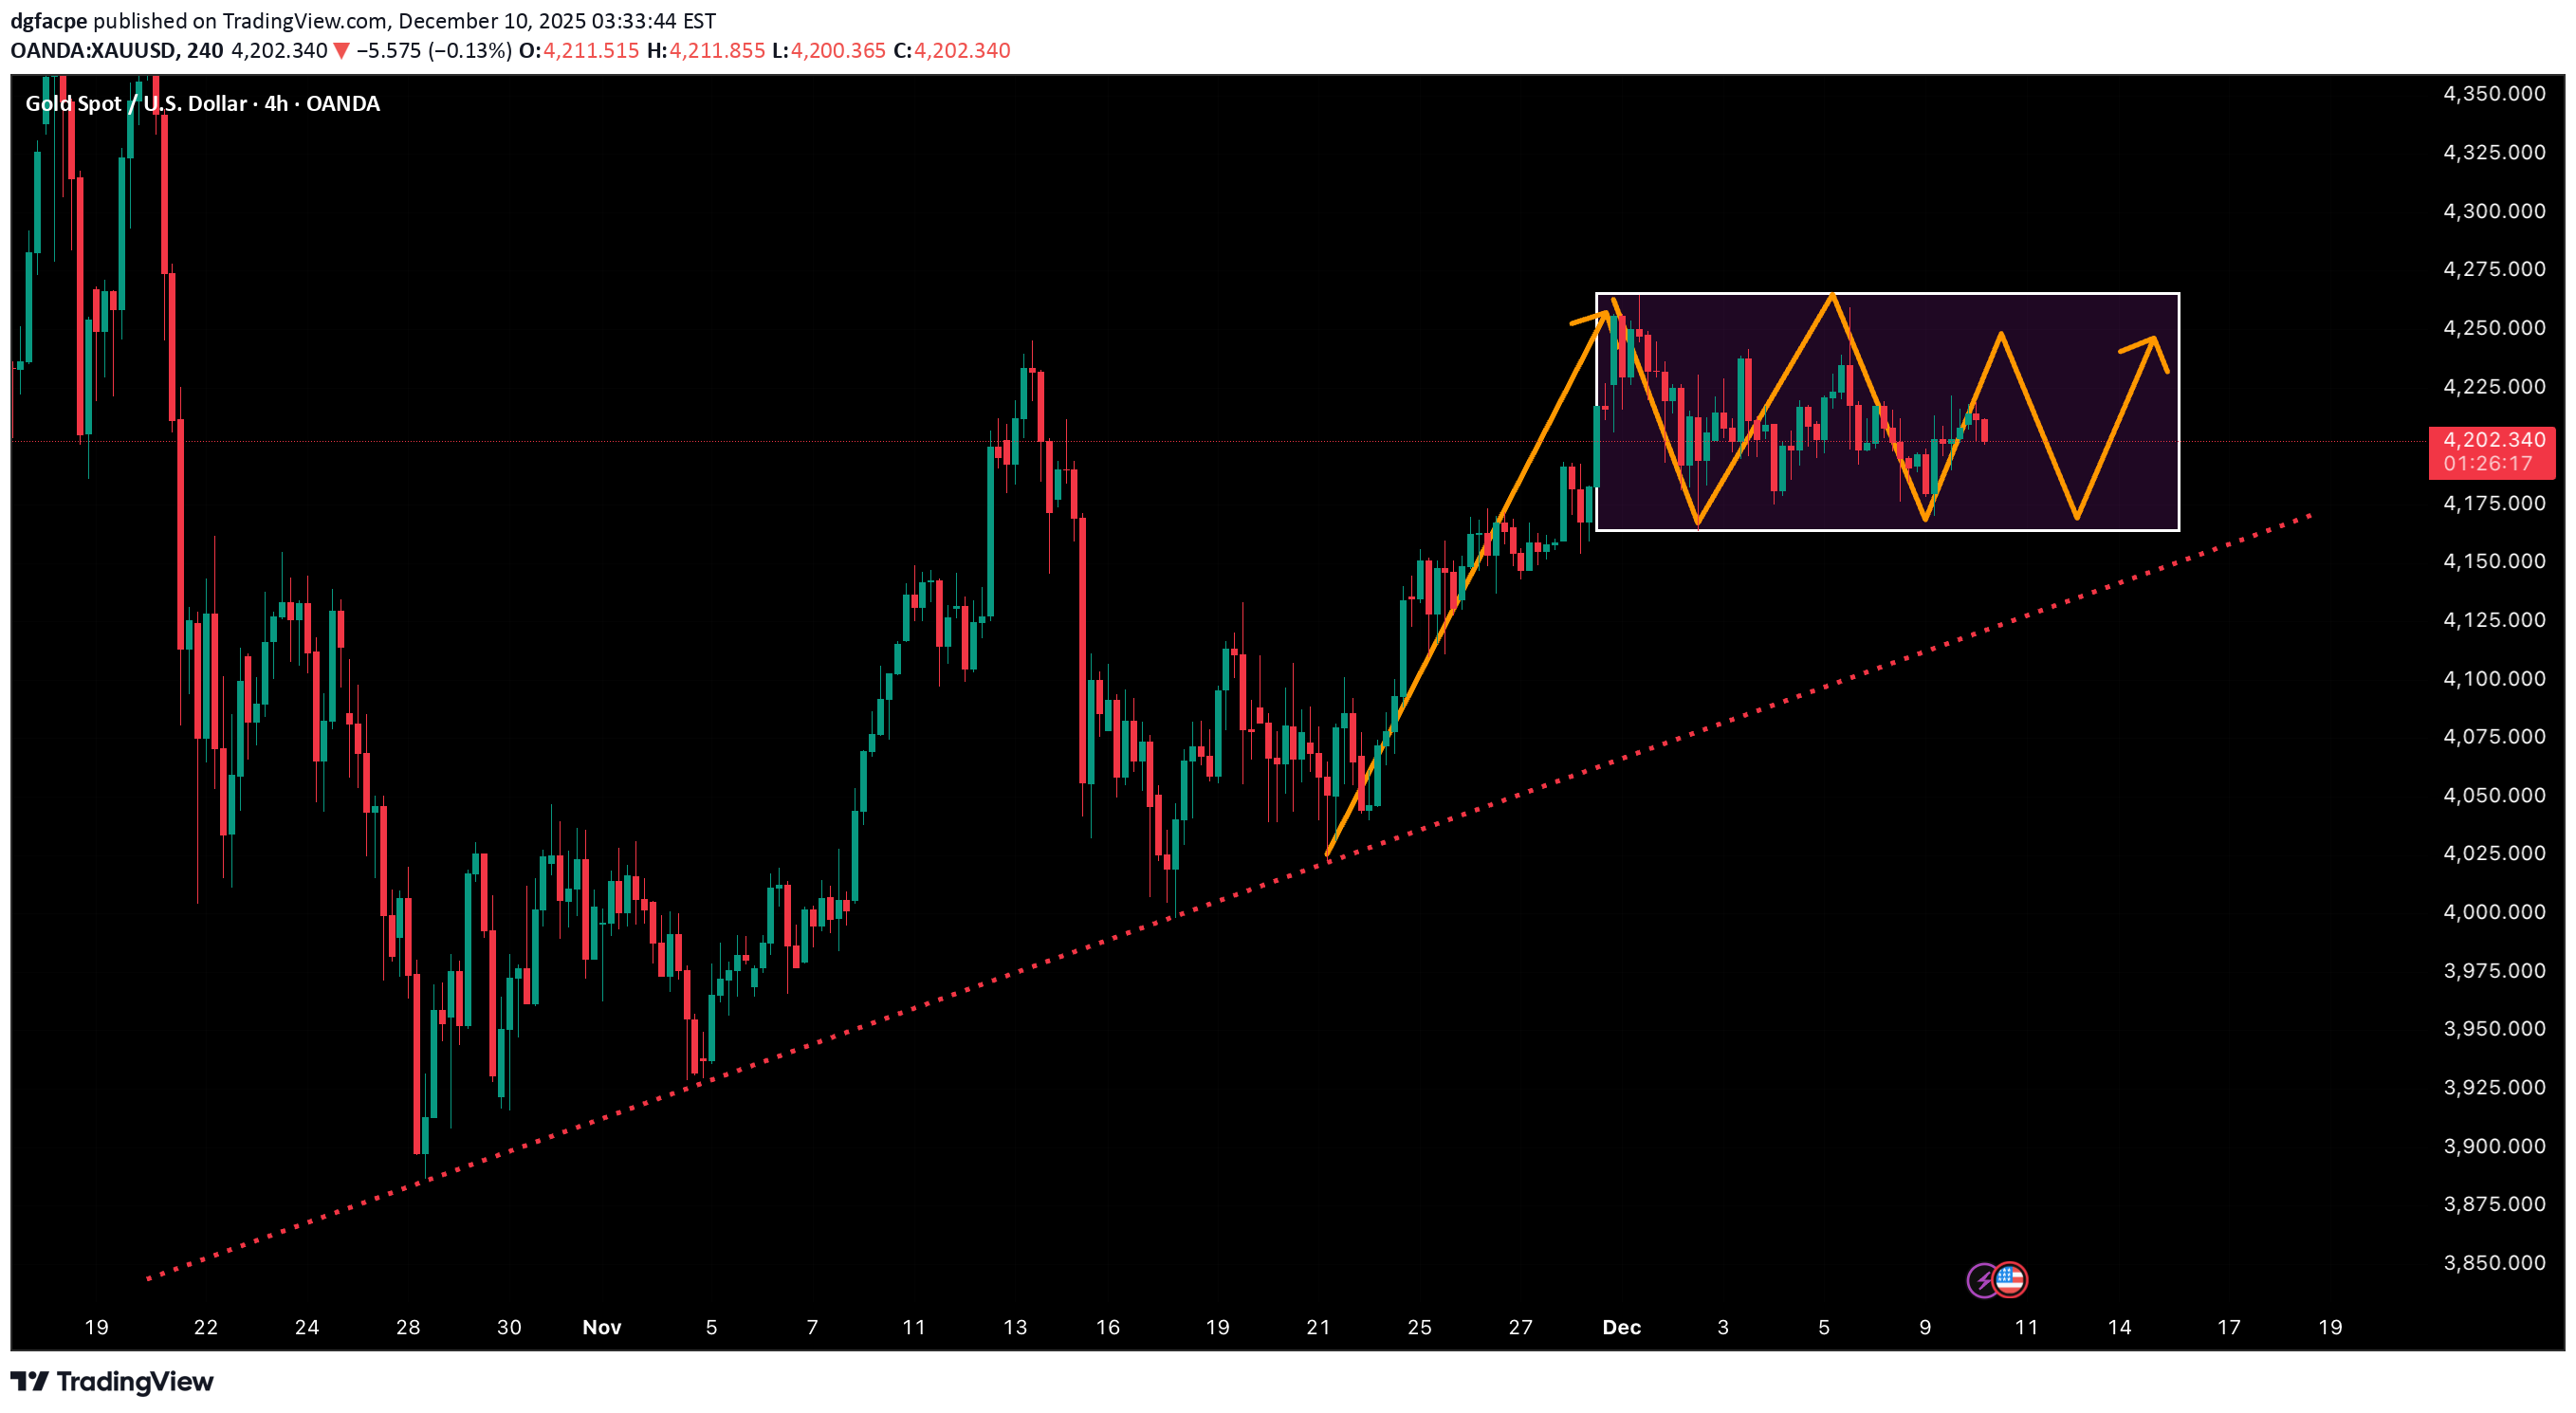
On Wednesday (December 10th) in early Asian trading, gold traded in a narrow range, currently hovering around $4200. The market widely expects a rate cut by the Federal Reserve, attracting bargain hunters and supporting gold prices. However, better-than-expected US job openings data released on Tuesday, coupled with a continued rebound in the US dollar index and a three-month high in US Treasury yields, has made gold bulls hesitant. The US dollar index rose 0.1% to close at 99.21, strengthening for two consecutive trading days. This put some pressure on gold, as a stronger dollar typically diminishes the attractiveness of dollar-denominated gold. Ahead of the Fed's decision, the gold market is trading cautiously, with investors focusing on the Fed's dot plot and Powell's press conference, as well as news regarding Fed candidates. However, from a broader perspective, this employment data has not completely extinguished expectations of a rate cut. On the contrary, it has strengthened the possibility of a "hawkish rate cut" by the Fed, namely, acknowledging a strong economy while implementing precautionary easing. A rate cut is almost a certainty, but Powell may attempt to set a higher threshold for further action. This means gold may face challenges from a strong dollar in the short term, but in the medium to long term, if inflationary pressures ease, gold will still benefit from a low-interest-rate environment. Investors need to closely monitor the interaction between data and policy to avoid blindly chasing the rally. The Federal Reserve's monetary policy is always a crucial indicator for the gold market. The two-day FOMC meeting will end on December 10th, with market traders generally betting on a 25 basis point rate cut this week, with a probability as high as 87.4%. This optimistic expectation attracts bargain hunting to support gold prices, as rate cuts typically reduce the opportunity cost of holding gold, driving funds into the precious metals sector. On the eve of the meeting, spot gold steadily climbed from its intraday low, ultimately closing slightly higher, reflecting investors' eager anticipation of easing policies. However, this rate cut may not be a simple dovish signal. Market analysts point out that Powell may emphasize inflation risks in his statement and set a higher threshold for subsequent easing measures. This possibility of a "hawkish rate cut" stems from the resilience of the US economy. Despite the government shutdown causing delays in some data releases, overall economic indicators showed a robust labor market, making the Federal Reserve more cautious in easing policy. Gold's rise has not been smooth sailing, but rather accompanied by weighing of future uncertainties. Investors need to be wary of short-term volatility from policy statements. Investors also need to pay attention to the potential impact of Powell's successor, Hassett, and Trump's dovish expectations add uncertainty. Overall, gold still has room to rise in the easing cycle, but caution is needed regarding variables in inflation and employment data. December 10th Gold Price Analysis: Gold retreated in the morning on Tuesday, testing the 4170 level before rebounding. Recent price action has been volatile, with strong but discontinuous movement, typical of a range-bound market. Tonight at 3 AM, the final interest rate decision of the year will be announced, and market expectations for a rate cut are rising. So, how should one position gold today? With the Fed's interest rate decision looming, gold is likely to continue its range-bound movement. From a technical perspective, gold prices rebounded strongly after finding support near the lower edge of the $4170-$4165 range, validating the previous market analysis's assessment that "short-term price action will likely involve range-bound consolidation." On the daily chart, gold prices have firmly established themselves above the key psychological level of $4200, indicating strong short-term bullish momentum. Today's trading can be divided into two sessions: the Asian session and the US session. During the Asian session, market sentiment is generally optimistic, and gold prices are expected to continue their upward trend. Any technical pullbacks could present buying opportunities, with support levels at $4185 and $4190. The upper resistance levels are at 4220 and 4245. On the 1-hour chart, gold still faces short-term resistance above the 4220 area, with support around 4190. Tuesday's rise in gold may have raised the lower support level, meaning it may not necessarily reach 4180; support at 4190 could allow it to continue rising. Before the Fed's interest rate decision, it will likely continue to fluctuate within this range. In the Asian session, gold is expected to continue its pullback under pressure above 4220. If it stabilizes above 4190, a short-term rebound is possible. It's worth noting that the precious metals market has already fully priced in the Fed's rate cut expectations. Investors should be wary of the "buy the rumor, sell the fact" trading risk. If Powell releases hawkish signals or hints at a slower pace of future rate cuts, it could trigger short-term profit-taking in gold and silver. Conversely, if the policy statement emphasizes downside risks to the economy or mentions expanding the scope for easing policies, it will further boost precious metal prices. Investors are advised to remain cautious before the data release, manage their positions reasonably, and wait for the market direction to become clearer before taking action.
Gold Trading Strategy: V-Shaped Rebound!
Gold has once again rebounded from its low, touching a low of 4181 before successfully stabilizing above 4200. We went long at 4188 and exited with a profit above 4200. Our strategy is to primarily go long on pullbacks that don't break below 4200. After all, the international environment is bullish for gold, and the technical indicators are also bullish. Going long shouldn't be about blindly chasing the market; buying on pullbacks is the key to successful trading. If you're currently experiencing difficulties with your trading and want to help your investments avoid pitfalls, feel free to contact us for discussion! Looking at the 4-hour chart, the key resistance level to watch is 4250-60, while the key support level is 4165-75. Technically, the current consolidation suggests a tendency to buy on dips. We patiently wait for key entry points. I will provide specific trading strategies during trading hours; please pay close attention. Gold Trading Strategy: 1. Buy gold on a pullback to the 4195-4200 level, add to the long position on a pullback to the 4180-4185 level, stop loss at 4166, target 4245-4250, hold if it breaks through.
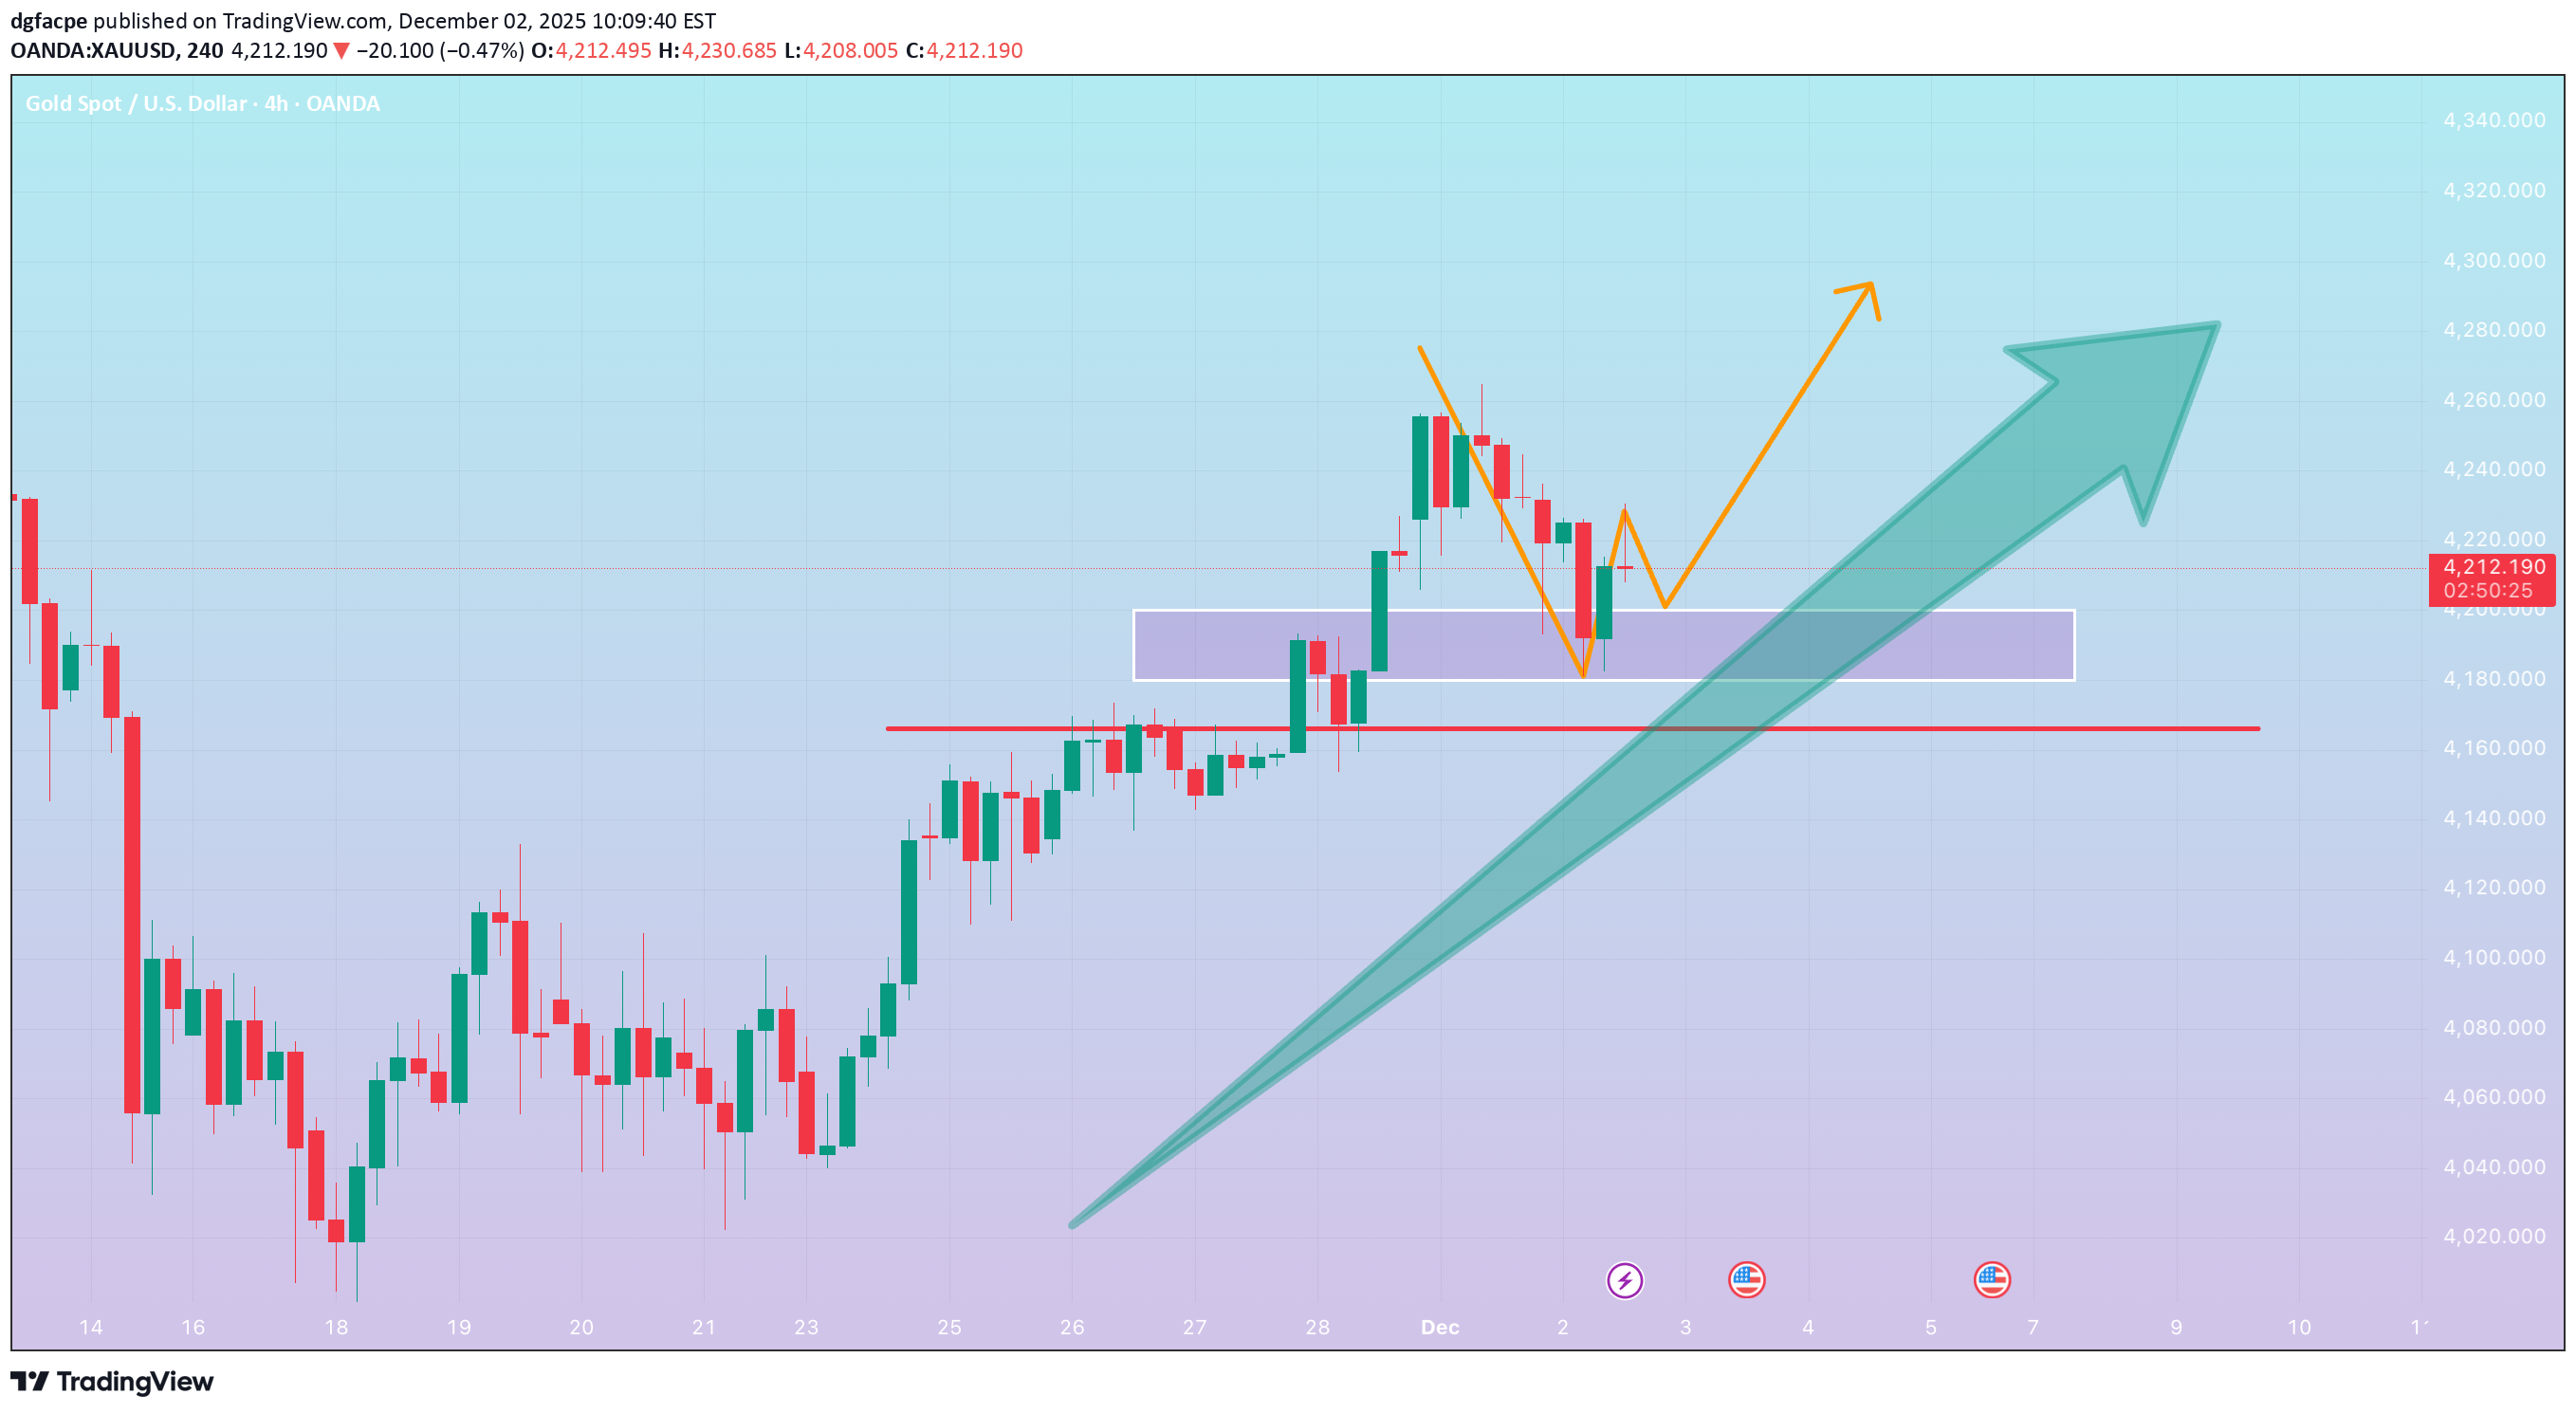
A Perfect Short Selling Opportunity at the Gold's High!
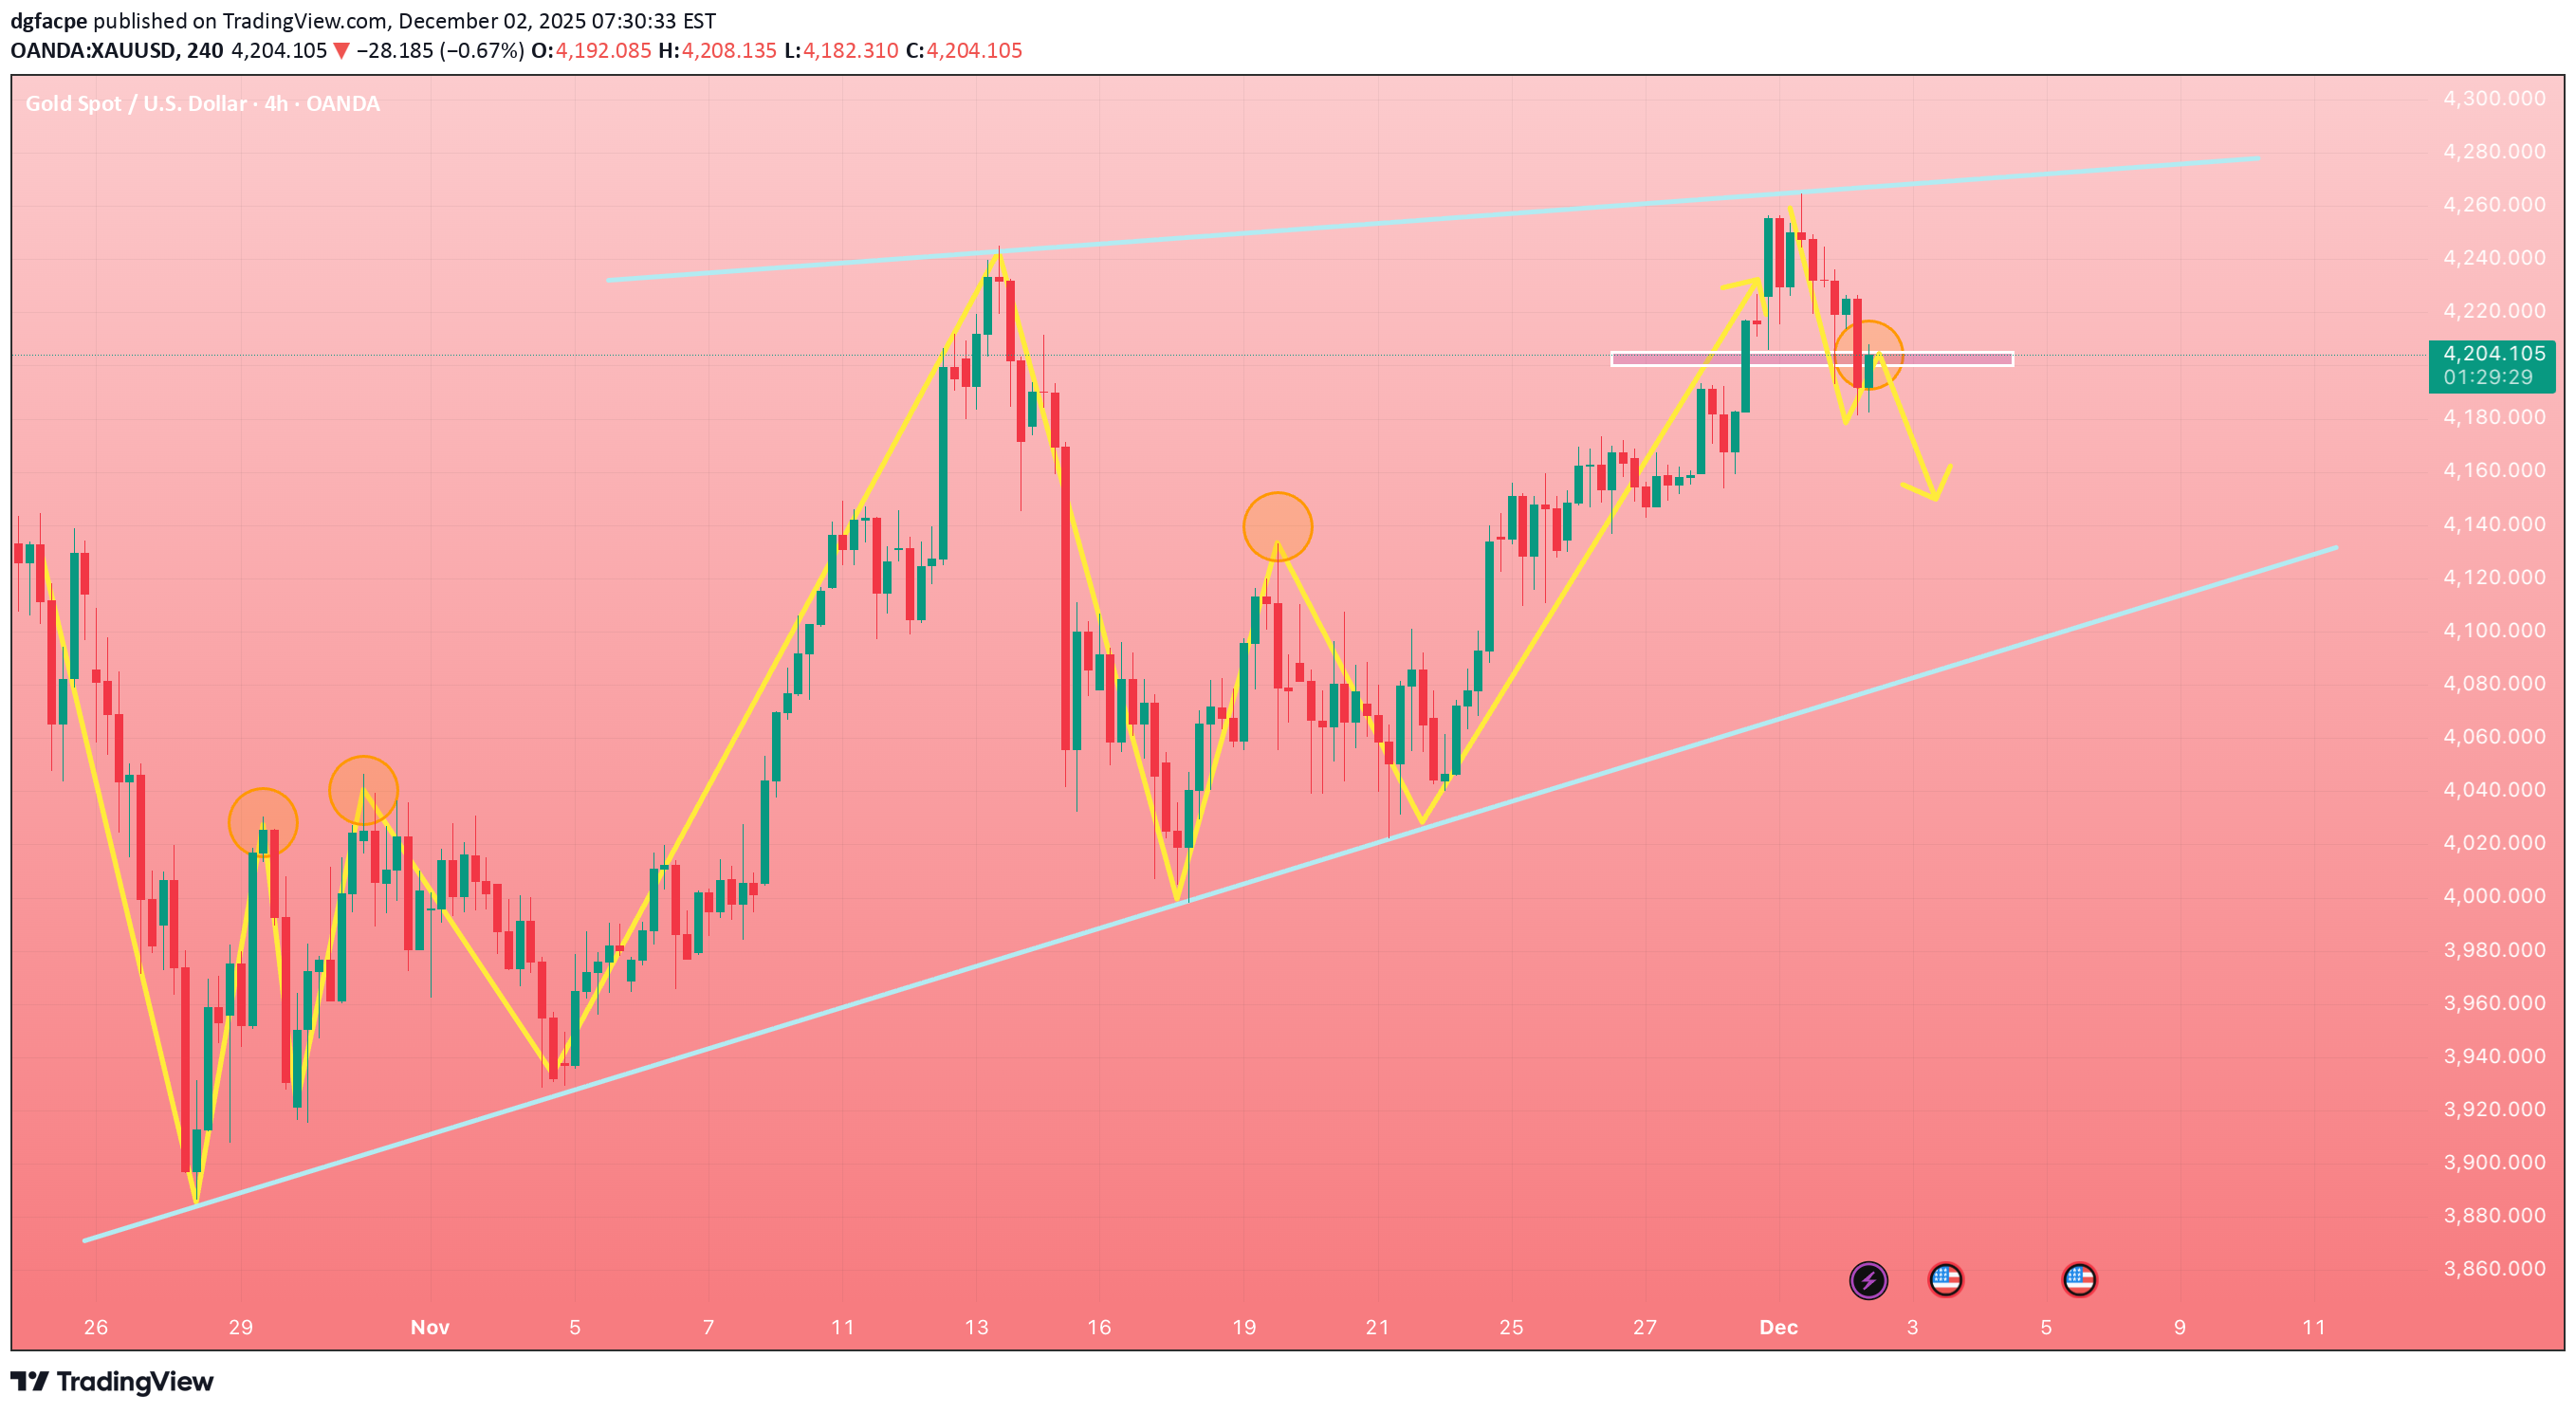
On Tuesday (December 2nd) in early European trading, gold fell approximately 0.92%, trading around $4192. After hitting a six-week high ($4264.43) the previous day, gold prices dipped slightly in early Asian trading on Tuesday, briefly falling to near the $4200 level as investors took profits and awaited key economic data for clues about interest rate cuts. However, gold prices quickly found support on dips. Analysts pointed out that recent geopolitical developments, coupled with rising expectations of a shift towards looser US monetary policy, suggest that gold is likely to remain resilient. Gold has performed strongly this year, benefiting from its role as a traditional safe-haven asset amid political turmoil and economic uncertainty. Investors are closely watching market dynamics, especially as the market digests the latest developments in the Fed's policy path and ongoing geopolitical tensions. The market widely expects the Fed to cut interest rates at its December 10th meeting, with current market pricing indicating an 87% probability of a 25 basis point cut. Analysts point out that market focus has shifted from corporate earnings reports to the Federal Reserve's policy direction. While the monetary policy outlook is easing, the pace of market gains may slow. Meanwhile, US Treasury yields rose due to hawkish comments from the Bank of Japan governor, putting pressure on the real estate and utilities sectors, seen as alternatives to bonds. Furthermore, market speculation that the next Fed governor may adopt a more dovish stance further boosted market sentiment. At the same time, the dollar index fell to a two-week low, making dollar-denominated gold cheaper for holders of other currencies, thus increasing demand. Investors will be watching several key US economic data releases this week, including Wednesday's November ADP employment report and the September Personal Consumption Expenditures (PCE) price index, which has been postponed to Friday. The latter is a key indicator for the Fed to measure inflation. There are no major data releases today; however, attention should be paid to Fed Governor Bowman's testimony before the House Financial Services Committee. December 2nd Gold Price Analysis: Gold continued its downward trend today, providing an opportunity for short positions near 4225. Gold prices have broken below the previous consolidation range on the 4-hour chart. The price action continues to be pressured by short-term moving averages, maintaining a downward trend. In the short term, watch for a potential small rebound followed by a second decline, focusing on the support level around 4170. On the 4-hour chart, the price action has been largely along the short-term moving averages, currently showing a slight breakout. Avoid excessive shorting in the short term. The price action tonight may be compressed between 4160 and 4200. In summary, today's short-term trading strategy for gold is to primarily sell on rallies and secondarily buy on dips. Key resistance levels to watch are 4205-4210, and key support levels are 4173-4160. Please follow the trading signals carefully.Short Selling Strategy: Sell gold in batches around 4200-4205, with a target of 410-4170. Long position strategy: Buy gold in batches around 4160-4165, with a target of around 4180-4190.
Disclaimer
Any content and materials included in Sahmeto's website and official communication channels are a compilation of personal opinions and analyses and are not binding. They do not constitute any recommendation for buying, selling, entering or exiting the stock market and cryptocurrency market. Also, all news and analyses included in the website and channels are merely republished information from official and unofficial domestic and foreign sources, and it is obvious that users of the said content are responsible for following up and ensuring the authenticity and accuracy of the materials. Therefore, while disclaiming responsibility, it is declared that the responsibility for any decision-making, action, and potential profit and loss in the capital market and cryptocurrency market lies with the trader.