
bryandowningqln
@t_bryandowningqln

What symbols does the trader recommend buying?
Purchase History
پیام های تریدر
Filter
bryandowningqln
متاپلنت رکورد زد؛ بیت کوین در آستانه جهش بزرگ قیمتی؟

Metaplanet, a key player in the cryptocurrency arena, has recently made headlines by becoming the fourth largest public Bitcoin holder with an astounding 30,823 BTC in its portfolio. This significant acquisition not only cements Metaplanet’s status among the titans of the space but also comes alongside a bold strategic announcement: a doubling of its fiscal year 2025 outlook and the unveiling of Phase II plans. In parallel, market analysts are abuzz with forecasts that Bitcoin’s price is on the brink of a breakout, fueled by expanding liquidity, unique market signals, and broader macroeconomic dynamics. In this article, we will delve deeply into these developments, covering the following topics in detail: 1.Metaplanet’s New Bitcoin Holdings and Strategic Outlook 2.The Mechanics of a Bitcoin Breakout and Expanding Liquidity 3.Bitcoin’s Price Action Amid U.S. Government Shutdown and Market Volatility 4.On-Chain Data, Technical Resistance, and the Road to $122K, $138K, and Beyond 5.The Interplay Between Bitcoin and Gold – A Renewed Correlation 6.The Role of Options and Gamma Squeezes in HFT, and What They Mean for Retail Investors 7.Market Sentiment, Altcoin Rally, and Broader Crypto Ecosystem Dynamics 8.Future Scenarios: Is $150K Next? 9.Final Thoughts on the Evolving Crypto Landscape Below, we explore each of these themes at length. 1.Metaplanet’s New Bitcoin Holdings and Strategic Outlook In a dramatic move that has captured the attention of investors and the wider crypto community, Metaplanet has announced that it now holds 30,823 BTC, placing it as the fourth largest public Bitcoin holder globally. This acquisition is remarkable not only because of the sheer quantity of Bitcoin acquired but also because it signals a shift in corporate strategy. By doubling its FY2025 outlook and outlining ambitious Phase II plans, Metaplanet is setting itself up for a phase of aggressive expansion and innovation within the crypto sphere. a. The Significance of 30,823 BTC Holding over 30,000 Bitcoin has strategic implications that go beyond mere number crunching. In the volatile world of digital assets, accumulating such a significant quantity of Bitcoin conveys multiple messages: • It demonstrates a tremendous degree of confidence in Bitcoin’s long-term prospects. • It provides Metaplanet with increased market influence and voting power in decentralized governance discussions, should that become more prevalent. • The large reserve can serve as a buffer during market downturns, allowing the firm to leverage its holding for additional financial instruments or strategic investments. As the fourth largest public holder, Metaplanet now joins the ranks of institutional investors and hedge funds that have steered Bitcoin’s price movement over the past years. The sheer scale of the purchase suggests that they likely secured favorable terms and positioned themselves to benefit from both short-term market fluctuations and the long-term appreciation of Bitcoin. b. Doubling the FY2025 Guidance and Phase II Plans Alongside this substantial acquisition, Metaplanet has doubled its guidance for fiscal year 2025. This bold projection is rooted in the belief that the cryptocurrency market is set for exponential growth. By revising its revenue and operational forecasts upward, Metaplanet signals to the market that they are optimistic about the contraction between market cycles and ready to capture additional market share. This revised outlook is not only about numbers; it reflects a strategic reorientation that could involve: • Expanding research and development in blockchain technology • Broadening the range of digital assets held in the company portfolio • Launching new projects aimed at increasing liquidity, reducing transaction costs, or capitalizing on blockchain’s technological innovations • Forming new strategic partnerships to help further integrate Bitcoin and other digital tokens into conventional financial platforms The announced Phase II plans, while not disclosed in minute detail, hint at an expanded digital asset management framework. Investors can expect that Metaplanet will leverage this new phase to build advanced trading algorithms, develop high-frequency trading (HFT) infrastructure, and possibly even explore decentralized finance (DeFi) integrations. As the market evolves, having a robust and flexible digital strategy can be a key differentiator. 2. The Mechanics of a Bitcoin Breakout and Expanding Liquidity One of the central questions dominating the crypto market right now is whether Bitcoin is poised for a breakout, with many analysts pointing to expanded liquidity and increased market participation. Recent trends show that liquidity in Bitcoin markets has been heating up, suggesting that the price could be ready to surge higher than the current levels. a. Liquidity’s Role in Price Movements Liquidity, in the context of Bitcoin, refers to the ease with which large volumes of Bitcoin can be bought or sold without substantially impacting the market price. High liquidity is typically associated with a stable and robust market environment; however, in a bull market scenario, expanding liquidity can sometimes serve as a precursor to rapid price acceleration. The reasoning behind this is twofold: • Institutional investors entering the space often bring with them significant capital. This capital infusion increases the available liquidity in the market and signals confidence to other market participants. • The ability to quickly absorb large orders means that once the price breaks a critical threshold, there isn’t a bottleneck that restricts further upward movement. Instead, the market rapidly adjusts, allowing prices to soar. Several key signals lend credence to the notion that Bitcoin is on the cusp of a major breakout. Recent market trends indicate a closing of Bitcoin’s daily candles on a green note for September, suggesting momentum is building. Market analysts have been pointing to these key liquidity signals as natural catalysts for what some industry insiders are calling “Uptober”—a period in which Bitcoin could experience significant gains. b. Did Bitcoin “Uptober” Just Start? It is a familiar refrain among Bitcoin enthusiasts that every autumn, Bitcoin sets the stage for upward surges, especially after a period of consolidation during the summer months. Now, with both on-chain data and macroeconomic indicators aligning, some analysts suggest that Bitcoin’s “Uptober” might have already commenced. The factors at play include: • Robust fundamentals: Bitcoin continues to attract institutional interest, and its underlying technology remains a cornerstone of digital asset innovation. • Positive technical signals: Studies of market internals point toward strength in buying volume and notable upward pressure at key resistance levels. • External catalysts: Geopolitical events, such as government shutdowns, and the resulting flight from traditional markets to alternative assets are also boosting appetites for Bitcoin. For traders, this creates a mixture of optimism and caution. With increased liquidity and fresh capital entering the market, technical resistance zones may be tested, and any break above these hurdles could unleash a series of automated buy orders, driving the price even higher. 3. Bitcoin’s Price Action Amid U.S. Government Shutdown and Market Volatility In a dramatic twist of events, Bitcoin recently surged past $118,000, coinciding with a U.S. government shutdown that rattled traditional markets. This watershed moment is noteworthy for several reasons. a. Bitcoin’s Ascent to $118,000 The backdrop to Bitcoin’s meteoric rise was an early morning session on Wall Street, marred by uncertainty and declining sentiment caused by the shutdown. As traditional equities tumbled, Bitcoin became a haven for risk-tolerant investors. Observers noted that while conventional markets were grappling with fiscal deadlock and regulatory uncertainties, Bitcoin managed to attract buying pressure. Moving above $118,000, Bitcoin reached new highs, capturing the attention of traders globally. This surge can be seen as a manifestation of one powerful narrative: when traditional financial markets are in turmoil, Bitcoin – thanks to its decentralized nature – can benefit from a flight-to-quality phenomenon. Investors start looking at non-correlated assets, and Bitcoin, with its limited supply and increasing institutional backing, becomes an attractive alternative. b. How Government Shutdowns Affect Crypto Markets Government shutdowns in the United States tend to have widespread effects on investor confidence. With government agencies partially or fully closed, uncertainty looms over various economic indicators and future fiscal policies. This uncertainty can lead to: • A temporary shift away from traditional equities and bonds towards alternative investments • Heightened volatility in conventional markets, which may prompt traders to seek refuge in assets that are not directly tied to government policy • Increased trading activities in markets that offer liquidity and minimal interference, such as Bitcoin and other digital assets In this context, Bitcoin’s ability to break through key resistance levels – such as $118,000 – under the stress of a U.S. government shutdown is particularly noteworthy. It underscores the resilience of the cryptocurrency and hints at its growing role as a hedge in periods of fiscal uncertainty. 4. On-Chain Data, Technical Resistance, and the Road to $122K, $138K, and Beyond As Bitcoin continues to defy expectations, on-chain data and technical analysis have become crucial tools for understanding its future trajectory. According to several metrics, Bitcoin is far from overheated and its price could potentially test new resistance levels in the near future. a. Reading Between the Lines of On-Chain Data On-chain data refers to real-time metrics derived from Bitcoin’s blockchain, such as transaction volumes, active addresses, and the flow of coins between wallets. Analysts have increasingly relied on this data to gauge market sentiment and predict short-term price movements. Recent observations indicate that while Bitcoin’s price has surged, the underlying on-chain activity remains robust yet not excessively overheated. Notable resistance levels have been identified at approximately $122,000 and $138,000, which will likely serve as important psychological and technical hurdles. These numbers are more than just arbitrary targets; they are derived from an in-depth analysis of order books, liquidity pools, and historical price action. When Bitcoin consistently closes above $117,500 on the daily charts, it suggests that buying pressure is strong enough to override potential mid-term corrections. This level appears to be the threshold beyond which Bitcoin might unlock more profound gains. b. Technical Indicators and Resistance Dynamics Technical analysts are scrutinizing several key indicators that can provide hints about Bitcoin’s next move: • Moving averages: Long-term moving averages continue to offer support as the price climbs, with no significant breakdowns noted in recent weeks. • Volume indicators: Elevated trading volumes, combined with positive market sentiment, are contributing to a stable uptrend. • Fibonacci retracement levels: These are being used to predict potential pullbacks, and the current setup indicates that any retracement could be shallow in the context of a broader bull run. Should Bitcoin breach the $122,000 and $138,000 levels, it could set the stage for even higher targets, such as a historic quarterly close above $150,000. Investors and traders are therefore paying close attention to these technical patterns, as they offer early signals about whether the current momentum has the strength for a sustained breakout. 5. Bitcoin and Gold: A Renewed Correlation One of the most intriguing developments in recent months is the revived correlation between Bitcoin and gold—a traditional safe-haven asset. While historically considered distinct asset classes, both gold and Bitcoin have shown simultaneous bullish behavior in the current market environment. a. The Convergence of Two Worlds Gold has long been perceived as a store of value during times of economic or geopolitical uncertainty. With the U.S. government shutdown fueling fears around traditional markets, many investors have turned to gold. Interestingly, Bitcoin has followed suit, with its price nearing $117,000 at one point as bulls chased similar safe-haven narratives. This convergence is particularly compelling because it highlights a broader trend: as liquidity expands in the global economy, both gold and Bitcoin may benefit from similar momentum. Investors in both markets are looking for assets that are not directly tied to central bank policies, and this shared characteristic can lead to a synchronized upward movement. b. The Technical Implications of a Gold Correlation The current bullish outlook for gold is derived not only from its intrinsic value but also from its performance under conditions of market stress. In a similar vein, Bitcoin traders are increasingly analyzing gold’s price behavior to draw parallels to what may be expected in the digital asset space. A key signal is the retest of supply walls around $117.5K for Bitcoin, which, if cleared, may indicate that the market is ready to ride a new wave of bullish momentum. Furthermore, the concept of liquidity expansion in gold—driven by global macroeconomic factors—underscores the idea that Bitcoin’s rising liquidity can similarly propel the asset higher. Thus, the renewed gold correlation is not merely a coincidental alignment; it is an indication that global capital flows are increasingly seeking non-traditional hedges in times of fiscal uncertainty. 6. The Role of Options, Gamma Squeezes, and High-Frequency Trading No discussion of Bitcoin price dynamics in today’s market would be complete without addressing high-frequency trading (HFT) tactics, including the role of options and gamma squeezes. A chemical reaction of sorts, these events can cause rapid and dramatic price movements that are often exploited by sophisticated HFT firms. a. Understanding Gamma in the Options Market At the heart of many short-term strategies used by HFT firms is the concept of gamma—a measure derived from the options market that quantifies the sensitivity of an option’s delta (its price sensitivity to changes in the underlying asset’s price). When market makers sell options, they often find themselves short gamma. This means they must continuously hedge their positions as underlying stock prices fluctuate, a process that can force a series of transactions in the underlying asset. If the underlying stock moves sharply in one direction, the ensuing hedging activity can create a “gamma squeeze.” In this scenario, market makers are compelled to buy or sell the underlying asset to adjust their hedges, thereby amplifying the price move. This phenomenon is seen most prominently in high-volume stocks like Apple and Microsoft, where the derivatives market is highly developed. b. High-Frequency Trading and Front-Running the Squeeze HFT firms have developed sophisticated algorithms that monitor options chain data in real time for signs of an impending gamma squeeze. Once detected, they can quickly position themselves to capture the momentum in just a few seconds or minutes. In the case of a stock like Apple, a significant gamma squeeze can push the share price higher as market makers rush to adjust their positions. Over time, these micro-movements compound, potentially influencing not only the stock’s price but also broader index levels. Understanding how these dynamics work is critical because they highlight some hidden secrets of the market that retail traders simply cannot see without advanced tools and access to direct data feeds. By incorporating gamma analysis into their trading strategies, HFT firms have refined techniques that enable them to profit from ephemeral opportunities that last mere seconds, all while transmitting these effects into broader market trends. 7. Market Sentiment, Altcoin Rally, and Broader Crypto Ecosystem Dynamics While Bitcoin remains the flag bearer, the broader cryptocurrency ecosystem is also experiencing significant dynamism. Recent developments have buoyed altcoins like Solana, XRP, and Dogecoin—each riding a 4% rally as U.S. government-induced volatility pointed investors toward alternative assets. a. Altcoin Rally Amid Fiscal Uncertainty The backdrop of a U.S. government shutdown creates a scenario in which liquidity constraints in the traditional markets force investors to look for diversifiers. Altcoins, often seen as riskier but potentially more lucrative investments, have benefitted from this shift in sentiment. As Bitcoin’s price surges, the spillover effect is driving a broader altcoin rally that is momentarily lifting multiple tokens by double-digit percentages. Investors who understand these intermarket dynamics recognize that while Bitcoin often leads the charge, altcoins can present short-term opportunities driven by speculation and shifting risk appetites. However, traders should always be aware that these moves are often volatile and subject to rapid reversals when the market rebalances. b. The Interconnectedness of the Crypto Ecosystem What makes the current crypto environment particularly fascinating is the level of interconnectedness between various digital assets. Bitcoin’s rise often triggers bull runs in alternative coins, while the liquidity dynamics in traditional financial instruments can affect crypto market behavior. For instance, as the U.S. government shutdown unfolds and traditional markets experience stress, a flight to digital and alternative assets ensues, bolstering liquidity across the board. This interconnectedness also extends to the technological innovations propelling the market. With improvements in blockchain scalability, enhanced security protocols, and better on-chain data analysis, the crypto ecosystem is now better equipped to process high volumes of transactions efficiently. When combined with increased institutional interest, these factors create a robust environment that is ideal for both Bitcoin and its altcoin counterparts. 8. Future Scenarios: Is $150K the Next Milestone? Given the current bullish indicators, many market analysts are debating the next critical milestone for Bitcoin. Could Bitcoin hit or even exceed $150,000 in the near term? While it is impossible to predict the future with absolute certainty, there are several compelling arguments for why Bitcoin could surge even higher. a. Projections Based on On-Chain and Technical Data Recent on-chain analysis suggests that Bitcoin’s fundamentals remain strong despite rapid price increases. With resistance levels identified at $122,000 and $138,000, a sustained break above these levels would set the stage for a dramatic upward move. One popular narrative is that Bitcoin must consistently close above $117,500 on daily charts to invalidate current mid-term correction scenarios. If it does, the momentum could propel the cryptocurrency toward new territory, including a potential historic quarterly close above $150,000. Furthermore, significant accumulation by large holders such as Metaplanet suggests that institutional investors believe in the long-term value of Bitcoin. Their involvement provides an additional layer of support, both psychologically and financially, for continued upward movement. b. Broader Macro-Economic Trends The macroeconomic environment also plays a crucial role in shaping Bitcoin’s future price trajectory. As governments worldwide implement policies to mitigate the impact of economic slowdowns or potential inflationary trends, investing in assets like Bitcoin and gold becomes increasingly attractive. A resurgence in risk-on behavior in global markets, combined with the ongoing U.S. government shutdown and its associated uncertainties, may provide the perfect setting for another upward surge in Bitcoin’s price. c. What Does This Mean for Investors? For investors, the debate over whether Bitcoin can reach $150K is both exciting and challenging. On one hand, the vibrant technical and macroeconomic signals offer a compelling case for further price appreciation; on the other hand, the inherent volatility in the crypto market means that caution is always warranted. Smart investors will approach such scenarios by diversifying their holdings, setting appropriate risk management strategies, and closely monitoring key technical levels. 9. Final Thoughts: Navigating a Transformative Crypto Landscape The recent moves by Metaplanet to acquire a massive reserve of Bitcoin and double its FY2025 outlook, combined with the tantalizing signs of a Bitcoin breakout amid liquidity expansion, mark a pivotal moment in the development of the cryptocurrency market. The convergence of factors—from on-chain data and technical resistance levels to macroeconomic uncertainty and cross-asset correlations with gold—paints a picture of an evolving market setting the stage for dramatic price moves. a. The Implications of Metaplanet’s Strategy Metaplanet’s strategic expansion and acquisition of 30,823 BTC serve as a strong testament to the institutionalization of digital assets. By becoming the fourth largest public Bitcoin holder, the firm not only increases its influence in the market but also sets a benchmark for other players to follow. Their commitment to an aggressive FY2025 outlook and the development of Phase II plans indicate that they see a transformative shift on the horizon—one that will likely push the boundaries of what is possible within the crypto and broader financial ecosystems. b. The Road Ahead for Bitcoin As liquidity continues to expand and Bitcoin traders gear up for a potential breakout, attention will soon focus on the key resistance levels in the coming weeks. Analysts are already pointing to $122,000 and $138,000 as critical benchmarks that, if breached, could herald a wave of upward momentum. Coupled with the renewed correlation with gold and the sophisticated HFT strategies that dominate market dynamics, the stage is set for a period of exciting, albeit volatile, trading opportunities. c. Strategies for Traders and Investors For retail and institutional investors alike, navigating this dynamic market environment requires a well-informed and measured approach. Some key strategies include: • Close monitoring of on-chain data and technical indicators to identify early signals of potential breakouts. • Implementing robust risk management protocols, given the inherent volatility of rapidly moving markets. • Staying updated on macroeconomic developments, such as government shutdowns and geopolitical tensions, which can have an outsized impact on investor sentiment. • Keeping a diversified portfolio that spans both traditional assets like gold and innovative digital assets like Bitcoin. • Considering educational opportunities, such as courses or tutorials on options trading, gamma analysis, and HFT strategies, to deepen one’s understanding of the underlying market mechanics. d. The Broader Context of Market Innovation The explosive growth witnessed in the cryptocurrency market is not occurring in isolation. It is part of a broader trend of market innovation driven by blockchain technology, algorithmic trading, and increasing institutional participation. As digital assets become ever more integrated into the traditional financial system, the lines between conventional finance and crypto are gradually blurring. This evolution will not only foster new opportunities but also bring fresh challenges for regulators and market participants. Institutions like Metaplanet are at the forefront of this transformative journey, driving innovation while managing the risks associated with a rapidly evolving asset class. Conclusion In summary, Metaplanet’s recent milestone of acquiring 30,823 BTC and its decision to double its FY2025 outlook underscore the growing institutional confidence in Bitcoin and the broader crypto market. With the company now recognized as the fourth largest public holder, its strategic moves send a clear signal: the time for digital asset innovation is now. This announcement comes at a time when Bitcoin’s price appears poised for a breakout, driven by expanding liquidity, strong on-chain metrics, and renewed macroeconomic uncertainty. As Bitcoin teeters on the brink of potentially historic price levels—pushing past $118,000 in the wake of market dislocations from a U.S. government shutdown and forging ahead toward key resistance zones—traders and investors better get ready for what might be one of the most transformative periods in crypto history. Whether it’s the imminent “Uptober” rally, the strategic bullish positioning of institutions like Metaplanet, or the intricate dance of HFT algorithms exploiting gamma squeezes, the narrative is clear: the dynamics of the cryptocurrency market are evolving at a breakneck pace. For those looking to capitalize on these opportunities, the key lies in staying informed and leveraging advanced data, technical analysis, and diversified strategies to navigate the inherent volatility. In this rapidly shifting landscape, education, adaptability, and disciplined risk management will be essential tools for success. As we move forward into the final quarter of 2025 and beyond, the convergence of technical, institutional, and macroeconomic factors suggests that Bitcoin’s journey may have only just begun. Metaplanet’s bold moves serve as a reminder that the world of digital finance is replete with high-stakes opportunities—but also considerable risks. Investors who can read the signals, stay ahead of market shifts, and incorporate the latest technologies and strategies will be best positioned to thrive in this dynamic ecosystem. Ultimately, whether Bitcoin reaches new heights of $150,000 or even beyond will depend on the delicate interplay of market fundamentals, technical breakouts, regulatory developments, and global economic trends. What is certain, however, is that the crypto market is entering an era of unprecedented change and innovation. And with major players such as Metaplanet making strategic moves, the future of digital assets looks both exciting and profoundly transformative. As we continue to monitor these developments, traders and investors should keep a keen eye on key technical thresholds, remain agile in the face of volatility, and recognize that the path forward is as much about strategic foresight as it is about seizing immediate market opportunities. The next chapter in Bitcoin’s evolution—and indeed in the broader narrative of cryptocurrency—may well be written in the coming months. And for those ready to ride this wave, the rewards could be nothing short of revolutionary. As we conclude this in-depth exploration, remember that success in markets driven by rapid innovation comes from embracing change, continuously learning, and leveraging every piece of actionable intelligence available. With players like Metaplanet leading the charge, the journey toward a new era in digital finance is well underway. Enjoy the ride, stay vigilant, and be ready for the breakout that could define an entire generation of cryptocurrency trading. This article has provided a comprehensive look at the current state and future outlook of Bitcoin, as well as the strategic maneuvers by major market players. From the gamma ripple in high-frequency trading to historical quarterly closes and potential targets beyond $150,000, the evolving narrative of Bitcoin is as complex as it is compelling. We look forward to reporting more breakthroughs, market insights, and analytical perspectives as the crypto landscape continues to transform. Thank you for joining us on this deep dive into one of the most pivotal moments in the crypto world. For more detailed analysis, debugging of trading algorithms, and insights into future digital innovations, stay tuned to fontlabsnet.com and subscribe to our newsletter for exclusive content. Stay Updated To keep abreast of similar narratives and detailed market analyses, be sure to follow our updates. With ongoing shifts in economic conditions, regulatory landscapes, and technological advancements, staying informed has never been more crucial. Happy trading, and here’s to a future defined by innovation and strategic foresight!
bryandowningqln
Gold’s Decade Shines Less Brightly for Stocks: The New Rational

Gold’s Decade Shines Less Brightly for Stocks: The New Rationale for the King Metal For over a decade, the narrative surrounding gold was one of stark contrast to the equity markets. As stock indices, powered by tech innovation and ultra-low interest rates, embarked on a historic bull run, gold was often relegated to the sidelines—a relic for the fearful, an underperforming asset in a world chasing yield. The 2010s were, without question, the decade of the stock market. Gold’s shine, by comparison, seemed dull. But a perceptible shift is underway. The latest rally in gold, which has seen it scale unprecedented nominal heights, is not the frantic, fear-driven surge of past crises. Instead, it appears to be driven by a more sober, strategic, and perhaps more durable force: the rational calculations of central banks and a fundamental rewiring of the global financial architecture. This new rationale suggests that gold’s resurgence may not spell immediate doom for stocks, as traditional wisdom would hold, but rather reflects a new, more complex macroeconomic reality where the two can coexist, albeit with gold casting a long, less brilliant shadow over the equity landscape. The Ghost of Gold Rallies Past: A Tale of Fear and Froth To understand the significance of the current rally, one must first revisit the drivers of previous gold booms. Historically, gold’s major upward moves were tightly correlated with periods of acute stress and negative real interest rates. The post-2008 financial crisis surge, which took gold from around $800 an ounce in 2008 to over $1,900 in 2011, was a classic "fear trade." The world was confronting a systemic banking collapse, unprecedented monetary experimentation in the form of Quantitative Easing (QE), and rampant fears of runaway inflation and currency debasement. Gold was the safe haven, the hedge against a collapsing system. Similarly, the spike in mid-2020, at the onset of the COVID-19 pandemic, was a panic-driven flight to safety as global economies screeched to a halt. These rallies shared common characteristics: they were often sharp, volatile, and ultimately prone to significant retracements. When the immediate crisis abated—when inflation failed to materialize post-2008, or when fiscal and monetary stimulus ignited a V-shaped stock market recovery in 2020—the rationale for holding a non-yielding asset weakened. Money flowed back into risk assets like stocks. Gold’s role was binary: it was the asset for when things were falling apart. In a functioning, risk-on market, it had little place. This created the perception of an inverse relationship. A strong gold price was a signal of market distress, and thus, bad for stocks. But this decade is different. The New Architects: Central Banks and Strategic Repatriation The most profound change in the gold market has been the transformation of its largest and most influential buyers: central banks. For years, the narrative was that developed Western central banks, holders of the world’s primary reserve currencies, were gradually diversifying away from gold. The modern financial system, built on the U.S. dollar, Treasury bonds, and other interest-bearing instruments, was deemed superior. That assumption has been decisively overturned. Since around 2010, but accelerating dramatically in recent years, central banks—particularly those in emerging economies—have become net purchasers of gold on a massive and sustained scale. The World Gold Council reports that central banks have been adding to their reserves for over a decade, with annual purchases hitting multi-decade records. This buying is not driven by panic. It is a calculated, long-term strategic move rooted in three key rationales: 1.De-dollarization and Geopolitical Hedging: The weaponization of the U.S. dollar through sanctions, particularly against Russia following its invasion of Ukraine, served as a wake-up call for nations not squarely in the U.S. geopolitical orbit. Holding vast reserves in U.S. Treasury bonds suddenly carried a new risk: they could be frozen or seized. Gold, by contrast, is a sovereign asset. It can be held within a nation’s own vaults, is nobody’s liability, and is beyond the reach of any other country’s financial system. For China, Russia, India, Turkey, and many nations in the Global South, accumulating gold is a strategic imperative to reduce dependency on the dollar and insulate their economies from geopolitical friction. 2.Diversification Against Fiscal Profligacy: Even for allies of the U.S., the sheer scale of U.S. government debt is a growing concern. With debt-to-GDP ratios at record levels in many developed nations and little political will to address them, the long-term value of fiat currencies is being questioned. Central banks are increasingly viewing gold as a perennial hedge against the fiscal and monetary policies of their allies—a form of insurance against the potential devaluation of the very government bonds that form the backbone of their reserves. 3.A Return to a Multi-Polar Financial World: The post-Bretton Woods era has been dominated by the U.S. dollar. There are increasing signs that the world is shifting towards a multi-polar system, with the euro, Chinese yuan, and possibly other currencies playing larger roles. In such a transitional period, gold’s historical role as a neutral, trusted store of value becomes immensely attractive. It is the one asset that is not tied to the economic fortunes or policies of a single nation. This central bank demand provides a powerful, structural floor under the gold price. It is consistent, price-insensitive buying (they are not chasing momentum but executing a strategy) that is largely divorced from the short-term sentiment swings of the stock market. This is the "more rational calculation" that makes the current rally fundamentally different and potentially longer-lasting. The Interest Rate Conundrum: Gold’s Old Nemesis Loses Its Bite For years, the primary argument against gold was simple: it offers no yield. In a world of rising interest rates, where investors can earn a attractive, risk-free return on cash or government bonds, the opportunity cost of holding gold becomes prohibitive. The theory held that the Federal Reserve’s aggressive hiking cycle from 2022 onward would crush the gold price. It didn’t. Gold not only weathered the storm but continued its ascent. This paradox reveals another layer of the new rationale. While nominal rates rose, real interest rates (nominal rates minus inflation) have been more ambiguous. Periods of high inflation meant that even with higher rates, the real return on cash and bonds was often negative or minimal. In such an environment, gold, as a traditional inflation hedge, retains its appeal. More importantly, the market’s focus has shifted from the level of rates to their trajectory. There is a growing belief that the era of structurally higher interest rates is unsustainable, given the colossal levels of global debt. Servicing this debt becomes exponentially more difficult as rates rise. Therefore, many market participants are betting that the current rate cycle represents a peak, and that central banks will be forced to cut rates sooner rather than later, regardless of the inflation fight. Gold performs well in a environment of falling rates, and this anticipation is being priced in now. Furthermore, high rates have begun to expose fragilities in the system, from regional banking crises in the U.S. to debt distress in emerging markets. In this sense, high rates haven't killed gold’s appeal; they have reinforced its role as a hedge against the consequences of high rates—namely, financial instability. A Less Bright Shine for Stocks: Coexistence in a New Reality So, what does this new, rationally-driven gold bull market mean for stocks? The relationship is no longer a simple inverse correlation. It is more nuanced, suggesting a future of coexistence rather than direct competition, but one where gold’s strength signals underlying headwinds that will dim the stellar returns equities enjoyed in the previous decade. 1.The End of the "Free Money" Era: The 2010s were built on a foundation of zero interest rates and quantitative easing. This environment was nirvana for growth stocks, particularly in the tech sector, as future earnings were discounted at very low rates, justifying sky-high valuations. The new macroeconomic order—one of higher structural inflation, larger government debt, and geopolitical fragmentation—is inherently less favorable to such valuation models. Gold’s strength is a symptom of this new order. It doesn’t mean stocks will collapse, but it does suggest that the era of effortless, broad-based double-digit annual returns is likely over. Returns will be harder won, more selective, and more volatile. 2.A Hedge Within a Portfolio, Not a Replacement: Investors are now likely to view gold not as a binary alternative to stocks, but as a critical component of a diversified portfolio. In a world of heightened geopolitical risk and uncertain monetary policy, holding a portion in gold provides stability. This means fund flows are not a simple zero-sum game between the SPDR Gold Trust (GLD) and the SPDR S&P 500 ETF (SPY). Institutions and individuals may increase allocations to both, using gold to mitigate the specific risks that now loom over the equity landscape. 3.Sectoral Winners and Losers: A strong gold price is a direct positive for gold mining stocks, a sector that has been largely neglected for years. This could lead to a resurgence in this niche part of the market. Conversely, the factors driving gold—higher inflation and rates—are headwinds for long-duration assets like high-flying tech stocks. The outperformance may shift towards value-oriented sectors, commodities, and industries with strong pricing power and tangible assets. The stock market’s shine may dim overall, but it will create bright spots in new areas. 4.The Signal of Sustained Uncertainty: Ultimately, a gold market driven by central bank de-dollarization and fiscal concerns is a barometer of persistent, low-grade global uncertainty. This is not the acute panic of 2008, but a chronic condition of fragmentation and distrust. Such an environment is not conducive to the explosive, confidence-driven growth that stock markets thrive on. It favors caution, resilience, and tangible value over speculative growth. Gold’s steady ascent is the clearest signal of this psychological shift. Conclusion: A Duller but More Enduring Glow The gold rally of the 2020s is not a siren call of an imminent market crash. It is the quiet, determined accumulation of a strategic asset by the world’s most powerful financial institutions. It is a vote of no confidence in the unfettered dominance of the current financial order and a bet on a more fragmented, uncertain future. For stock market investors, this does not necessarily portend a bear market. Instead, it heralds a more challenging environment where the tailwinds of globalization and cheap money have reversed. The dazzling shine of the stock market’s previous decade is likely to be replaced by a duller, more realistic glow. Returns will be more modest, risks more pronounced, and the need for prudent diversification more critical than ever. In this new era, gold and stocks will learn to coexist. The king of metals is no longer just a refuge for the fearful; it has become a strategic holding for the rational. Its decade may not shine with the same speculative brilliance as the stock market’s last bull run, but its light may well prove to be more enduring, illuminating a path through a landscape of greater complexity and risk. The lesson for investors is clear: the old rules are changing, and in this new game, gold holds a very strong hand.
bryandowningqln
How Bitcoin Profits Are Fueling Gold's Record Surge

In the intricate dance of global markets, a subtle yet significant choreography unfolded, revealing a profound shift in investor sentiment. As Bitcoin, the volatile flag-bearer of the digital asset revolution, stumbled, a powerful wave of capital appeared to flow into a more ancient store of value. Roughly an hour after Bitcoin’s pronounced drop, gold, the timeless emblem of wealth and stability, surged to notch yet another record high. This sequence of events was more than a random fluctuation; it was a clear signal of a sophisticated market maneuver: a profit rotation from the speculative froth of cryptocurrency into the hard certainty of precious metals. The divergence highlights a critical test of the "digital gold" narrative that has propelled Bitcoin for years. While safe-haven flows have traditionally sought refuge in bullion during times of uncertainty, the recent price action suggests a more complex, multi-layered dynamic is at play. Investors, having reaped substantial gains from the crypto market, appear to be de-risking and preserving those profits in an asset benefiting from its own powerful macroeconomic tailwinds. This "digital-to-physical shuffle" offers a compelling glimpse into the evolving relationship between these two assets and the strategic thinking of modern investors navigating a landscape of persistent inflation, geopolitical tension, and shifting monetary policy. Anatomy of the Divergence: Why Bitcoin Stumbled While Gold Rallied The recent price action did not occur in a vacuum. Bitcoin’s slide was a culmination of factors signaling potential "cycle exhaustion." The drop triggered a brutal leverage washout, with a massive volume of bullish crypto wagers liquidated, hitting smaller tokens particularly hard. This cascade of liquidations suggests that the recent rally was fueled by speculative excess, making it vulnerable to a sharp correction. The narrative of Bitcoin as a stable safe haven has been challenged, as its behavior mirrored that of a high-beta risk asset, sensitive to shifts in market liquidity and sentiment. Conversely, gold's ascent to a record high is built on a much firmer, multifaceted foundation. The rally is powerfully supported by several key drivers. A primary driver is the aggressive and sustained accumulation by the world’s central banks. For several years running, official sector buying has reached historic levels, with institutions in emerging markets leading the charge to diversify their reserves away from the U.S. dollar and hedge against geopolitical risk. This sustained, large-scale demand creates a strong underlying price support that is independent of speculative flows. Furthermore, expectations of monetary easing have further fueled gold's appeal. Lower interest rates decrease the opportunity cost of holding non-yielding bullion, making it more attractive to investors. With markets anticipating a cycle of rate cuts, the macroeconomic environment appears highly conducive to further gold upside. Finally, ongoing geopolitical conflicts and stubborn inflation have amplified demand for gold as the ultimate monetary insurance policy. Faced with currency devaluation risks and systemic uncertainty, both institutional and retail investors have flocked to the yellow metal, which has a multi-millennia track record as a reliable store of value. This confluence of factors has propelled gold's rally, leading many market observers to revise their forecasts upward. The Rotation Thesis: Locking in Digital Profits in Physical Metal The most compelling aspect of the market action was the timing. The roughly one-hour lag between Bitcoin’s significant drop and gold’s subsequent rally is a tell-tale sign of a deliberate capital rotation. This is not the instantaneous reaction of an algorithmic panic, but the considered move of traders and fund managers observing a trend, assessing the risk-off sentiment, and redeploying capital. This is not the first time this pattern has emerged. In previous market cycles, steep liquidations in cryptocurrency futures have often been followed by noticeable inflows into gold-backed investment vehicles. The current scenario appears to be a larger, more pronounced version of this dynamic. Traders who have enjoyed Bitcoin's run-up are choosing to lock in those volatile, digital gains by moving them into a more stable asset that is itself in a powerful bull market. This rotation challenges the simplistic notion that Bitcoin is a direct substitute for gold. While both are seen as hedges against fiat currency debasement, their behavior reveals different risk profiles. Bitcoin's recent performance confirms its status as a high-risk, high-reward asset, often correlated with speculative liquidity and risk appetite. Gold, meanwhile, is reasserting its traditional role as a core wealth preservation tool and a hedge against systemic risk, supported by the immense and steady buying pressure from the world's central banks. The market seems to be making a clear distinction: Bitcoin is for speculation; gold is for preservation. Broader Implications: A New Dance for Modern Investors The divergence between gold and Bitcoin carries significant implications for investors and asset allocators. It serves as a powerful reminder that despite the maturation of the crypto market, gold’s role in a diversified portfolio remains unique and irreplaceable. The "digital-to-physical shuffle" is a new market dynamic that investors must understand and navigate. For institutional players, this rotation represents a sophisticated strategy to manage portfolio risk. After a period of high returns in a speculative asset, rebalancing into a stable asset with strong fundamentals is a prudent move. The rise of regulated investment vehicles for both gold and Bitcoin has made executing such cross-asset strategies more seamless than ever, suggesting this dynamic will become a more common feature of market corrections. Looking ahead, the outlook for both assets remains complex. Some analysts believe Bitcoin's correction is a healthy cleansing of speculative excess before it continues its upward trajectory. Others argue that Bitcoin's volatility and regulatory hurdles continue to limit its appeal as a true safe haven compared to gold. What is undeniable, however, is the structural bull case for gold. The powerful trend of de-dollarization and reserve diversification by central banks is not a cyclical fad but a long-term strategic shift. As nations continue to seek a neutral reserve asset to insulate themselves from geopolitical pressures and the weaponization of finance, gold is re-emerging as a tangible monetary anchor. In conclusion, the recent market events were a masterclass in modern market dynamics. Bitcoin's stumble, met with gold's powerful rally, was not a sign of the crypto market's demise, but rather its integration into a more sophisticated global financial ecosystem. It revealed a class of investors capable of harvesting profits from high-risk digital ventures and strategically redeploying them into the time-tested security of precious metals. While Bitcoin continues its volatile journey toward maturity, the episode was a resounding affirmation of gold's enduring power. In a world of increasing uncertainty, the ancient allure of physical gold is not just holding its own—it is shining brighter than ever. D
bryandowningqln
Signal Breakout as SOL Targets ATH and $300+

Solmate’s $300M Launch in the UAE Sparks Solana Treasury Wave: Institutions Signal Breakout as SOL Targets ATH and $300+ The Solana ecosystem is entering a critical new phase of institutional adoption and capital formation, with multiple catalysts converging to form one of the strongest bullish narratives in crypto today. The headline development: Solmate has launched with a $300 million mandate to establish a Solana-focused treasury in the United Arab Emirates. This move, paired with growing institutional interest, potential ETF approvals, and increasingly favorable technicals, has set the stage for a potential breakout rally. Some market participants now see a credible pathway to $300+ for SOL, while others point to new all-time highs as fundamentals and momentum align. This piece explores the strategic implications of Solmate’s treasury launch, the growing momentum behind Solana among institutions like Forward Industries, the macro tailwinds surrounding ETF approvals, and the technical structure that supports a bullish continuation. We’ll also assess the potential risks, the role of on-chain growth, and how the UAE’s regulatory and capital environment could accelerate Solana’s trajectory. Solmate’s $300M UAE Treasury: Why It Matters Solmate’s $300 million capital pool dedicated to establishing a Solana treasury in the UAE is more than a headline number—it’s a signal that institutional-grade asset management for crypto-native assets is globalizing beyond traditional finance hubs. The UAE, and particularly Abu Dhabi and Dubai, have positioned themselves as crypto-forward jurisdictions with clear regulatory sandboxes and proactive frameworks. Establishing a Solana treasury there creates: •A regional liquidity hub: Concentrating capital in a friendly regulatory environment can improve market depth for SOL and Solana-native assets during aggressive expansion phases. •Institutional standardization: A treasury framework can adopt disciplined risk controls, custody standards, and transparent rebalancing strategies, making it a template for other funds and corporates to emulate. •On-ramp for Middle Eastern capital: Sovereign wealth funds, family offices, and regional asset managers have shown interest in digital assets. A Solana-focused treasury in the UAE lowers friction for capital allocation. • Mechanics of a Solana Treasury Treasury operations are more than passive holdings. They typically involve: •Core SOL accumulation: A base allocation that reflects long-term conviction in network value capture, staking yields, and governance. •Liquidity provisioning: Deploying assets in DeFi protocols, AMMs, and order books to enhance liquidity and earn fees, subject to risk controls. •Staking strategies: Validator diversification, slashing protection, and yield optimization through auto-compounding and programmatic rebalancing. •Venture and ecosystem exposure: Strategic allocations to Solana-native projects, tokens, real-world asset (RWA) initiatives, and infrastructure plays (or via index-like baskets). •Hedging overlays: Options and perp hedges to manage drawdowns while maintaining directional exposure. By anchoring these flows in the UAE, Solmate not only signals conviction; it operationalizes a repeatable structure that can absorb larger institutional checks as compliance frameworks and counterparties mature. Forward Industries Bets Big on Solana Forward Industries’ publicized pivot toward SOL underscores a broader shift: institutions are no longer simply “diversifying” into Solana—they are actively rotating into it as a core position. The drivers include: •Performance-to-throughput ratio: Solana’s execution environment continues to deliver high throughput and sub-second finality with low fees, supporting consumer-grade applications such as payments, on-chain order books, and gaming without UX compromise. •DePIN, payments, and consumer apps: From real-time order execution to growth in tokenized assets and payments rails, Solana’s app layer is demonstrating product-market fit in areas where latency and cost matter. •Developer momentum: Tooling, runtimes, and TypeScript-centric development are attracting teams that want to ship quickly with rich UX. Growth in Saga and mobile-focused experiments adds tailwind. •Liquidity concentration: As more capital pools into SOL pairs and Solana’s native DEXs, slippage decreases and the market becomes more attractive for block-sized orders. The “buying frenzy” moniker stems from combined flows across centralized exchanges, on-chain wallets, staking platforms, and prime brokers. Institutional trade sizes are up, and block liquidity providers report rising interest for SOL borrow and cross-margin facilities—both signposts that levered directional exposure and basis trades are heating up. The ETF Wave: SEC Approvals Could Reshape Flows A critical macro catalyst is the likelihood of multiple ETF approvals in the coming months. While much of the focus has been on Bitcoin and Ethereum, the structural changes triggered by ETF adoption—standardized custody, audited NAV calculations, and regulated market-making—create spillover effects across large-cap crypto assets. Here’s why ETF approvals matter to Solana: •Legitimacy funnel: When institutions obtain board approvals for crypto exposure via ETFs, internal compliance friction declines. From there, investment committees often explore other large-cap crypto assets with similar liquidity and adoption—enter SOL. •Portfolio construction: Multi-asset crypto strategies reweight based on momentum, liquidity, and correlations. If BTC and ETH ETF flows stabilize, allocators often diversify into high-beta assets with compelling adoption narratives—again, SOL is a prime candidate. •Derivatives market deepening: ETF market-making expands basis, options, and hedging activity. Robust hedging tools lower the barrier to building large SOL positions. Even if a Solana ETF is not immediately approved, the institutional infrastructure and behavioral changes catalyzed by BTC/ETH ETFs provide a clear path for capital to migrate into SOL through other compliant vehicles. Technical Structure: SOL Aligns for a Breakout From a technical perspective, SOL’s setup reflects several bullish elements frequently observed in assets that break into new cyclical highs: •Higher lows and a strong weekly structure: Persistent higher lows on the weekly timeframe suggest bid support from larger accounts. Breakouts from multi-month accumulation ranges often lead to trend extensions. •Volume confirmation: Rising volume on up weeks and muted sell volume on retracements indicate absorption by patient buyers. This is often a hallmark of institutional accumulation. •Moving average alignment: When the 50-day and 200-day moving averages turn up in tandem and compress beneath price, they function as dynamic support. Golden cross conditions on high timeframes historically reinforce trend persistence. •Momentum oscillators: Constructive RSI behavior (staying in bullish regimes, respecting 50-55 on pullbacks) supports the case for sustained upside. MACD crossovers above the zero line add confirmation. •Market structure breaks: If SOL clears prior supply zones with strong breadth in Solana ecosystem tokens, it often precedes a sharp expansion leg. From a pure charting lens, the path to retest the all-time high (ATH) becomes plausible once prior resistance shelves are flipped to support with convincing retests. The next leg can extend if funding stays balanced and derivatives don’t overheat. Why $300+ Is on the Table Calling specific price targets in crypto is always probabilistic, but the $300+ scenario reflects a confluence of factors: •Elastic demand: As SOL regains narrative dominance, every incremental institutional participant must source supply in a relatively illiquid float, especially with high staking participation. This creates reflexivity: higher prices attract more attention and flows. •Ecosystem beta: When Solana majors rally, Solana ecosystem tokens and NFTs often follow, generating wealth effects that feedback into SOL via fees, staking, and treasury rebalancing. •On-chain revenues and usage: Fees and MEV-like revenue capture, combined with consistent L1 usage, differentiate SOL as more than a speculative token. If fee markets remain healthy without compromising UX, valuations can adjust quickly. •Capital markets maturity: Prime brokerage services, credit lines, and custodial lending for SOL increase leverage capacity for funds. Managed responsibly, this deepens liquidity and smooths volatility while supporting upside. • Institutional Signaling and Order Flow Dynamics Institutions leave footprints: •Options skew: A shift toward call dominance and tightening call spreads near key strikes suggests demand for upside exposure. Calendar spreads can hint at timing expectations around catalysts like ETF decisions or protocol upgrades. •Basis behavior: Persistent positive basis with manageable funding indicates steady demand for levered long exposure without frothy excess. Sharp basis expansions often precede blow-off tops, but controlled elevations are constructive. •Block trade prints: Larger fills on the offer with minimal price impact imply sophisticated execution algorithms are absorbing liquidity. VWAP-style participation in uptrends is a hallmark of fund flows. • Solana Fundamentals: Not Just Hype The bullish case is reinforced by fundamentals: •Throughput and reliability improvements: Ongoing client and scheduler upgrades have meaningfully reduced congestion and improved consistency, aligning the chain for mainstream-scale apps. •Developer ecosystem: Grants, hackathons, and venture inflows are driving an uptick in deployment across DeFi, DePIN, payments, and consumer social. More apps mean more transactions, fees, and network effects. •Staking and validator health: A broad validator set with improving decentralization metrics, plus liquid staking growth, provides both security and capital efficiency. Mature slashing protections and monitoring infrastructure reduce operational risk. •Cross-ecosystem bridges and RWAs: Safer bridging architectures and the growth of tokenized real-world assets on Solana expand the total addressable market and institutional relevance. The UAE Vector: Why Location Matters The decision to anchor a Solana treasury in the UAE amplifies several advantages: •Regulatory clarity: Entities can obtain approvals and operate with predictable oversight, facilitating custody, staking, and DeFi participation at institutional scale. •Geographic diversification: Reduces dependence on US and EU regulatory cycles, creating a global liquidity map that supports 24/7 markets. •Access to sovereign and family office capital: The region’s investor base is comfortable with alternative assets, infrastructure, and frontier technologies, making Solana’s high-throughput narrative particularly compelling. •Talent and infrastructure: The UAE’s growing fintech and crypto workforce supports operational resilience for treasury and market activities. Risk Factors and What Could Go Wrong No thesis is complete without acknowledging risk: •Regulatory shifts: Unexpected adverse rulings in key jurisdictions, or delays/denials around ETFs, could dampen flows and sentiment. •Network incidents: Performance degradation or security issues would hurt adoption narratives and compress multiples. •Liquidity shocks: If derivatives positioning becomes crowded, a deleveraging event could trigger cascading liquidations. Watch funding, OI, and CVI-like measures. •Macro correlation: A sharp risk-off in global markets—driven by rates, growth scares, or geopolitical events—can compress crypto valuations, including SOL, even amid strong fundamentals. •Competitive pressure: Advances from competing L1s or L2s, especially around modular architectures and data availability, could siphon developer and liquidity attention. Signals to Track in the Coming Months For investors and observers, keep an eye on: •ETF decision timelines: Not just for SOL, but for broader crypto products. Watch S-1 updates, surveillance-sharing agreements, and authorized participant rosters. •On-chain metrics: Daily active addresses, fee revenue, transaction success rates, and validator participation. Sustained growth here supports the fundamental re-rating. •Derivatives health: Funding rates, options IV, skew, and term structure. Healthy markets allow trends to persist without disorderly squeezes. •Treasury disclosures: Any public filings, attestations, or wallet monitoring from Solmate and similar entities. Evidence of steady accumulation bolsters the thesis. •Ecosystem catalysts: Major app launches, RWA integrations, payments partnerships, and mobile distribution wins (e.g., Saga ecosystem) that translate to real usage. Strategy Considerations for Different Participants •Long-only funds: Dollar-cost averaging with disciplined rebalancing can mitigate timing risk. Consider partial hedges around known catalysts to manage drawdowns. •Crypto-native funds: Use options to express directional views while capping tail risk. Calendar call spreads around ETF windows or ecosystem launches can be capital-efficient. •Corporates and treasuries: For those inspired by Solmate’s model, start with staking policies, custody/vendor selection, and risk dashboards. Establish governance before deploying into DeFi strategies. •Retail participants: Avoid over-leverage. Respect invalidation levels and maintain a cash buffer. Focus on time in market rather than perfect entries. • Why This Cycle Is Different for Solana Cycles rhyme, but specific drivers evolve. For SOL, three differentiators stand out: •Real usage at scale: Consumer-grade apps processing real volumes, with fee revenues that matter. •Institutional-grade infrastructure: Custody, staking-as-a-service, credit lines, and compliance tooling that make large allocations feasible. •Global capital alignment: The UAE initiative symbolizes a broader dispersion of crypto capital formation—less dependent on any single regulator or geography. The Road to ATH and Beyond Reclaiming all-time highs requires both narrative strength and structural support. Solana’s current setup has: •Narrative: High-throughput chain powering next-gen consumer and financial apps, now validated by serious capital allocators. •Structure: Disciplined treasury formation, institutional flows, deepening derivatives, and growing on-chain revenues. A move to fresh ATHs could unfold in stages: 1.Clearance of major resistance with rising spot volume 2.Healthy consolidation with elevated but not extreme funding 3.Fresh leg higher fueled by ecosystem beta and positive macro catalysts (ETF approvals, corporate adoption) 4.Volatility expansion near psychological round numbers, followed by a volatility contraction if treasuries and market makers absorb flows If these stages play out with controlled leverage and robust spot participation, the path toward $300+ becomes more than aspirational—it becomes a function of order flow and narrative reflexivity. Bottom Line •Solmate’s $300 million launch to build a Solana treasury in the UAE is a landmark institutional milestone that could catalyze regional and global capital into SOL and its ecosystem. •Institutional players like Forward Industries are signaling a pronounced shift toward Solana, reinforcing a buying frenzy dynamic supported by liquidity and execution improvements. •The likely approval of multiple crypto ETFs later this year is a macro tailwind that indirectly benefits SOL, even before any Solana-specific ETF comes to market. •Technicals align with fundamentals: higher lows, constructive volume, favorable moving averages, and bullish momentum patterns support the case for an ATH retest and potential breakout toward $300+. •Risks remain—regulatory, network, liquidity—but the balance of probabilities currently favors continued upside as on-chain usage, institutional infrastructure, and global capital alignment strengthen. As always, this is not financial advice. Markets are volatile, and conditions can change quickly. But with treasury formation ramping, institutional flows accelerating, and technicals confirming, Solana’s next chapter is setting up to be its most consequential yet. If the current trajectory holds—anchored by the UAE treasury initiative and sustained by institutional adoption—SOL’s bid for new all-time highs and beyond looks not just plausible, but increasingly likely.
bryandowningqln
Bitcoin Price Prediction: Will BTC Hit $119K Next?

Bitcoin Price Prediction: Will BTC Hit $119K Next? Bitcoin’s journey has been nothing less than a roller coaster, marked by dramatic rises and sharp falls. As of late, the cryptocurrency has seen fluctuations influenced heavily by broader economic signals, particularly the policy decisions from the United States Federal Reserve. The latest buzz in the crypto community revolves around whether Bitcoin can breach a new milestone of $119,000. This speculation is fueled by recent shifts in the market and macroeconomic policies that could either propel or hinder this ascent. Current Market Overview Key Resistance and the $118K Threshold Bitcoin currently faces a significant resistance level at $118,000. This figure is not just a random high point; it represents a critical psychological and technical barrier. A break above this level could signal a strong bullish momentum, potentially setting the stage for reaching new heights. The resistance has formed due to various factors including profit-taking, historical resistance levels, and speculative trading behaviors. The Role of the US Federal Reserve The Federal Reserve's policies, particularly interest rate cuts, have a profound impact on investment in risk assets like cryptocurrencies. Lower interest rates generally decrease the yield on safer investments like bonds, making higher-risk investments more attractive. The anticipation around the Fed's decisions can lead to increased volatility in the Bitcoin market. Liquidity and Market Sentiment The liquidity in the Bitcoin market, evidenced by the influx of both buy and sell orders, plays a crucial role in its price movements. High liquidity leads to less price manipulation and more stability, whereas low liquidity can lead to higher volatility. Currently, the market is witnessing substantial liquidity, indicating active participation from both retail and institutional investors. Factors Influencing Bitcoin's Price Trajectory Institutional Adoption One of the primary drivers behind Bitcoin’s potential rise to $119K is the increasing adoption by institutional investors. As more firms enter the market, their substantial buying power can significantly push the price upwards. This adoption also adds legitimacy to Bitcoin, encouraging more cautious investors to dip their toes in the crypto waters. Technological Advances Improvements in blockchain technology and the introduction of new features can also influence Bitcoin's price. For instance, enhancements in scalability and security can make Bitcoin more attractive to both investors and users. Regulatory Environment Regulations play a pivotal role in shaping the cryptocurrency landscape. Positive regulatory developments, or lack of negative ones, could boost investor confidence and push the price of Bitcoin higher. Economic Indicators and Market Sentiments Inflation and the Dollar Index Inflation levels and the strength of the dollar also influence Bitcoin’s value. Typically, Bitcoin has been seen as a hedge against inflation. A weaker dollar often makes Bitcoin more attractive to international buyers, potentially pushing its price up. Sentiment Analysis Market sentiment, driven by news and social media, significantly impacts Bitcoin’s price. Positive news can lead to fear of missing out (FOMO), driving the price up, while negative news can trigger panic selling. Technical Analysis and Future Predictions Chart Patterns and Indicators From a technical standpoint, Bitcoin has shown resilience by bouncing back from several corrections. The formation of a bullish flag pattern, combined with strong support levels being tested and held, suggests upward momentum. Predictive Models Various predictive models based on historical price data, market cycles, and external economic factors suggest a bullish outlook for Bitcoin. These models often incorporate elements like stock-to-flow ratios which have been historically accurate in predicting Bitcoin’s long-term price movements. Expert Opinions Many industry experts and analysts have weighed in on Bitcoin’s potential to hit $119K. While opinions vary, the prevailing sentiment is cautiously optimistic, contingent on market conditions and macroeconomic factors remaining favorable. Conclusion The question of whether Bitcoin will reach $119K is complex and laden with variables. Key factors include Federal Reserve policies, market liquidity, institutional investment, and broader economic indicators. While the short-term journey may be volatile, the long-term outlook for Bitcoin remains bullish, with many paths potentially leading to new all-time highs. As always in the crypto world, only time will tell, but the signs are promising for those betting on Bitcoin’s success.
bryandowningqln
Bitcoin Price To Climb Higher Amid Rising Institutional Adoption

Bitcoin Price To Climb Higher Amid Rising Institutional Adoption, Yet Ethereum's Relative Value Puzzles Investors The digital asset landscape presents a fascinating dichotomy. Bitcoin, the undisputed leader, appears poised for a significant ascent, with analysts increasingly confident in a rally toward the coveted $120,000 mark. This optimism is overwhelmingly fueled by a powerful and sustained wave of institutional adoption, underscored by staggering inflows into U.S. spot Bitcoin Exchange-Traded Funds (ETFs). However, a perplexing counter-narrative is unfolding with Ethereum. Despite its own significant institutional embrace and the successful launch of its own ETFs, the ETH/BTC price ratio remains stubbornly low, signaling a relative weakness against Bitcoin that has left many investors searching for answers. Bitcoin's Bullish Momentum: The Unstoppable Force of Institutional Capital The sentiment surrounding Bitcoin is palpably bullish. After a period of consolidation, the cryptocurrency has shown remarkable resilience, holding key support levels and demonstrating renewed strength. Bitcoin is trading at elevated levels, with technical analysts and market experts setting their sights on the next major psychological barrier of $120,000. A sustained break above this level is widely expected to trigger a fresh wave of buying pressure, potentially propelling the price toward new all-time highs. A flurry of price predictions from various financial institutions and seasoned analysts paints a picture of widespread optimism. Forecasts range from conservative six-figure targets to highly bullish projections well above $200,000. These predictions are united by a common thread: the transformative impact of institutional adoption. The primary engine driving this bullish outlook is the unprecedented success of U.S. spot Bitcoin ETFs. These investment vehicles have served as a regulated and accessible bridge for institutional capital to flow into the digital asset space. Recent weekly net inflows have been measured in the billions of dollars, reversing previous outflows and signaling a renewed and voracious investor appetite. Leading funds from major asset managers have been the primary beneficiaries, consistently attracting hundreds of millions in fresh capital. This influx of institutional money represents a fundamental shift in how Bitcoin is perceived. Major institutions are actively adding exposure and incorporating Bitcoin into their long-term investment strategies. This is evidenced by the behavior of "whales"—large Bitcoin holders—who have been accumulating significant amounts, viewing price dips as buying opportunities. The growing institutional presence is also contributing to a reduction in Bitcoin's notorious volatility, making it a more attractive asset for diversified portfolios. Further bolstering the bullish case are favorable macroeconomic conditions. With expectations for lower interest rates, the appeal of risk assets like Bitcoin is on the rise. A weaker U.S. dollar and lower borrowing costs historically create a fertile environment for assets with a fixed supply to thrive. The confluence of massive ETF inflows, strategic institutional accumulation, and a supportive macroeconomic backdrop has created a powerful tailwind for Bitcoin. The Ethereum Conundrum: High Adoption, Low Ratio While Bitcoin basks in the glow of institutional validation, the story for Ethereum is more nuanced. On the surface, Ethereum is experiencing its own institutional renaissance. The approval of spot Ethereum ETFs has been met with considerable enthusiasm, attracting billions in capital and providing a regulated pathway for traditional investors to gain exposure to the world's leading smart contract platform. The inflow data for Ethereum ETFs has been impressive, at times even surpassing Bitcoin's on a monthly basis. Cumulative inflows have reached a significant figure, a clear testament to the growing recognition of Ethereum's value proposition, which extends beyond a simple store of value to encompass the vast ecosystems of decentralized finance (DeFi), non-fungible tokens (NFTs), and real-world asset (RWA) tokenization. Institutions are not just buying ETH through ETFs; they are also actively participating in the network's staking mechanism. An unprecedented surge in staking activity has seen a significant portion of ETH's circulating supply locked away to secure the network and earn yield. This "supply squeeze" is fueled by both institutional players and large individual holders, underscoring the long-term conviction in Ethereum's future. With a large percentage of the total supply staked, the available liquidity on exchanges has dwindled, a factor that would typically be expected to exert strong upward pressure on the price. Given this backdrop of robust adoption, significant ETF inflows, and a tightening supply, one would expect Ethereum to be gaining ground on Bitcoin. However, the ETH/BTC price ratio, a key metric that reflects the relative value of Ethereum to Bitcoin, tells a different story. This ratio has remained stubbornly below the 0.05 mark, a level that signals relative weakness for ETH. It currently hovers at a low level, far from its historical peak. This persistent underperformance is a source of considerable debate. A higher ratio indicates that ETH is appreciating faster than BTC. The current suppression suggests that while absolute demand for Ethereum is strong, the demand for Bitcoin is even stronger. Several factors may be contributing to this conundrum. Bitcoin's established brand and its narrative as "digital gold" give it a powerful first-mover advantage, particularly among institutional investors taking a conservative, phased approach. For many, Bitcoin is the initial and primary allocation. Secondly, Ethereum's utility introduces complexities and risks compared to Bitcoin's simpler value proposition. The ongoing evolution of the network, while bullish long-term, may present a steeper learning curve for some investors. Furthermore, a historical trend of Bitcoin outperforming Ethereum may have created market inertia, with capital continuing to flow into the asset with stronger recent relative performance. In essence, both assets are appreciating, but Bitcoin is doing so at a faster rate, keeping the ratio suppressed. Beyond the Big Two: Other Trending Cryptos to Watch While Bitcoin and Ethereum dominate, the broader cryptocurrency market is a hotbed of innovation. Investors are exploring a diverse range of projects with potential for significant growth, driven by several key trends. Layer-2 Scaling Solutions: As Ethereum faces demand-driven congestion, Layer-2 solutions have become indispensable. Projects offering faster, cheaper, and more scalable environments for decentralized applications are capturing a growing share of activity and represent a crucial investment theme for ecosystem growth. Integration of Artificial Intelligence and Blockchain: The convergence of AI and blockchain is gaining considerable traction, creating new possibilities in automated trading, decentralized organizations, and sophisticated dApps. Projects leveraging AI to enhance blockchain capabilities are attracting significant attention. Tokenization of Real-World Assets (RWA): This is poised to be one of the most transformative trends. Representing physical assets like real estate and commodities as digital tokens on a blockchain has the potential to unlock trillions in illiquid assets, making them more accessible and tradable globally. This is expected to drive a new wave of adoption. Meme Coins and Community-Driven Projects: While often speculative, meme coins continue to exert significant influence, demonstrating the power of community and viral marketing. Their enduring popularity highlights the importance of cultural relevance in the crypto space. The altcoin market is characterized by higher volatility and risk. However, for investors with a high-risk tolerance, it offers the potential for outsized returns based on technological adoption and market trends. The Road Ahead: A Market at a Crossroads The cryptocurrency market is a study in contrasts. The overwhelming force of institutional adoption is propelling Bitcoin toward potentially historic highs. The success of Bitcoin ETFs has fundamentally altered the market structure, creating a sustained demand that shows no signs of abating. Conversely, the curious case of the ETH/BTC ratio serves as a reminder of the market's complexity. While Ethereum's own institutional story is compelling, it has yet to translate into sustained outperformance against Bitcoin. Looking ahead, the market's trajectory will be shaped by key factors. Central bank monetary policy will continue to play a crucial role. The continued growth of the ETF market will be a primary indicator of institutional sentiment. And ongoing innovation in scaling, AI, and tokenization will determine the next generation of leading projects. For investors, the current environment offers both immense opportunity and significant risk. The bullish case for Bitcoin appears robust, but volatility remains. Ethereum's long-term value is undeniable, but its short-to-medium-term performance relative to Bitcoin is less certain. The altcoin market holds promise but requires careful navigation. In conclusion, the narrative of rising institutional adoption is powerfully reshaping the digital asset landscape. As Bitcoin bulls eye their next target, the broader market watches closely, navigating the crosscurrents of innovation, regulation, and macroeconomic forces that will define the future of this transformative technology.
bryandowningqln
XRP Up 4% as Fed Rate Cut Bets as Bulls Eye $3.00 Breakout

Title: XRP Climbs 4% as Fed Rate Cut Bets Hit 99% — Bulls Eye $3.00 Breakout While Institutional Flows Dictate the Range XRP extended its recent upside, gaining roughly 4% intraday as market-implied odds of a Federal Reserve rate cut surged to 99%. The move sent XRP back to the critical psychological level at $3.00, where it briefly tagged the handle before consolidating. While support has held firmly above $2.88, repeated failures near $2.99 underscore how institutional flows are increasingly dictating short-term ranges, with systematic and high-frequency participants leaning on predefined liquidity pockets. The big question now: Can bulls engineer a clean break and weekly close above $3.00 to unlock a sustained trend toward $3.30–$3.60? Below, we unpack the macro catalyst driving crypto risk appetite, the microstructure of XRP’s order flow around $3.00, the key technical levels to watch on multiple timeframes, and how sector stories—from stablecoin settlement initiatives to real-estate tokenization narratives—might reinforce or derail momentum. We also briefly revisit the regulatory overhang and expert takes on whether the Ripple lawsuit paradoxically protected crypto market structure at a fragile moment. 1.Macro Tailwind: Fed Cut Probability at 99% Reignites Risk Appetite •Policy backdrop: Markets now price a near-certainty of a 25-basis-point rate cut at the Fed’s September 17 meeting, according to interest-rate derivatives and futures-implied probabilities. In crypto, such a setup typically marginally lowers the discount rate on long-duration risk assets, boosts liquidity appetite, and narrows the opportunity cost of holding non-yielding tokens. •Liquidity impulse: Crypto has historically responded positively to dovish inflections, especially when dovish signals coincide with risk-friendly cross-asset flows—softening yields, a weaker dollar, and compression in credit spreads. While a 25 bp cut is modest in isolation, the signaling effect—especially if paired with data-dependent guidance—can keep speculative positioning skewed to the upside. •Caveat: With a 99% probability already priced, the risk of a “buy the rumor, sell the news” reaction grows. If the Fed underwhelms on forward guidance or flags stickier inflation risks, crypto could see a fast fade from local highs. That puts heavy emphasis on the path of real yields and the post-meeting press conference tone. 2.Market Microstructure: Institutions Framing the $2.88–$2.99 Range •Range mechanics: XRP has established a resilient support shelf above $2.88, with responsive buying stepping in on each probe lower. Conversely, the $2.99–$3.00 area continues to attract supply. This behavior often reflects larger players managing liquidity with tight stop-clusters and iceberg orders near round numbers. •Repeated failures near $2.99: Such failures typically indicate either (a) active distribution by larger holders who prefer to offload inventory into strength, or (b) systematic strategies (quant funds, HFT) sweeping micro-liquidity into offers and resetting the book to keep price contained until a new exogenous catalyst hits. •Order book dynamics: Thick sell walls near $3.00 can be both a magnet and a lid. The magnet effect pulls price upward during risk-on waves, while the lid effect stalls rallies unless buyers are willing to consume stacked liquidity. A clean break often requires a combination of momentum ignition (positive macro headline, cross-asset tailwind) and absorption of passive offers. 3.Technical Landscape: Higher Lows Intact, $3.00 the First Gate Intraday and hourly structure •Trend context: XRP is trading above $2.90 and the 100-hour Simple Moving Average, keeping the immediate trend biased to the upside. A bullish trend line supports price near $2.93 (Kraken spot data), with a near-term defense zone down to $2.86–$2.88. •Key intraday bullets: oXRP price is facing hurdles and struggling to clear the $3.00 resistance. oThe price is trading above $2.90 and the 100-hourly SMA. oA bullish trend line is forming with support near $2.930 on the hourly chart. oThe pair could continue to rise if it holds above the $2.860–$2.88 zone. •Alternative micro-view: In earlier sessions, price action emphasized the $2.90–$2.92 band as an initial pivot. Dip wicks into $2.86–$2.87 have been bought, aligning with the 100-hourly SMA and trend-line confluence around $2.865–$2.93. Momentum and RSI •RSI stance: Hourly RSI has remained constructive, avoiding deep oversold prints even on pullbacks. That supports the “higher lows” narrative. If RSI holds above the midline on dips while price defends the trend line, bulls retain the initiative. •Breakout momentum: A decisive hourly or 4-hour close above $3.00, followed by a successful retest holding $2.97–$2.99 as new support, would likely tilt momentum accounts long and invite fresh breakout buyers. Such a confirmatory structure reduces the probability of a false break. Higher timeframes •Daily chart context: The market is coiling beneath a psychological barrier. A daily close above $3.00 with expanding volume would project toward $3.15–$3.20 initially, then $3.30—a level that aligns with measured move projections from prior range widths. •Pattern watch: A narrowing descending triangle under $3.00 has formed over recent sessions. While descending triangles are often bearish continuations, in crypto they can also resolve upward when macro tailwinds are strong. The critical tell is whether buyers keep front-running higher lows into the apex. 4.Scenario Map: Paths Above and Below $3.00 Bullish continuation (probability improves on Fed follow-through) •Trigger: Clean 4-hour close above $3.00, ideally accompanied by rising volume and positive breadth across large-cap alts. •Upside targets: o$3.15–$3.20: First resistance band from prior supply and extension targets based on the local range height. o$3.30: Key magnet if momentum persists; confluence with measured move from the $2.88–$2.99 box. oStretch target $3.45–$3.60: Requires continuation flow, favorable macro tone, and sector risk-on. A path to $3.60 likely needs cumulative breadth improvement and rotation from BTC or ETH dominance. •Market structure tells: oFlip of $3.00 to support on retests. oShallow pullbacks that hold the 20- and 50-period MAs on 1-hour/4-hour frames. oMomentum divergence avoidance on RSI and MACD. Neutral consolidation (base-building under resistance) •Behavior: Price oscillates between $2.88 and $3.00, with volatility compressing. This can be constructive if it resolves higher. Watch for absorption at $2.92–$2.95: sustained bid depth indicates smart-money accumulation. •Risks: Choppy stop-runs against both sides. Patience and disciplined entries near range extremes become important. Bearish fade (news or liquidity shock) •Triggers: Disappointing Fed guidance, risk-off in equities, or an adverse regulatory headline. •Downside levels: o$2.88: First defense. A clean break opens $2.86–$2.85 (trend-line and 100-hourly SMA cluster). o$2.82–$2.80: Next liquidity shelf; loss of this area would weaken the intermediate uptrend. o$2.72–$2.75: High-volume node from prior consolidation, potential swing-long reload zone if broader trend remains constructive. 5.Order Flow and Liquidity: What to Watch Around $3.00 •Liquidity pockets: Expect resting offers at $2.99–$3.02 and stop clusters just beyond. A burst through $3.02–$3.05 often reflects stop-fuel rather than sustained demand. The follow-through test is whether bid support appears on the first retest. •VWAP and session profiles: Monitor intraday VWAP alignment. If price holds above session VWAP after the breakout, it signals strong participation; repeated reversion below VWAP suggests weaker conviction. •Funding and perp basis: Elevated long funding rates without spot confirmation can forewarn of squeezes. A healthy breakout typically shows rising spot volumes and moderate-perp leverage. 6.Cross-Asset Check: Is Crypto-Wide Breadth Confirming? •BTC and ETH: If Bitcoin holds or advances alongside XRP, breakouts tend to stick better. Conversely, a BTC pullback from resistance or ETH weakness can sap liquidity from alts and render XRP breakouts vulnerable. •Dollar and yields: A softer DXY and benign real-yield backdrop would reinforce crypto appetite. Watch the 10-year real yield. A re-acceleration higher could cap upside in risk assets. •Equities and credit: Positive equity momentum and stable credit spreads are supportive. Risk-off rotations often tighten crypto ranges or trigger downside wicks. 7.Narrative Catalysts: From RLUSD Payments to Real-Estate Tokenization •RLUSD payments angle: Reports of an electric car maker tapping RLUSD for payments has refocused attention on enterprise-grade settlement rails and Ripple-adjacent stablecoin strategies. If RLUSD or similar fiat-linked tokens embed more deeply into commercial workflows, network effects could lift transactional relevance for XRP and related liquidity pools. Watch for on-chain settlement volumes and treasury adoption headlines. •Real estate tokenization: The idea that real estate could unlock the next parabolic leg for XRP hinges on two levers: (a) tokenized asset issuance/settlement requiring high-throughput, low-cost rails; (b) institutional-grade custody and compliance frameworks. If pilot programs scale—fractionalized property claims, escrow automation, and cross-border closings—liquidity migration to chains and bridges that interoperate with Ripple ecosystem tools could grow. Concrete KPIs to track include tokenized asset market cap growth, settlement finality times, and custodial integrations with major brokers. •Payments and remittances: Continued traction in corridors—especially where FX frictions are high—can underpin a fundamental bid for liquidity tokens. Macro volatility tends to increase remittance volumes, indirectly supportive for settlement networks if fees and speed remain competitive. 8.Regulatory Overhang: Did the Ripple Case “Save Crypto” or Just Buy Time? •Expert discourse: Some analysts argue that the Ripple lawsuit, by forcing clarity on the application of securities laws to token distributions and secondary market activity, reduced systemic legal uncertainty at a critical juncture. The view is that the case delineated boundaries that prevented broader enforcement spillover into secondary liquidity for many assets. •Counterpoint: Others caution that the landscape remains fragmented. Jurisdictional differences and evolving interpretations keep headline risk alive. Markets may have priced in a partial détente, but precedent is not monolithic, and appeals or parallel actions can re-introduce volatility. •Trading implication: Regulatory catalysts tend to be binary and gap-inducing. Position sizing around major court dates and policy announcements should reflect that asymmetry. 9.Strategy Playbook: Traders’ Checklist Into and After the Fed For breakout traders •Entry logic: Wait for a 4-hour close above $3.00, then look for a retest of $2.97–$2.99 holding as support. Confirmation improves if the retest coincides with an intraday VWAP reclaim and rising spot volume. •Risk: Place invalidation below the retest low or below $2.93 (trend-line confluence), depending on risk tolerance. Avoid chasing if funding spikes and spot-volume confirmation is lacking. •Targets: Scale at $3.15–$3.20; trail remainder toward $3.30. Only pursue $3.45–$3.60 if momentum and breadth broaden. For range traders •Buy-response zones: $2.86–$2.88 with tight stops if trend line and 100-hour SMA remain supportive. •Sell-response zones: $2.99–$3.00 if order flow shows absorption and lack of follow-through; cover quickly on decisive breaks. •Tools: Footprint charts, delta, and cumulative volume profiles to gauge absorption vs. initiative buying. For swing traders •Thesis: As long as daily closes hold above $2.82–$2.85, the medium-term bias remains constructive. A weekly close above $3.00 turns the path of least resistance up toward $3.30–$3.60 over coming weeks, contingent on macro tone. •Invalidations: A daily close below $2.80 suggests a breakdown from the base, opening risk to $2.72–$2.75. 10.Risk Management: Practical Guardrails •Volatility budgeting: Size positions based on realized volatility. Consider scaling rather than all-in entries around binary macro events. •Correlation traps: Avoid over-concentration in alts that move in lockstep. If you’re long XRP into the Fed, offset with cash or lower-beta exposures. •Leverage discipline: Elevated funding and crowded longs can unwind fast. Keep leverage modest and stops hard, especially near psychological levels like $3.00. •News reaction function: Predefine responses to three scenarios—dovish surprise, baseline cut with cautious guidance, or hawkish tilt. Adjust exposure automatically rather than emotionally. 11.What the Tape Is Saying Now •Price behavior: XRP has surged through $2.88, probed $2.92, and repeatedly tested $2.99–$3.00. Each dip toward $2.86–$2.90 has found buyers, aligning with the 100-hourly SMA and ascending trend line near $2.93. •Participation: The best breakouts in XRP historically come on broad-based alt strength and rising spot participation. Watch whether volumes cluster on green candles during NY hours; institutional involvement often intensifies then. •Sentiment skew: Elevated expectations around the Fed cut can create asymmetry—good news may be “priced in,” while any disappointment can trigger fast downside to first supports. 12.Price Levels Summary •Immediate resistance: $3.00, then $3.02–$3.05. A strong break above targets $3.15–$3.20 and $3.30. •Immediate support: $2.93 trend-line, then $2.90, with a stronger shelf at $2.86–$2.88. Below that, $2.82–$2.85 and $2.72–$2.75. •Momentum markers: RSI holding above midline on pullbacks; MACD on 1-hour/4-hour staying positive; rising OBV on rallies. 13.Frequently Asked Questions Q: Why does $3.00 matter so much? A: It’s a psychological round number clustered with offers, stop orders, and optionality hedging. Breaking and holding above it often forces systematic strategies to rebalance, creating momentum. Q: How reliable is the Fed cut catalyst for crypto? A: Cuts tend to support risk assets if they signal easier financial conditions ahead. However, when odds are near 100%, the market demands supportive guidance to avoid a fade. It’s the path of policy, not the single step, that matters. Q: Could XRP reach $3.60 on this leg? A: It’s possible if $3.00 flips to support, $3.15–$3.30 clears with volume, and macro remains benign. Realistically, $3.15–$3.30 is the first major test; $3.45–$3.60 would likely need follow-through and broader alt strength. Q: How do institutional flows “dictate” the range? A: Large players anchor liquidity at key levels, providing both buy-side and sell-side depth. They often fade extremes unless a meaningful catalyst forces them to move, resulting in repeated tests and rejections around known levels. Q: Is the descending triangle bearish? A: By textbook definition, yes. But crypto often violates textbook patterns when macro liquidity turns supportive. The resolution depends on who runs out of patience first—sellers defending the ceiling or buyers stepping up on higher lows. 14.Bottom Line •The setup: XRP is coiled just beneath $3.00 after a 4–5% push, with $2.88–$2.93 acting as a dependable springboard. The hourly trend remains constructive above the 100-hour SMA, and RSI supports further upside if pullbacks stay shallow. •The catalyst: A near-certain Fed cut anchors the macro bid, but with odds already near 99%, sustained upside likely requires reassuring forward guidance or a concurrent broad-based crypto risk-on. •The trigger: A decisive close and hold above $3.00 is the primary unlock. If achieved, $3.15–$3.20 and then $3.30 come into view, with $3.45–$3.60 reserved for stronger momentum phases. •The risk: Failure to clear $3.00 followed by a loss of $2.86–$2.88 would hand control back to sellers and invite a deeper test toward $2.80–$2.75. As XRP consolidates under $3.00 and the descending triangle narrows, the next directional move will likely hinge on whether institutional sellers maintain the lid or capitulate to momentum post-Fed. Traders should remain flexible, respect key levels, and let the tape confirm the path.
bryandowningqln
Solana's Price Coils in Rare Bullish Formation
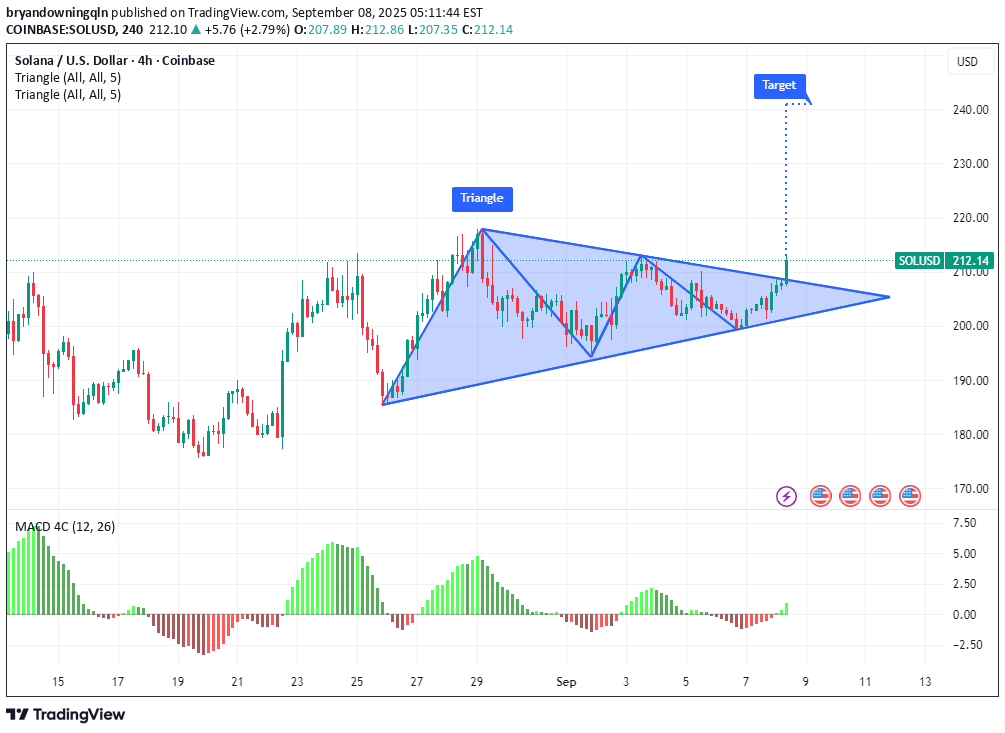
Solana's Price Coils in Rare Bullish Formation, Hinting at a Potential Rally to $230 Solana (SOL) has captured the attention of the cryptocurrency market, with its price charting a course that suggests a significant upward movement may be on the horizon. After a robust gain over the past month and a powerful rebound from its recent lows, the high-performance blockchain's native token is trading within a classic technical pattern known as a symmetrical triangle. A decisive breakout from this formation could propel SOL towards a price target of $230 in the coming days, a move supported by strengthening on-chain metrics, resurgent NFT market activity, and bullish sentiment in the derivatives market. The digital asset has shown considerable strength, rallying to intraday highs well above the $200 mark before stabilizing. This price point not only marks a significant recovery but also positions SOL tantalizingly close to the upper boundary of its consolidation pattern. This technical setup, combined with strong fundamental tailwinds, is creating a compelling narrative for a potential bullish continuation. The Anatomy of a Bullish Setup: The Symmetrical Triangle At the heart of the current bullish thesis for Solana is the formation of a symmetrical triangle on its price chart, a pattern that has been developing over recent weeks. In technical analysis, a symmetrical triangle is characterized by two converging trendlines—one descending line connecting a series of lower highs and one ascending line connecting a series of higher lows. This pattern visually represents a period of consolidation and indecision in the market, where the trading range tightens and volatility contracts. It signifies a temporary equilibrium between buyers and sellers, often preceding a significant price move or "breakout." While a symmetrical triangle is technically a continuation pattern—suggesting the price will likely resume the trend it was in prior to the triangle's formation—it can break in either direction. However, for Solana, which has been in a broader uptrend, a breakout to the upside is the more anticipated outcome. Analysts are closely watching for a decisive close above the triangle's upper trendline, ideally accompanied by a spike in trading volume, which would serve as confirmation of the breakout. Multiple analyses converge on a significant price target should this breakout occur. The height of the triangle at its widest point, projected upward from the breakout point, suggests a potential rally that could take SOL to the $230 mark. Other technical strategists have identified targets in a similar range, with some pointing to the $230-$235 area and others looking at a near-term pivot range that could open the path toward higher targets. Strengthening this possibility are key momentum indicators. The Moving Average Convergence Divergence (MACD), a popular trend-following indicator, has shown its primary line crossing above its signal line, a classic sign of a strengthening uptrend and building bullish momentum. The Road to Recovery: A Powerful Rebound Ignites Momentum Solana's current consolidation does not exist in a vacuum. It follows a period of impressive recovery that has renewed investor confidence. After dipping to a notable low in the preceding month, SOL has mounted a formidable comeback of over 30%. This rebound demonstrates strong buying pressure at lower price levels and has established a solid foundation for the current market structure. Over the past month alone, SOL has registered a double-digit percentage increase in value, a period during which the symmetrical triangle began to take shape. This price action suggests that the recent consolidation is a healthy pause, allowing the market to digest recent gains before a potential next leg up. The series of higher lows established since late August is particularly constructive, indicating that buyers remain active and are stepping in to defend key support levels. The cryptocurrency is currently consolidating above a critical support level in the high $190s. This price zone is considered highly significant by on-chain analysts, as a massive volume of tokens has historically been traded at this level, creating a strong foundation of support that bulls are actively defending. Beyond the Charts: Fundamental Tailwinds Gathering Strength While the technical picture is compelling, a confluence of fundamental factors is adding significant weight to the bullish case for Solana. The NFT Ecosystem Reawakens A notable catalyst has been a sharp resurgence in activity within Solana's non-fungible token (NFT) ecosystem. In a recent notable 24-hour window, sales volume for Solana-based NFTs experienced a dramatic spike, more than doubling from the previous day's figures and reaching well into the millions of dollars. This surge propelled Solana to become the second-largest NFT market globally by daily sales volume, trailing only Ethereum. This spike was largely driven by the explosive popularity of certain new collections, which saw their daily sales volumes skyrocket by orders of magnitude. Other collections also posted significant gains. While the broader NFT market has seen fluctuations, Solana's performance showcases a notable relative strength and a growing appeal for its high-speed, low-cost architecture among NFT creators and collectors. This renewed retail and speculative interest in Solana's NFT scene could be a powerful driver of market momentum. Bullish Bets in the Derivatives Market Sentiment among professional traders, especially in the derivatives market, has shifted decisively toward a bullish outlook. Open interest in SOL futures, which represents the total value of all outstanding futures contracts, has seen a substantial increase over the past month, climbing by several billion dollars. This indicates a high degree of speculative interest and suggests a growing number of traders are positioning for a future price increase. Furthermore, SOL's weighted funding rate has remained consistently positive for an extended period. The funding rate is a mechanism used by perpetual futures exchanges to keep the contract price in line with the spot price. A positive funding rate indicates that traders holding long positions are paying a premium to those holding short positions, a clear sign that the prevailing sentiment is bullish and traders expect the price to continue rising. The Institutional Stamp of Approval A steady drumbeat of institutional adoption continues to provide a strong fundamental floor for Solana's valuation. The launch and subsequent inflows into Solana-focused Exchange-Traded Funds (ETFs) in North America have signaled growing confidence from traditional finance. These products have seen millions of dollars in inflows on strong trading days. This trend extends to corporate treasuries. The listing of Solana-focused companies on major stock exchanges, holding significant amounts of SOL tokens, brings considerable Wall Street exposure to the asset. This institutional demand, coupled with whale accumulation, where large holders have been observed adding to their positions, provides a powerful source of buying pressure. The Alpenglow Upgrade Adding to the long-term bullish case is the anticipated Alpenglow network upgrade. Approved by an overwhelming majority of validators, this upgrade is set to slash transaction finality times significantly, bringing them down to a fraction of a second. This enhancement would provide Solana with Web2-level settlement speeds, dramatically increasing its competitiveness in high-frequency applications like decentralized finance (DeFi) and gaming, and potentially driving a new wave of developer and user adoption. Navigating the Hurdles: Resistance and Risks on the Horizon Despite the overwhelmingly bullish confluence of factors, investors should remain aware of the potential risks and key resistance levels that lie ahead. The symmetrical triangle, until a breakout is confirmed, remains a pattern of indecision. A break below the lower support trendline could invalidate the bullish thesis and trigger a move to the downside, with potential targets at lower support levels. Even with an upward breakout, the path to $230 is not without obstacles. Solana faces immediate resistance in the zone just above its current trading range, an area that has been tested multiple times. A more significant band of resistance is anticipated in the range between $210 and $250, where sellers may look to take profits. Furthermore, some on-chain metrics suggest that while momentum is building, some long-term holders may be taking the opportunity to distribute their holdings, which could create selling pressure. The broader cryptocurrency market remains subject to volatility, and a downturn in major assets like Bitcoin or Ethereum could negatively impact altcoins like Solana, regardless of their individual technical and fundamental strength. Conclusion Solana currently presents one of the most compelling risk-reward setups in the cryptocurrency market. The formation of a rare symmetrical triangle on its price chart, following a powerful rebound, has laid the technical groundwork for a potential rally toward $230. This bullish structure is not merely a product of chart patterns; it is underpinned by a potent combination of fundamental drivers. A re-energized NFT ecosystem, overwhelmingly positive sentiment in the derivatives market, growing institutional adoption, and a landmark network upgrade on the horizon all contribute to a powerful narrative of growth and expansion. While traders and investors must remain vigilant of key resistance levels and the inherent risks of the crypto market, the evidence suggests that Solana is coiling for a potentially explosive move. A confirmed breakout in the coming days could validate the bullish setup and send SOL on the next major leg of its upward journey, solidifying its position as a leading blockchain platform for the future of decentralized applications.
bryandowningqln
Gold Price At Record High: Will The Yellow Metal Hit New Highs?
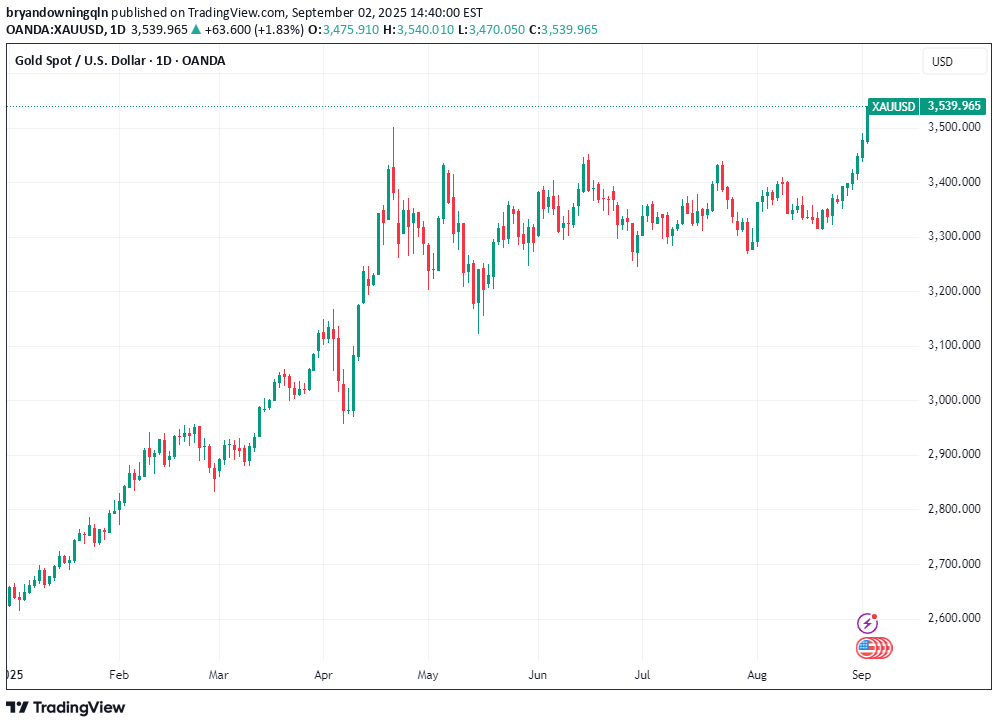
The precious metals market is experiencing unprecedented excitement as gold prices soar to fresh record highs, captivating investors and analysts worldwide. With escalating trade tensions and a weakening dollar serving as primary catalysts, the yellow metal has demonstrated remarkable resilience and strength, prompting widespread speculation about whether this bullish momentum can sustain itself into the future. The Current Gold Rush: Understanding the Record-Breaking Performance Gold's recent surge to new all-time highs represents more than just a temporary market fluctuation; it signals a fundamental shift in global economic sentiment. The precious metal, long considered a safe-haven asset during times of uncertainty, has once again proven its worth as investors seek refuge from mounting geopolitical tensions and currency devaluation concerns. The current rally builds upon decades of gold's historical performance as a store of value, but the velocity and magnitude of recent gains have surprised even seasoned market veterans. Trading volumes have reached extraordinary levels as both institutional and retail investors scramble to secure positions in what many perceive as an increasingly valuable hedge against economic instability. Market dynamics have shifted dramatically as traditional investment paradigms face unprecedented challenges. The convergence of multiple economic factors has created what analysts describe as a "perfect storm" for gold appreciation, with technical indicators suggesting that the current momentum may have significant staying power. Trade Tensions: The Geopolitical Engine Behind Gold's Ascent Escalating trade tensions between major global economies have emerged as one of the most significant drivers of gold's recent performance. As diplomatic relationships strain and tariff wars intensify, investors are increasingly turning to gold as protection against the economic fallout from deteriorating international trade relationships. The ripple effects of trade disputes extend far beyond immediate market reactions, creating long-term uncertainty that fundamentally alters investment strategies. Supply chain disruptions, shifting manufacturing bases, and retaliatory measures between trading partners have introduced volatility into traditional asset classes, making gold's stability increasingly attractive. Historical precedent supports the correlation between trade tensions and gold appreciation. During previous periods of international economic conflict, gold has consistently outperformed other asset classes, serving as a reliable indicator of market stress. The current environment mirrors many characteristics of past trade disputes, but the scale and scope of contemporary tensions suggest potentially more sustained pressure on global markets. Corporate earnings have begun reflecting the impact of trade uncertainties, with many multinational companies reporting decreased profitability due to increased operational costs and market access restrictions. This corporate stress translates directly into equity market volatility, further reinforcing gold's appeal as a portfolio diversification tool. Dollar Weakness: Currency Dynamics Fueling Gold's Rise The weakening dollar has provided substantial tailwinds for gold's recent rally, as the inverse relationship between the world's primary reserve currency and precious metals continues to hold true. Dollar depreciation makes gold more affordable for international buyers while simultaneously reducing the opportunity cost of holding non-yielding assets. Federal Reserve monetary policy decisions have played a crucial role in dollar weakness, with accommodative policies designed to support economic growth having unintended consequences for currency strength. Lower interest rates reduce the attractiveness of dollar-denominated investments, prompting capital flows toward alternative stores of value like gold. International central banks have been notable participants in this shift, with many diversifying their foreign exchange reserves away from dollars and toward gold. This institutional buying provides a substantial floor for gold prices while signaling long-term confidence in the metal's value proposition. Currency market volatility has reached levels not seen since major financial crises, creating an environment where traditional hedging strategies prove inadequate. Gold's role as a currency hedge becomes particularly valuable during periods of extreme volatility, as it maintains purchasing power across different monetary systems. Expert Analysis: Professional Perspectives on Gold's Future Leading precious metals analysts remain cautiously optimistic about gold's prospects, though opinions vary regarding the sustainability of current price levels. Many experts point to fundamental supply and demand imbalances that could support higher prices over the medium to long term. Mining industry challenges have contributed to supply constraints that may persist for years. New gold discoveries have declined significantly, while existing mines face increasing production costs due to deeper extraction requirements and stricter environmental regulations. These supply-side factors create a foundation for price appreciation independent of demand fluctuations. Investment demand patterns have evolved substantially, with younger demographics showing increased interest in gold exposure through exchange-traded funds and digital platforms. This demographic shift suggests potential for sustained demand growth as these investors mature and accumulate wealth. Technical analysis reveals strong chart patterns that many experts interpret as indicative of continued upward momentum. Key resistance levels have been decisively broken, and momentum indicators suggest that the current rally may have significant room to run before encountering meaningful technical obstacles. Market Structure and Institutional Participation The composition of gold market participants has undergone significant transformation in recent years, with institutional investors playing an increasingly prominent role. Pension funds, endowments, and sovereign wealth funds have allocated substantial resources to gold exposure, providing stability and reducing volatility compared to retail-dominated markets. Derivatives markets have expanded dramatically, offering sophisticated investors numerous ways to gain gold exposure while managing risk. Options activity has reached record levels, with both speculative and hedging strategies contributing to increased market depth and liquidity. Exchange-traded funds focused on gold have experienced massive inflows, representing one of the most accessible ways for investors to participate in gold's appreciation. These vehicles have democratized gold investment while providing transparency and liquidity that traditional physical ownership cannot match. Central bank policies beyond the United States have also influenced gold markets, with European and Asian monetary authorities implementing strategies that indirectly support precious metals prices. Coordinated global monetary expansion has created conditions favorable to hard asset appreciation. Economic Fundamentals Supporting Gold Inflation expectations have begun rising in many developed economies, creating conditions historically favorable to gold appreciation. While inflation rates remain relatively subdued, forward-looking indicators suggest potential for significant price pressures in coming years. Debt levels across both public and private sectors have reached unprecedented heights, raising questions about long-term fiscal sustainability. Gold serves as a hedge against potential debt crises and currency devaluations that could result from unsustainable borrowing practices. Real interest rates, calculated as nominal rates minus inflation expectations, have turned negative in many jurisdictions. This environment reduces the opportunity cost of holding gold while making yield-bearing alternatives less attractive on an inflation-adjusted basis. Global economic growth concerns have intensified, with many indicators suggesting potential recession risks. Historical data demonstrates gold's tendency to outperform during economic downturns, making current positioning particularly attractive for risk-averse investors. Risks and Challenges Facing Gold's Bull Run Despite strong fundamentals supporting higher gold prices, several factors could potentially derail the current rally. Sudden improvements in trade relationships could reduce safe-haven demand, while unexpected dollar strength might pressure gold prices lower. Cryptocurrency adoption continues expanding, with some investors viewing digital assets as modern alternatives to traditional safe havens like gold. This technological disruption could potentially reduce gold's relevance for younger investors seeking portfolio diversification. Central bank policy reversals remain a constant threat to gold's momentum. Should major monetary authorities shift toward more hawkish policies, resulting interest rate increases could make yield-bearing assets more attractive relative to gold. Market positioning has become increasingly crowded, with speculative positions reaching levels that historically precede corrective pullbacks. While fundamentals remain supportive, technical factors suggest vulnerability to profit-taking activities. Looking Ahead: Future Prospects for Gold The convergence of multiple supportive factors suggests that gold's bull market may have significant longevity, though volatility should be expected along the way. Structural changes in global monetary systems, persistent geopolitical tensions, and evolving investor preferences all point toward sustained demand for precious metals exposure. Long-term demographic trends favor gold appreciation, as emerging market wealth accumulation traditionally includes substantial precious metals allocations. Growing middle classes in Asia and other developing regions represent vast potential demand that could support higher prices for decades. Environmental and social governance considerations are beginning to influence mining operations, potentially constraining future supply growth while supporting premium pricing for responsibly sourced gold. These factors add another dimension to gold's investment thesis beyond traditional monetary considerations. The yellow metal's record-breaking performance appears to reflect genuine fundamental changes rather than speculative excess, suggesting that new highs may indeed be achievable. While short-term volatility remains inevitable, the underlying conditions supporting gold's appreciation show little sign of abating, making a compelling case for continued strength in the precious metals complex. As global economic uncertainty persists and traditional investment paradigms face mounting challenges, gold's role as a portfolio cornerstone seems likely to expand rather than diminish, potentially driving prices to levels previously thought impossible.
bryandowningqln
Ethereum Whales Scoop Up 260K ETH, Fueling $5K Recovery Hopes
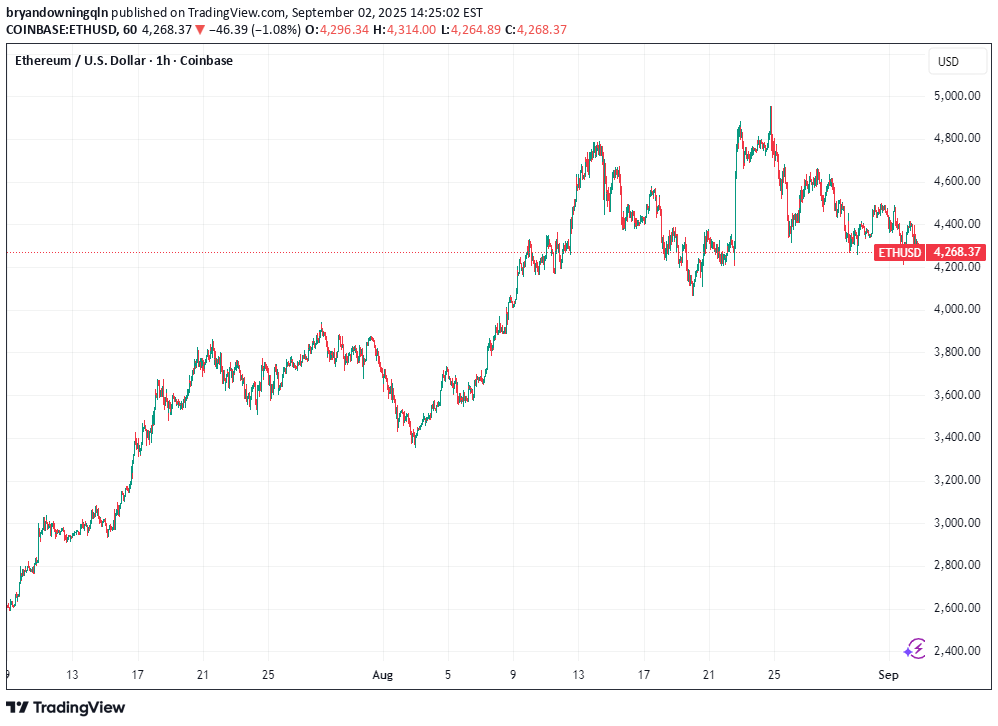
The cryptocurrency market is witnessing a significant shift as Ethereum whales accumulate massive positions, with recent data showing an unprecedented 260,000 ETH purchased in just 24 hours. This substantial whale activity is generating considerable optimism among investors and analysts, who are now eyeing a potential recovery toward the psychologically important $5,000 price level. Massive Whale Accumulation Signals Market Confidence Large-scale Ethereum holders, commonly referred to as "whales" in the cryptocurrency community, have demonstrated remarkable confidence in ETH's future prospects through their recent buying behavior. The acquisition of 260,000 ETH in a single day represents approximately $650 million worth of Ethereum at current market prices, indicating that institutional and high-net-worth investors are positioning themselves for what they perceive as an imminent price rally. This whale accumulation pattern is particularly significant given the broader market context. While many retail investors remain cautious following recent market volatility, sophisticated investors with substantial capital reserves are taking advantage of current price levels to build sizeable positions. The concentrated nature of these purchases suggests coordinated confidence among major market participants rather than isolated buying decisions. The timing of this accumulation is noteworthy as well. Ethereum has been trading in a consolidation phase following its previous rally, and whale activity often serves as a leading indicator of upcoming price movements. Historical data shows that significant whale accumulation periods frequently precede major price breakouts, lending credence to the bullish sentiment surrounding ETH's near-term prospects. Bitcoin Profit Rotation Driving Ethereum Demand A particularly interesting aspect of the current market dynamics is the apparent rotation of capital from Bitcoin into Ethereum. As Bitcoin approaches resistance levels and shows signs of consolidation, savvy investors are taking profits from their BTC positions and reallocating these funds into ETH. This rotation strategy reflects a sophisticated understanding of market cycles and the relative value proposition between the two leading cryptocurrencies. Bitcoin's recent performance has been strong, but many analysts believe that Ethereum may offer superior upside potential in the coming months. The rotation from BTC to ETH is not merely a short-term trading strategy but reflects fundamental beliefs about Ethereum's technological advantages and ecosystem growth potential. This capital rotation is providing additional buying pressure for ETH while simultaneously reducing selling pressure from profit-taking activities. The scale of this rotation is substantial enough to impact market dynamics significantly. When large holders move capital between cryptocurrencies, it often creates momentum that smaller investors follow, potentially amplifying the initial movement. This phenomenon could be contributing to the sustained buying pressure we're observing in Ethereum markets. Technical Analysis Points to $5K Target From a technical analysis perspective, the current whale accumulation is occurring at what many chartists consider optimal entry levels. Ethereum's price action has formed what appears to be a strong support base, and the addition of substantial whale buying is providing the foundation for a potential breakout to higher levels. The $5,000 price target that has emerged in analyst discussions is not arbitrary. This level represents a significant technical milestone that would place Ethereum at new all-time highs, surpassing its previous peak reached during the 2021 bull market. Achieving this target would require approximately a 50-60% rally from current levels, which, while substantial, is not unprecedented for Ethereum during strong market phases. Several technical indicators are aligning to support this bullish thesis. The accumulation by whales is reducing the available supply on exchanges, creating conditions for price appreciation when demand increases. Additionally, on-chain metrics show declining ETH reserves on major exchanges, suggesting that holders are moving their assets to cold storage with long-term holding intentions. Fundamental Drivers Supporting Price Recovery Beyond technical factors, several fundamental developments are supporting the case for Ethereum's price recovery. The network's transition to proof-of-stake consensus has fundamentally altered ETH's economic model, introducing deflationary mechanisms that reduce supply over time. This structural change creates long-term upward pressure on prices, particularly when combined with sustained demand. The growth of decentralized finance (DeFi) continues to drive demand for ETH as the primary collateral and gas token for the Ethereum ecosystem. Recent developments, including major DeFi protocols expanding their offerings and new innovations in yield generation, are attracting both institutional and retail capital to the Ethereum network. This increased activity translates directly into increased demand for ETH. Layer 2 scaling solutions are also contributing to Ethereum's value proposition by making the network more accessible and cost-effective for users. While some initially worried that Layer 2 solutions might reduce demand for mainnet ETH, the opposite has proven true. These scaling solutions are enabling new use cases and bringing more users to the Ethereum ecosystem, ultimately increasing overall network value and ETH demand. Institutional Adoption Accelerating The whale accumulation we're observing is likely driven, at least in part, by increasing institutional adoption of Ethereum. Major corporations, investment funds, and financial institutions are recognizing Ethereum's potential as both a store of value and a platform for innovation. This institutional interest is providing a stable foundation of demand that supports higher price levels. Recent regulatory clarity in various jurisdictions has made it easier for institutions to hold and trade Ethereum. The approval of Ethereum ETFs in multiple markets has provided traditional investors with regulated exposure to ETH, broading the potential investor base significantly. This institutional infrastructure is creating new channels for capital to flow into Ethereum, supporting the whale accumulation trend. The institutional adoption story extends beyond simple investment holdings. Many institutions are building applications and services on Ethereum, creating operational demand for ETH that goes beyond speculative investment. This utility-driven demand provides a more stable foundation for price appreciation than speculation alone. Market Sentiment and Risk Factors While the whale accumulation and associated price targets are generating significant optimism, it's important to consider potential risk factors that could impact Ethereum's trajectory. Macroeconomic conditions continue to influence cryptocurrency markets, and changes in monetary policy or economic outlook could affect investor appetite for risk assets like ETH. Regulatory developments remain a key consideration for Ethereum's future. While recent regulatory clarity has been generally positive, ongoing discussions about cryptocurrency regulation in major markets could introduce volatility. However, Ethereum's established position and broad ecosystem make it less vulnerable to regulatory challenges than smaller, less established cryptocurrencies. Competition from other blockchain platforms also represents a consideration, though Ethereum's first-mover advantage and network effects provide substantial competitive moats. The ongoing development of Ethereum 2.0 and associated scaling solutions are addressing many of the performance concerns that competitors have attempted to exploit. Looking Ahead: October Catalyst Potential Many analysts are pointing to October as a potential catalyst month for Ethereum's price recovery. This timing aligns with historical patterns showing that the fourth quarter often brings increased cryptocurrency market activity. The combination of whale accumulation, institutional adoption, and seasonal patterns could create a perfect storm for price appreciation. The prediction of a potential "bear trap" in September, where prices might temporarily decline to the mid-$3,000 range before surging in October, reflects sophisticated market timing strategies. Such scenarios often catch retail traders off-guard while providing additional accumulation opportunities for sophisticated investors who understand market cycles. Conclusion The recent whale accumulation of 260,000 ETH represents a significant vote of confidence in Ethereum's future prospects. Combined with capital rotation from Bitcoin, technical breakout potential, and strong fundamental drivers, conditions appear favorable for a substantial price recovery toward the $5,000 target level. While short-term volatility remains possible, the sustained whale buying suggests that sophisticated investors are positioning for longer-term appreciation. The combination of reduced supply through staking and burning mechanisms, increased institutional adoption, and ongoing ecosystem development creates a compelling investment thesis for Ethereum. Investors should remain aware of potential risks and market volatility, but the current accumulation pattern by whales provides strong evidence that major market participants expect significant appreciation in Ethereum's value. As the cryptocurrency market continues to mature and institutional adoption accelerates, Ethereum appears well-positioned to benefit from these broader trends, potentially making the $5,000 price target achievable in the coming months. The convergence of technical, fundamental, and sentiment factors creates an unusually positive outlook for Ethereum. While past performance doesn't guarantee future results, the current whale accumulation pattern mirrors successful accumulation phases that have preceded major rallies in Ethereum's history, suggesting that similar outcomes may be possible in the current market cycle.
Disclaimer
Any content and materials included in Sahmeto's website and official communication channels are a compilation of personal opinions and analyses and are not binding. They do not constitute any recommendation for buying, selling, entering or exiting the stock market and cryptocurrency market. Also, all news and analyses included in the website and channels are merely republished information from official and unofficial domestic and foreign sources, and it is obvious that users of the said content are responsible for following up and ensuring the authenticity and accuracy of the materials. Therefore, while disclaiming responsibility, it is declared that the responsibility for any decision-making, action, and potential profit and loss in the capital market and cryptocurrency market lies with the trader.