
Tynahan
@t_Tynahan

What symbols does the trader recommend buying?
Purchase History
پیام های تریدر
Filter
Tynahan
تحلیل بیت کوین: آیا ریزش در راه است یا اوج 130 هزار دلار؟ (سطوح حیاتی)

BTC It touched the weekly trend level. The weekly formation formed here is not a good formation. It runs a weekly closing formation below $101700 on average and gives a downward trend. As long as we stay above $101700, we have bullish backtests on a weekly basis. On a daily basis, we have a descending triangle and this is the formation that triggers an upward trend on the daily. Alt The trend $96000 level corresponds to the upper breakout $109100 level. After the upper breakout occurs, the target will first be the 100-day moving average and then a return to the 125 thousand dollar level. For this condition, a daily closing must be above the absolute level of 109 thousand dollars. It should not go below 96 thousand dollars. All formations are potential. These are the values that are likely to be realized. What usually happens? Weekly formations are long-term formations and this formation, which has a weekly decrease level, is canceled at 130 thousand dollars and the potential is eliminated. So right now is the bottom point and the appropriate places to try. 101700 is a six-week close potential and a downtrend occurs. If it is above, the minimum target peak trend is 130 thousand dollars. If that level is exceeded, the formation will be disrupted. What can we check and where to buy it. The $101700 level will be followed and there may be partial buying. It may touch 96 thousand dollars daily, but if it does not close at that level weekly, it will create serious buying availability. On the upper side, if 109 thousand dollars is passed, the direction turns to a short-term increase. If this increase occurs, it is very possible for me to see an altcoin movement that attacks better than Bitcoin. According to these moments of Bitcoin, seizing the opportunity to buy altcoins may be more profitable in the next month or two. What was the rule? Bitcoin It was supposed to exceed 126 thousand dollars, but it couldn't. Now there is a target at that point at the top again, even if it cannot pass here, reaching there will give the altcoin mobility. I do not think that there will be a decrease in chaos as the costs of this digital currency, which costs over 50 thousand dollars, have increased significantly due to the halving difficulty. The problem for you is not bitcoin, it is an altcoin. Therefore, even if the continuity of bitcoin is upward, I guess there is a loss because there is no continuity of altcoins. If this is exactly the turnaround, we can definitely see new opportunities and investments for altcoins. We can understand this by observing that eth fi wages are increasing slowly. In addition, there will be a slow movement time for new projects and web3. I recommend that you do good research and good equipment to make money and take advantage of these opportunities. I wish you lots of profit. For Informational and Idea Purposes. Does not contain investment advice!
Tynahan
تحلیل جدید بیت کوین: آیا سقوط بزرگ آلتکوینها تازه شروع شده است؟

BTC His dominance was chilling.. A big drop was again only for altcoins. Bitcoin is spot on again. I mentioned a sharp drop in September bitcoin after the 21 September solar eclipse. It's weird that this happened in October and bitcoin wiped out the market before it even crashed. Normally I would predict a decline for him to relinquish dominance. He increased his dominance again. When such events always occur before, bullish and bearish theories spread into the market. In my previous post, I mentioned bear season for bitcoin after September 21st. Let me explain again what this is. Bitcoin first digit bear altcoin season watch. A start to this could lead to a sharp decline. Crises, events, liquidation, yes it is true, but we need to understand this from the fact that bitcoin fell to 102 thousand and altcoins lost 80-90 percent. Some coins will be deleted. This happens to us almost every season. Remember 2017 Putin coin, then let's remember luna. Sol was going, he held on at the last moment. I think it is a coin that should not be on the market, but it still dominates the market right now. When we look at Gibi Gibi, the Mt Gox collapse or other collapses, we get the following observation. The first one will touch bitcoin wick. In some exchanges it is 105, in others it is 103, but I will base it on 102. A return here would be a double bottom and wick confirmation. Returns from here may be a place to try depending on this anti-fall. Now let's look at some technique. The first is the ATHs peak and the other is the 2017 ATHs peak. My only sentence has always been this: It will happen again. The most critical point is the 126200 level. This is the point that gives you a breather. Again, be careful not to let it in in case of a possible increase. Now first, the 2017 crosses are around $50k and the output retested and then made its way to the next ATH highs. 126200 is currently 127. Tried this place a few times and it went downhill. Alt the trend is around $100700 and it has almost touched the trend. It may trend again and get an upward reaction. The trend break indicates a decline up to 94 thousand dollars and the direction will be down. We will observe this place. With a possible rise, bitcoin will push above the channel again, and at this level it will be 127 thousand dollars. The intermediate value is 112500 and 115 thousand dollars. I'm not talking about 107, 108, 106 etc., I'm giving the sharp turning points directly. For altcoins; First, we will determine where bitcoin returns. And when bitcoin returns, if the altcoin dominance is low, that 127 thousand level will be broken. But if it is too high, if 127 is reached again, this time there will be a sharper decline. According to Solar and Lunar eclipse analysis, bitcoin has entered the bear season. What does this mean? Bitcoin means that its dominance should decrease. Even if Ethereum and xrp increase in the same way, it means that they will increase less and we have entered the season where demand should shift to the majors. Just as there are gradual bulls, there are also gradual bears. Bitcoin It came from 17 thousand dollars to 120 thousand dollars on its own, then xrp dragged the season, then after the 29 March solar eclipse, it gave the ethereum request, then from 21 September, it is my expectation to enter the majors, then the minors and then the entire bear season. I called the decline that I mentioned on September 21 as a shift in demand to altcoins, but the demand remained in bitcoin again. I will continue to monitor, interpret and follow the return. For Informational and Idea Purposes. Does not contain investment advice!
Tynahan
طلا در برابر نقره: کدام سرمایهگذاری امنتر و سودآورتر است؟

XAU And $XAG.. Perhaps most of us were not interested in silver until 2020. It has been known as the poor man's gold for centuries. Let's talk about the future of Gold and Silver. You know that; Gold is a safe haven and a mineral that has been used for centuries and is in the reserves of countries. ''God's Money'' There has been an understanding of gold in societies for years. This makes it strong and safe. It increases no matter how much you buy it from. Why? Inflation. As the inflation of countries increases, the value of gold also increases. In fact, it only protects you from inflation. It doesn't gain you anything. In fact, a sudden increase in percentage will return to you as inflation. Because it is the largest accepted currency coin. In other words, there is a general increase in the summer season not because of weddings, but because of inflation. From time to time, sharp declines occur. So, is there demand for silver because the price of gold is increasing? Silver is exposed to industrial demand, especially after 2020. Due to its use in electric vehicles and its involvement in many industrial productions, silver has begun to be preferred and enter a different era. In addition, while new silver deposits are very rare, there are cases where there is not enough demand. Usage areas of silver; Electric vehicles, Smartphones, Electronic industry, Medical equipment, Battery, Radar, Air Conditioning, Solar power plants, etc. It is used in many areas such as. That's why it will be an important part of our day in the 5th Industrial Revolution. Technology continues with it. Gold is the only currency? Of course, it also took its place in the industry. It is used in advanced chips, especially in the space industry, but silver is the more preferred asset. The price is really cheap. Gold is ahead by one zero just because it is superior in terms of money payments and wealth. It will always remain the most guaranteed. After 2020, their demand began to split with digital gold, that is, bitcoin. However, it may not have its place in us, but it may have a different place in our children. It is necessary to see the future. Let's talk about how to make money among this competition. Gold and silver.. As you know, we are trying to make money from the BTC/Eth account from the scissors between the two giants in crypto. Actually, that rule came from here. From the Gold/Silver ratio. The silver ratio shows us the competitive area. Now I mentioned earlier that Silver will gain more momentum than gold. What happens now? The maximum difference in history has been 120. Currently the ratio is 80. We see situations where it remains balanced at 76 levels. Let's pay attention to this level. If silver comes close to closing the gap well, it increases its competition rate with gold up to level 60 on the alt side. My current upper limit is 90. So silver is still worthless compared to gold. It may gain a little more value. When it's 90, it's totally worthless. Between 70 and 75, we perceive silver as being more valuable than gold. This method will be a powerful method that will show you what you will get when purchasing your commodity. I wish you lots of profit. For Informational and Idea Purposes. Does not contain investment advice!
Tynahan
رمزگشایی از آینده بیت کوین و آلت کوینها: راز قله ۱۲۶,۲۰۰ دلاری!

BTC His belated victory is bleeding altcoins. Now let's take a detailed look. I researched it with pleasure, let's comment together. When we look at Bitcoin, let's find a classic ath points times. We receive 49 months of data. What is this? Bitcoin It peaks every 49 months. What is an exceptional situation? 47. There was a period when he made the moon. We call this the margin of error. Even though it appears -2, the margin of error is perceived as +- 2. Of course, since the data is quite small, we cannot get a statistically good result from here. When we look at it logarithmically, the level is 250 thousand dollars. When we look linearly, this level is 180 thousand dollars. Let's look at it from another angle. Bitcoin inflation is between 75/85 percent on average. And inflation always occurs ath above the previous level. So Bitcoin will drop to 69 thousand dollars! Where does it fall from, it becomes 75 percent? Around 320 thousand dollars. I explained it in detail in another post, see also. We came this far with mathematics, the data is mathematical. It's not like if this happens, that happens, if that happens, that happens. So, how long does 49 months correspond to after point 2021 ath? Into November. There may be a ath hidden waiting here. The solar eclipse of March 29th Bitcoin was going to break a record until the solar eclipse of September 21st, and it did. It is now entering gradual bear season. Don't let this statement scare you, I always underline my words that just as Altcoins are in a bullish season, altcoins are also in a bearish season. Bitcoin Can he gain a boost with a delayed victory? According to official ath mathematical calculations, this is possible if Bitcoin breaks the $126200 barrier. However, when we make the rainbow linear, if that level is not passed, these ath levels will be difficult. Fix your eyes there. Bitcoin Altcoin season occurs when it remains stable at the top Let's examine the line graphs on the Alt side. These are the graphs in order (eth,ltc,doge,xrp). Now these are major coins. When we pay attention to them, we see a movement that progresses with the btc movement. A xrp show also unfolds beforehand. xrp goes first. Just last time you can see from your posts that btc goes to xrp first then eth I have no posts for xrp on March 29th. Because it was a eth season and eth had reached its peak. Now, we will take the major coins to the stage as they continue to rise in a weaker state. Remember this order. No season? If you wait in the minor coin, it will come to you last in the season. Otherwise, it has increased by Bitcoin 8x Ethereum 5x xrp 7x ada 2.5x link 2.5x avax 2x. Minors are counting the days. The right investment makes money in the bull, but the bull does not happen when each coin flies at once, but when the demand changes place in turn. That's why I explain these concepts with emphasis again. We can see movements equivalent to Eth's Bitcoin. Eth Bitcoin balance. (I also mentioned it in the Bitcoin dominance analysis) Btc/eth ratio is bullish below 37, bearish indicator data above 15. It fell below 37 after March 29 and closed the gap compared to eth bitcoin. Now it is at eth 24 levels and I foresee a decline to 15 levels. When it reaches around 15, it leaves the throne to major coins. Then the majors start and the demand shifts to the minors. Finally, with the high profit liquidation in the market, certain products and new technologies will let you in with the pump appearance and you will have to wait for the x coin for 4 years. The season is completely this, there is no other explanation. Majors Bitcoin expect it to surpass $126200, while minors expect bitcoin to fall from its peak. Bitcoin has arrived xrp has arrived eth has arrived and this decline and stagnation may be the silence of the major altcoin movement. We can watch major activity after the October 7 full moon effect passes for +-3 days. This is research and mathematical data. I match it with many analyzes and present it to you. I wish you good luck For Informational and Idea Purposes. Does not contain investment advice!!
Tynahan
تحلیل لحظهای بیت کوین: مسیر صعودی پس از خورشید گرفتگی و پیشبینی تا ۷ اکتبر!

BTC You know that; We mentioned that we will continue with the rise after the fall of the solar eclipse. Now he's doing the same. There are 2 events expected in the next plan. First, the bitcoin falling with the solar eclipse is bouncing from the full trend point. In general, after the solar eclipse marked in the corner, the decrease in the rise decrease has been realized until each full moon. Now there is this next. Bitcoin The trend took acceleration up. It can give a decrease or stability to the full moon of October 7, and then it can rise with the subcoins. The second alternative is; Bitcoin Fixed or rise up to 7 October. Then the rise. Let's confirm this with technical analysis. Now; Possible decline in the future of the trend in daily analysis, ie 110150 dollars level. The fall can deepen so far. However, dominance may not rise, ie subcoins do not dilute much. We are over $ 116800 and we will get a stability when we stay on it. If that; If we go below 116800 dollars, we will see 110 thousand dollars again. In order to deteriorate and rise, we need to exceed 120 thousand dollars in order to deteriorate and rise. Then the target will be up to 129000 dollars. I recommend you to follow these levels and examine them. Dates now show 7 cultivation. Volatility will increase with the effect of the full moon. I wish you plenty of gains. It is for knowledge and idea purposes. Does not include investment advice!
Tynahan
Saros Güneş Tutulması ve Bitcoin.
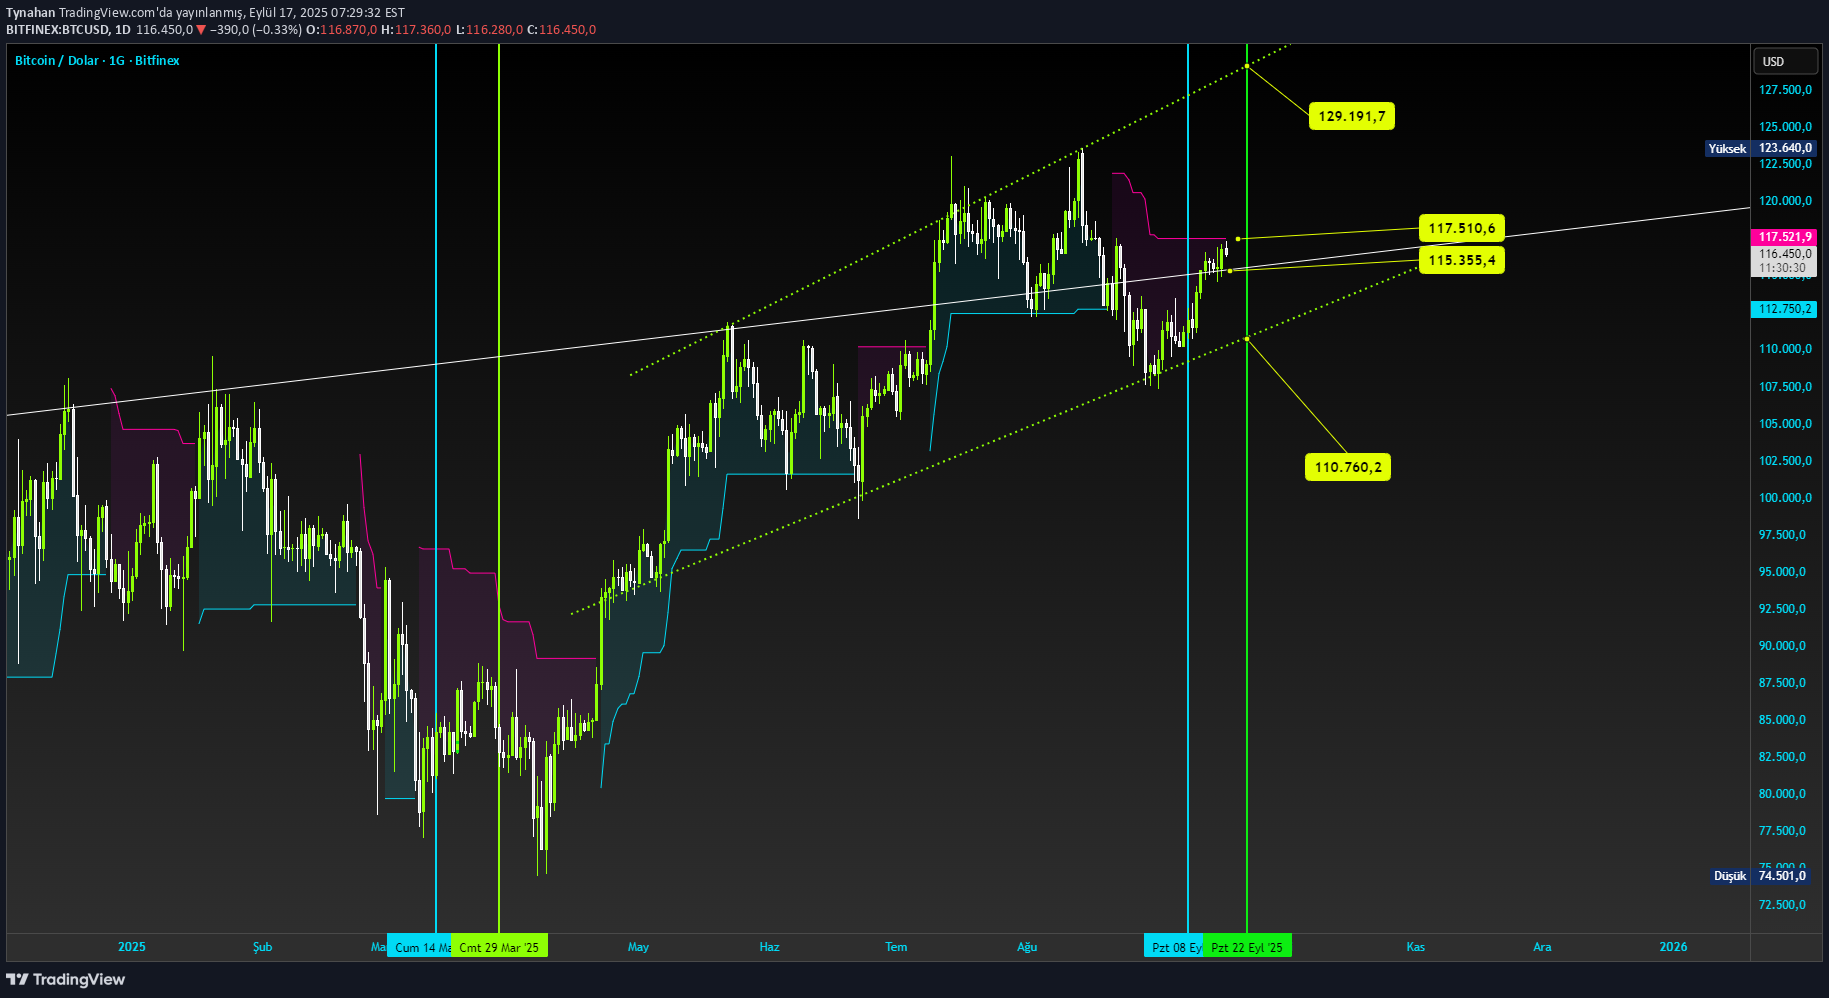
BTC The sun is eclipse .. Welcome to a different world, nothing will be the same anymore. Expected pandemi, natural events, drought and war !! We are entering the period in which everything can happen. Saros Solar eclipse. The Hebrews call him Annuni Sun eclipse. You've heard the Annunaki legend. In the global world, there may be very severe storms, especially Australia. You know the Morgate crisis that 2007 saros was born after the solar eclipse. In this context, there may be an economic crisis. The fact that he was in the South American continent in 2007 brought many floods and crisis in that region. Now I draw New Zealand and underlining Antarctic. This is actually an issue that will focus on the mystery of Antarctica. With the drought, glaciers can melt and the term Annuni can often come to our agenda. It is full of periods and economic crises when violent conflict with the PKK for Türkiye. The previous saros was in 1998 and was the period of incredible financial crises (Asia). Again, hurricanes had increased incredibly. Immediately after the Kosovo crisis was war. Now Türkiye's Israeli tension, Central Asian tension, Ukrainian Russian tension, violent economic events, and natural disasters may be more than flood and storm. The virus may spread and drought may come to our agenda. Extra; Apple was released at this time and we can enter the periods when new current technologies will have high levels of inventions. Let's get the highly anticipated Bitcoine. Sir, why did you explain this? Bitcoin Global and unfortunately I say that he is influenced by an ant in the world. We will also examine Antartika Gizem and the world's developing policy because the sun holds from there. Bitcoin 29 March stood up after the solar eclipse. Although our expectation was dragging the major coins in pursuit, he took a single major and left it. He's Ethereum. Now, as I shared in the eclipse analysis, we have come to the phase of completing the task of Altcoins. With the effect of the solar eclipse, Bitcoin has made a decrease in the down or up direction. This may say that I can come to the current value of 110700 dollars. Currently, the position is good, after the lunar eclipse, he caught acceleration, but he did not take the volume with him. If 117500 up -to -date value is passed, we can see $ 129 thousand. We can also see a decrease tendency below 115355 and $ 113250. My guess is that Bitcoin will be higher in the direction of being higher. Let me tell you clearly; Bitcoin Keep in mind the price when it enters the solar eclipse. I give an example 110 thousand dollars. March 2 will surely remain below the solar eclipse. In the meantime, if he wants to be a million dollars, but still on March 2 we will see 110 six. Now we need to watch the Altcoin season. Bitcoin If we will stay here determined and dominant, or we will look at 129 thousand dollars, but in general, we have entered a period in which Altcoin dominated. Ethereum and xrp As you can see, it bounces from the peak point. After the Eclipse of October 2, the XRP completed the Ethereum cycle after 29 March. So I told you. Eth On the way to the majors with the major, now after the majors need to move and finish the season. These three ways; Either Bitcoin 110/130 go to the altcoin season while coming Or Altcoin Season between 130/200 Or eth and xrp There is no coin left, the season is over Interpreted as. As soon as the Altcoins start to progress, we are shooting the season finale. Technically, Bitcoin xrp ada Completed the bull of single altcoins because the season was closed because I can not say that the Altcoins came if we had given the final. Things have changed because of the subcoins. Now we will follow our way in turn and determine our way. Dominance Bitcoin Unless you throw over 58.35 Unless the Tether exceeds the level 4.35, the direction is technically upstairs. With the solar eclipse, if you remember on March 29, we may experience a decrease and experience loss of value. After that, the Altcoin season appears. I will always support them with technical analysis basic analysis and current events. Saros If the solar eclipse appears to be a disaster, the financial market will remain alive. Each war will reduce the chaos financial market, but it will bring an increase. Great rise starts with a decline, not with the stop. As soon as the stagnation is broken, we will get up and continue to interpret the next haze. I wish you to be careful. And also I wish you plenty of gains✨ It is for knowledge and idea purposes. Does not include investment advice!
Tynahan
Labubu Efsanesi ve Kripto Paralar
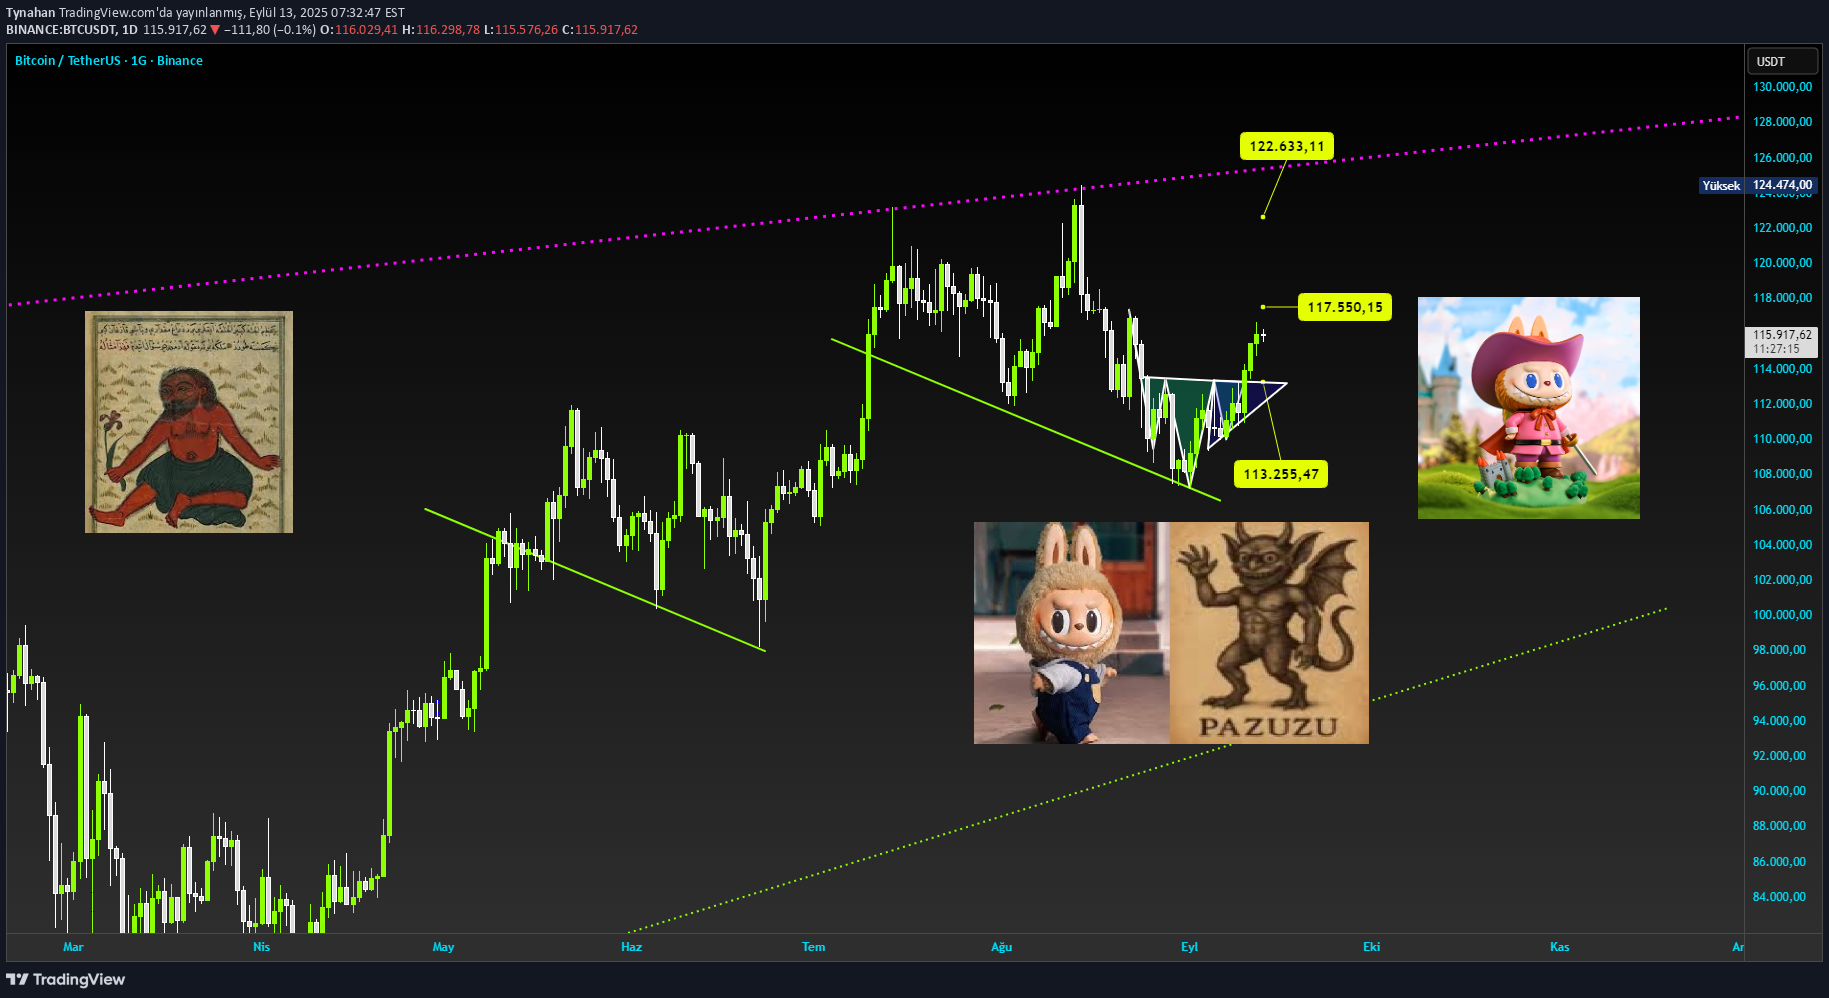
BTC Labubu'dan başlayalım. Aslında tahmin edildiği gibi mezopotamya ya da orta asya figürü değil 2015 yılında Hong Kong merkezli how2work şirket tasarımcısı Kasing Lung çıkarmıştır. Sivri kulaklar vampir dişler ürkütücü ve sevimli yüzü ile tanınır. Aslında cinler ile şeytanlar ile benzeştirme yapılarak popülerlik kazanmaya başladı. Peki kripto ile ne alaka yine neler oluyor? Aslında 2021 yılında NFT dünyasının hızlı gelişmesiyle beraber labubu koleksiyon ve totem ürünü olarak değer kazandı. Şimdi ise labubu oyuncakların evlerde hareket ettiği ve alan insanların sanki biri beni gözetliyor der gibi sözlerini duymaya başladık. Peki bu labubu? Geçmiş dönemdeki pazuzu mu? Pazuzu M.Ö. Babil ve Asur krallığında ortaya çıkıyor. İnsan vücudu, Aslan ya da köpek başı, Kartal pençeler, Kanatlar, Akrep kuyruğu, Çıkık gözler korkutucu yüz ile simgeleniyor. O dönemlerdeki rolü kaynaklara göre Kötü lakin bazen de koruyucu olarak tanımlanır. Özellikle çocuklara ve doğum yapan kadınlara musallat olan Lamashtu adlı dişi demonun düşmanıydı. İnsanlar Lamashtu'dan korunmak için pazuzu heykellerini evinin önüne koyarmış. Aslında bir nevi şeytanla şeytan kovma mantığı. Modern kültüre geldiğimiz zaman; 1973 yapımı The Exorcist filminde insanın içine giren figür pazuzudur. Pazuzu müzelerde bile sergilenmektedir.( Louvre) Pazuzu'dan bilinen kötülükler; Kuraklık, hastalık, rüzgar, bela. Şuan pazuzu yok gibi ama var aslında. Bilinçaltımıza ne veriliyor? Labubu ya da oyuncak bebeklerin Chaky gibi canlanması ve ürkütücü olarak benimsenmesi aslında içgüdüsel olarak var. Bir maddeyi uyandırma isteği insan içinde var. Ona bakıp canlandığını düşünürsen rüyana girer. Boyut değiştirdiğin an bunu gerçeğe dökebilirsin. Yıllardır Zincirli bir adada hapis olan Deccal. Masumiyet ve korkutucu yapısı kur'an'da geçen 7 varlıktan birini anımsatıyor. Eski dünyalara baktığımız zaman teknolojiniz çok üst seviyede olması ve ardından bir felaket ile dünyanın yerle bir olduğunu defalarca kez görürüz. Teknolojiyi insan oğlu mu buluyor yoksa insan oğluna birileri mi söylüyor? 5000 yıldır taş ile sopa ile devam ederken birden zihnimiz gelişti de son 100 senede devrimler mi yarattık ? Piri Reisin haritasındaki o dünya dışı varlıklar neydi? Piri Reis o Haritayı onlarla mı çizdi? Dünyanın sonunun işaretleri bunlar oluyor. Kuran da da bahsedildiği gibi 7 varlık dünyaya gelmeden asla kıyamet kopmayacak. Deccal içimize gelecek ve ona iman etmemizi isteyecek. Ve bize mucizeler sunacak. Demekki önceden de buradaydı ve sundu. Şimdi ise zindanda. Tıpki yecücler gibi. Onlarda kazısı bittikten sonra dünyaya gelecek? Benzetmesine bakarsak tıpki pazuzu gibi tipleri var. Bunlar dünyada ve defalarca kez yüksek teknoloji ilmine ulaşmış görmüş varlıklar. Yok olan insanoğlu oluyor. Şimdi ise teknolojinin asıl başlangıç noktasındayız zamanla ilerliyoruz ve kuantum kullanılmaya başlayınca işler ciddileşmeye başlayacak. Neydi hastalıklar? kasım gibi büyük bir hastalık tufanı bekliyorum. Kuraklık yalanı? Antartika saklı mu kıtası mı? Piri reisin haritasında var ve dünya dışı varlıklar ile beraber resim etmiş. Teknoloji artıyor. Daha önceden de vardı zaten. Sırayla hepsi gelirken yıllardır yapılmaya çalışan kripto para ile ödeme ve hayatımızı buna göre yaşamak da artık çok yakın. Tahmini 2029 da dünya kriptoya geçecektir. Labubu ? Labubu bize aslında verilen bir mesajdır. Dünya sona yaklaşıyor ve her zaman her yerde seni gözetliyoruz. Büyük sınav ve büyük macera için antik dönemden şimdiye şeytanları deccali anlatan figördür. Bunun gün yüzüne gelip ve oyuncak olarak böyle tasarlanması ileride karşılacak durumlara aşina olalım diye. Belkide gerçekten içinde cin var ve bizi gözetliyor. Kuran'da cinlerin insan içine girebileceği zaman kıyamet alametinden bahsediyor. Belkide orada bizi gözetliyor. Şimdilik bir figür olsa da yarın gerçek olabilir. Bu olayda son teknoojiye yaklaştığımızı ve bize son anlarımızı anlatıyor. Artık kripto teknolojinin son zirvesi olacak. Bitcoin logosuna bakalım. Jupiter logosuna bakalım. Jupiter temsili uzayın sürekli genişlediini temsil eder. Bitcoinde sürekli genişleyerek devam eder. Uzay kavramı genişleyen sonsuz yer olarak kabul edilir. Mezopotamya ve antik dönemdeki tabletler? Bunlar taş tablet mi ? Yoksa gerçek tablet mi? Mal takasında tablet kullanıldığı figürler görebiliriz. Labubu Efsanesi hem nft ile hem coini ile kripto piyasasında olsa bile en önemlisi kripto paraların teknolojinin son aşaması olması ve dünyaya deccal geri dönüyor mesajı vererek zirve bir teknoloji ardından felaketler görebileceğimiz figürleri ile bize tekrardan bir uyarı yapıyor. Reankarnasyon varsa bunu içgüdesel olarak yapıyoruz. Ya da tekerür ile yolumuza devam ediyor. Efsanedir. Kehanettir. Lakin olmayacak diye bir şey yok. Labubu gücü adına bitcoin 117500 geçerse 122000 dolara geçebilir. Eğer pazuzu adına gelirsek 113200 dolarda bizi koruması için heykelini koyacağız Bol kazançlar dilerim. Her şey önümüzdeki güneş tutulmasından sonra çok değişecek. Bilgi ve Fikir Amaçlıdır. Yatırım ve Bilgi Tavsiyesi İçermez.
Tynahan
Kanlı Ay Tutulması ve Bitcoin.
BTC Bloody Moon Eclipse; 🌕 What will happen in the world and in the financial market? What may be the effect of the bloody lunar eclipse in September. He knows that there was a solar eclipse in front of us and there was a possibility of Istanbul earthquake in the previous solar eclipse. What awaits us now? The primary effect of this month's eclipse may be water raid or flood disaster, especially in Asia and Europe. That social pressures increase and the people of the people draw rebellion flags in the name of freedom; Or an innovation may be social uprisings to appeal to technology or a law. We can observe fluctuations in the financial market and especially in the oil market. Where are we going inside these days? What is the world, where is it possible to have sprit -based effects like what am I doing So what will ours do? A big direction movement is coming. What does this month eclipse affect now? Everyone thinks as an astrology, but let me explain scientific immediately. The moon affects gravity and water gravity. Doesn't our 75 percent of our water affect us? Of course, this is a very important factor because we affect the financial market. Bitcoinde direction comes with the effect of solar eclipse direction will increase. The installed trading and volume will increase incredibly. The entrances will multiply, of course, at the outlets. In this range, the FOMO cycle is possible or if there is an increase in the rapid lock point, it is possible to decline suddenly. Is the bear season coming? Bitcoin In time, he entered the last plain he had completed. No matter how much it increases, if it increases, it will remain lower than the level it enters the solar eclipse in the next eclipse! When I shared their March eclipses, it proceeded from 73 thousand to 125 thousand dollars. Now the last progress of Bitcoin may be the final or final. In this range, the major coins went directly Major, so he lived the bull and went to the hill. Taurus means the maximum peak of the peak of inflation for me. Majörs moved to the next stage, minors will make progress later I will give the subcoins later. Bitcoin Moon eclipse, my estimates will be risky until the solar eclipse will be the main estimation of the solar eclipse. The first is a rapid increase in 125 thousand. Secondly, a harsh decline to $ 106000 decreased to $ 93000. Lock point daily moving average value. The volume will come and we will determine its direction. Hard movements are waiting for us until the solar eclipse. Be sure to reduce your risk in this period when the stock exchanges do not work. New trading in September will be risky. I wish you plenty of gains✨
Tynahan
Bitcoin Son Durum Değerlendirmesi.
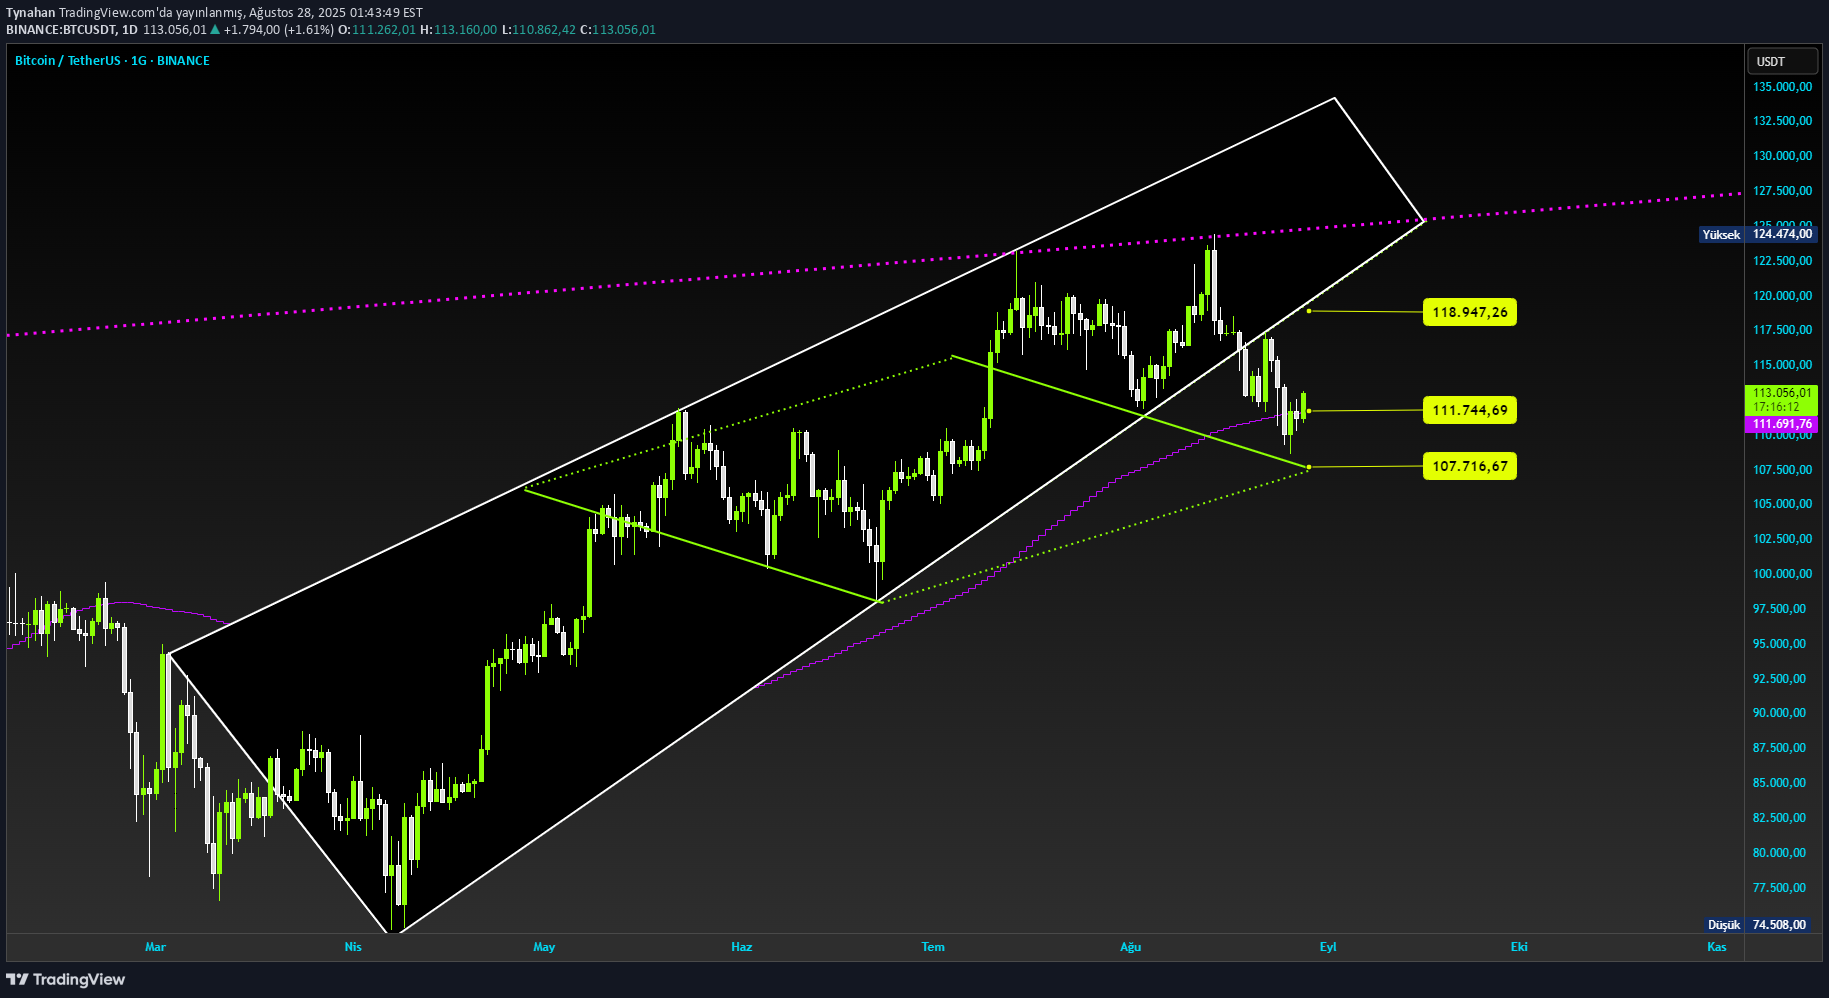
BTC He's trying to get back his broken wings. We've been following the formation in the white frame for a long time. 125 thousand dams come from here. We couldn't break it. Alt We were under the trend of 113500 trend. Now even if you wander at 113 thousand levels, you've broken once, your return is more expensive. In other words, the instant level of return of the trend in 113 thousand dollars was 119 thousand dollars. This level will be the point of entry into the trend and suddenly acceleration with volume. We stuck in the bear trap area. This formation is usually a decrease formation and I mentioned in my previous posts, the target is 98 thousand dollars. In this season, we follow the bear trap, especially in Altcoins. Ada I shared it as an example of the full bear trap area twice bounced. Why shouldn't he have done that bear trap in Bitco? Because while rising, bitcoin We started to control trap in the subcoins because it progresses with traps. What is the rule? Bitcoin Following the movements of the Ethereum to analyze. What is the situation now? Bitcoini is doing his bull ripple made ethereum He did the next major. Bitcoin Is it back for major? Bitcoin $ 111700 also corresponds to the moving average of the positive area. You will even see green lines in the graph. They are equilateral and the same px. If we think that he did this by breaking the trend without breaking a trend in a few; Increases up to 119 thousand dollars is risky. Up to 108 thousand dollars, Bitcoin's low channel confirms the rising area. So I suggest you follow it carefully. The only difference between the previous rise continues with the decline formation. It is for knowledge and idea purposes. Does not include investment advice! I wish you plenty of gains.
Tynahan
Bitcoin Son Durum ve Teknik Analizi.
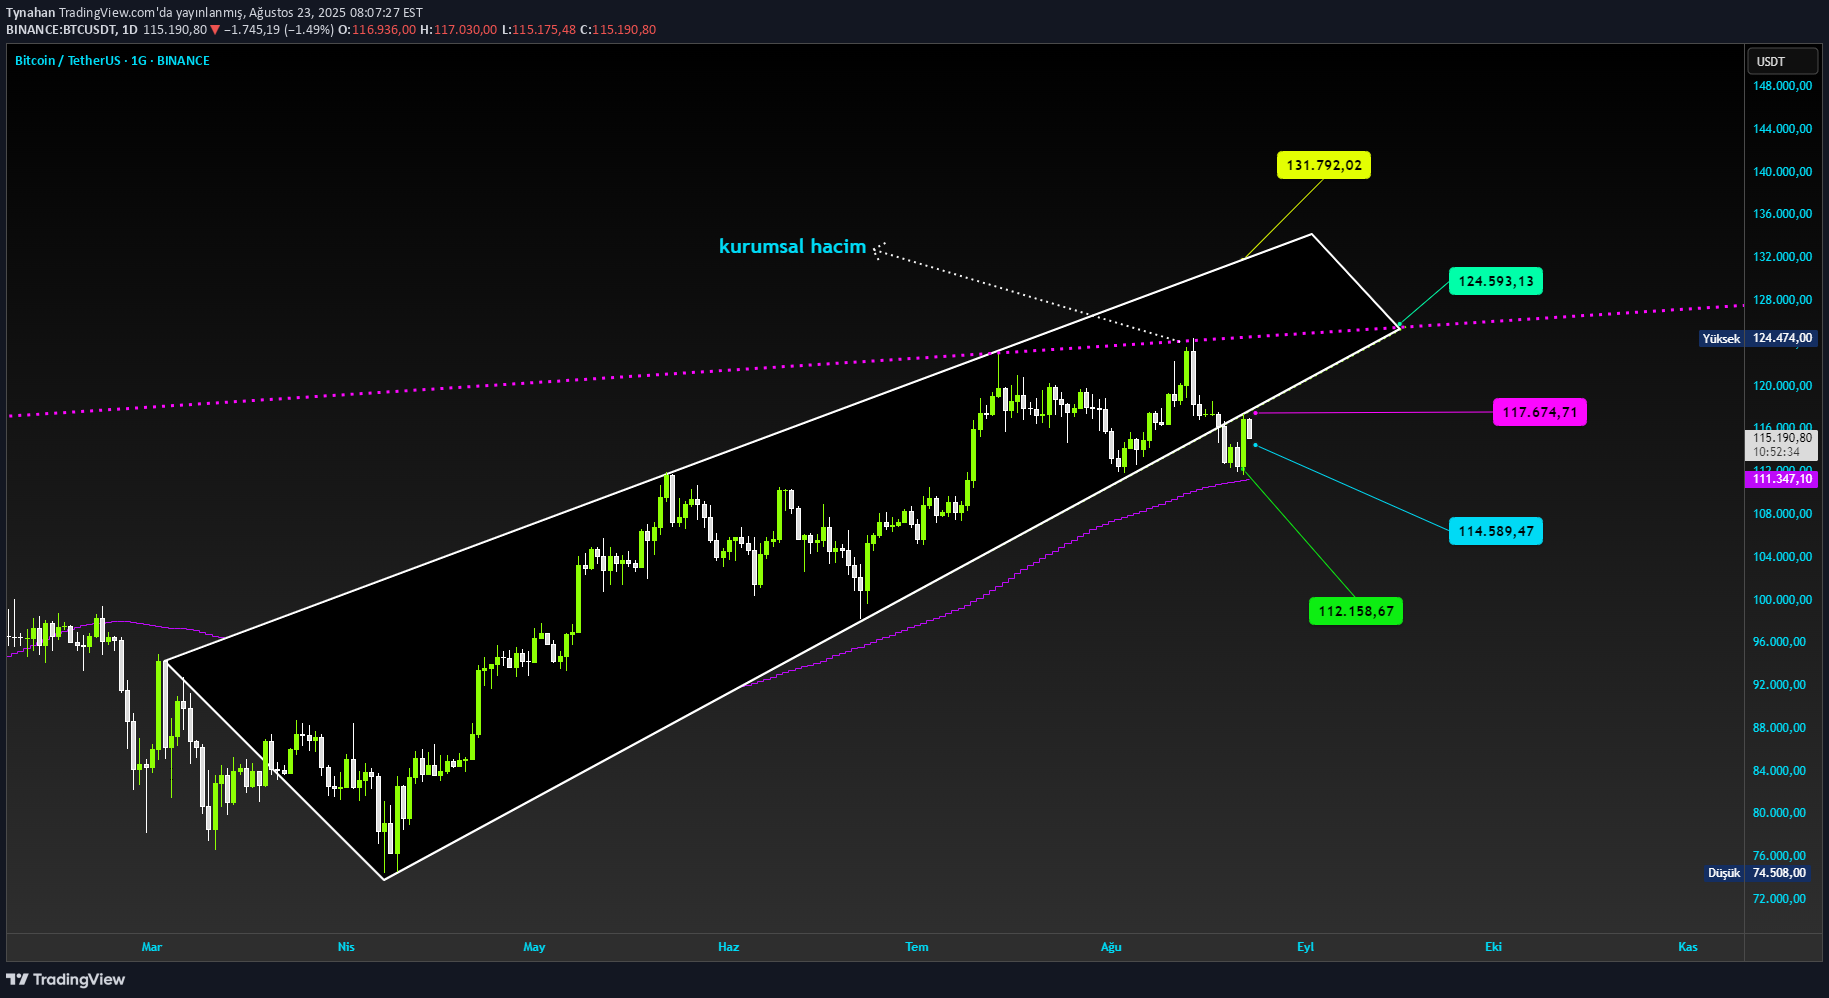
BTC The prices I mentioned in the previous post continues. We eat from the critical threshold; If we cannot go on the trend return and the trend you see on the screen, we cannot assign the danger of falling. The first level we need to pay attention to is; $ 117674. This is the place of return and over acceleration. It will be the next target with $ 124500 with $ 124500. We will pay attention to the $ 131792 level due to formation. Alt Our limit is 100 -moving average. These 100 -moving average and bear trap zones are working. So it is good to be reliable again, but if we cannot go on the trend again, the full average average re -on -the -agenda comes before the $ 112100 level meets us. As long as we stay on it, there is no problem. Especially tomorrow will be closed for weeks and the closing of the week is over $ 113500. The trend that falls on the weekly becomes normal, everything becomes normal. My general and intuitive interpretation; First of all, when the technical analysis works well, let's check the values by paying attention to this. If we enter the trend, we will reach $ 125000, which is important. If you remember the 2021 blue area I shared in the previous shipment, the bull is actually a 20 percent error part of the ath hills. So if $ 125000 is passed, there is a possibility of $ 180000 in a week. What's going on? First we came on the train, there is progress. Here, it becomes difficult to cross $ 125000, especially if the subcoins make good progress. For those with major weighted Altcoins, I was waiting for a season until the 18th of September to the solar eclipse. The increases of majors such as Eth and based coins link are on the agenda. That's why they can attack up to 18 September to make the final. But what's the rule? Let's get on the train ($ 117500) after $ 125000, then the confirmations will show us the movement of the major season. Let's say these have happened, what will be our subcoins minor? These can flow to the minor part after the demand shift after the fall of September, so as I mentioned in the previous shipment as Altcoin season stages The second stage minor can be after September. At this stage, let's not forget to move gradually, taking into account the trend turn we need to control and the important levels I mentioned above. If the trend does not return, there may be some pause in the industry. If there is a return, it would be a legend. Tether has fallen down from an important point and falling down from the falling trend, and if you need to check the targets 4.17/4.07/3.90 on the top, there is no problem unless 4.50 is 4.50. < Sun and Moon eclipses are approaching in September with you in the long -term periodic analysis will be blinked. The important thing is to check the way it shows us in September after April 13. I will make information I wish you plenty of gains. It is for knowledge and idea purposes. Does not include investment advice!
Disclaimer
Any content and materials included in Sahmeto's website and official communication channels are a compilation of personal opinions and analyses and are not binding. They do not constitute any recommendation for buying, selling, entering or exiting the stock market and cryptocurrency market. Also, all news and analyses included in the website and channels are merely republished information from official and unofficial domestic and foreign sources, and it is obvious that users of the said content are responsible for following up and ensuring the authenticity and accuracy of the materials. Therefore, while disclaiming responsibility, it is declared that the responsibility for any decision-making, action, and potential profit and loss in the capital market and cryptocurrency market lies with the trader.