
TradingMula
@t_TradingMula

What symbols does the trader recommend buying?
Purchase History
پیام های تریدر
Filter
Signal Type
TradingMula
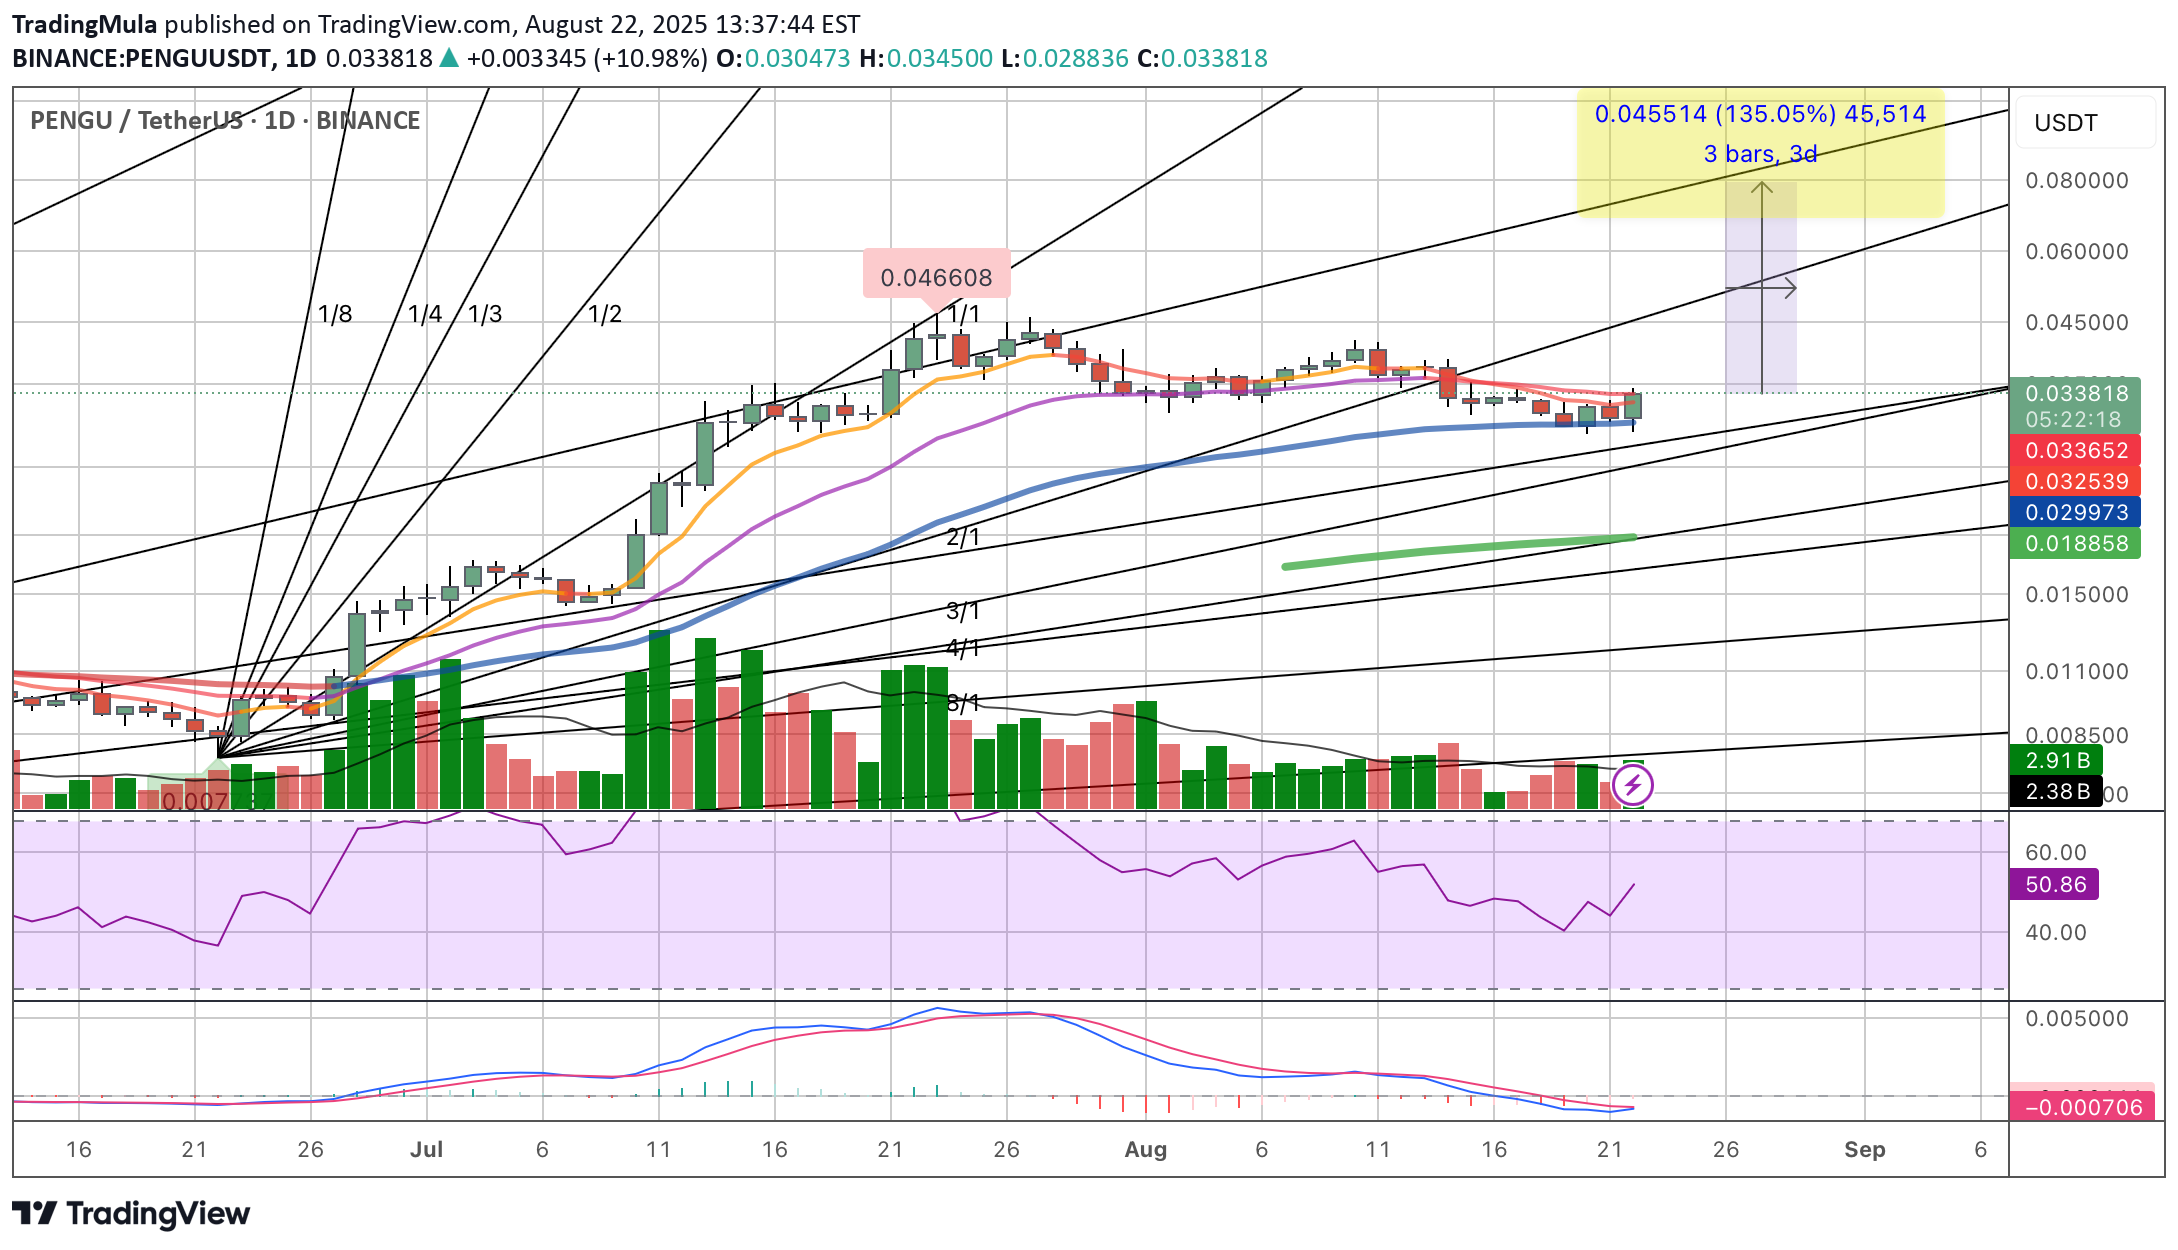
PENGU is showing classic signs of a bullish breakout. After a period of significant consolidation, the price is now testing a key resistance level. With multiple technical indicators—including a recent bullish divergence on the MACD—flashing green, a push to $0.05 with extensions up to .08 appearing imminent. This consolidation phase has built a strong base at .03 for the next leg up.
TradingMula
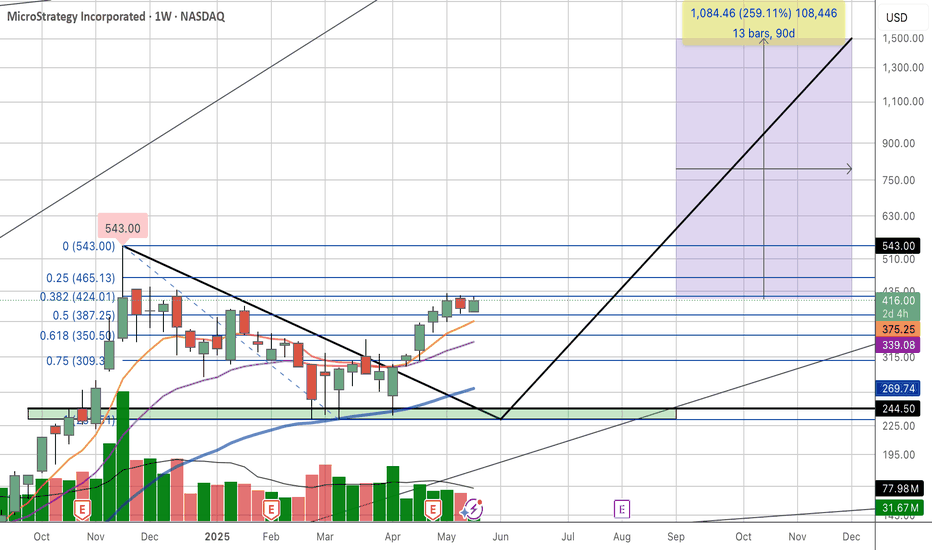
MicroStrategy (MSTR), the stock is currently demonstrating significant volatility and a strong correlation with Bitcoin's price movements, acting almost like a leveraged play on the cryptocurrency. From a charting perspective, MSTR has been in a long-term bullish trend since its pivot to a Bitcoin acquisition strategy. However, it's prone to sharp corrections following Bitcoin's pullbacks, indicating high risk and reward. Key technical levels to watch would include its 200-day and 50-day moving averages as potential support and resistance zones. The charts are now flashing strong signals that this sideways accumulation phase is drawing to a close. With Bitcoin (BTC) showing renewed strength and eyeing fresh all-time highs, MSTR, as the largest corporate holder of the digital asset, appears poised to break out. The correlation remains a potent force, and the current setup suggests MSTR is ready to re-engage its upward trajectory, targeting new price peaks in tandem with BTCToday we are seeing relative strength in mstr suggesting that the catch up could be starting this weekA big move looks to be coming soon. Mstr to new all time highs don’t count it out
TradingMula
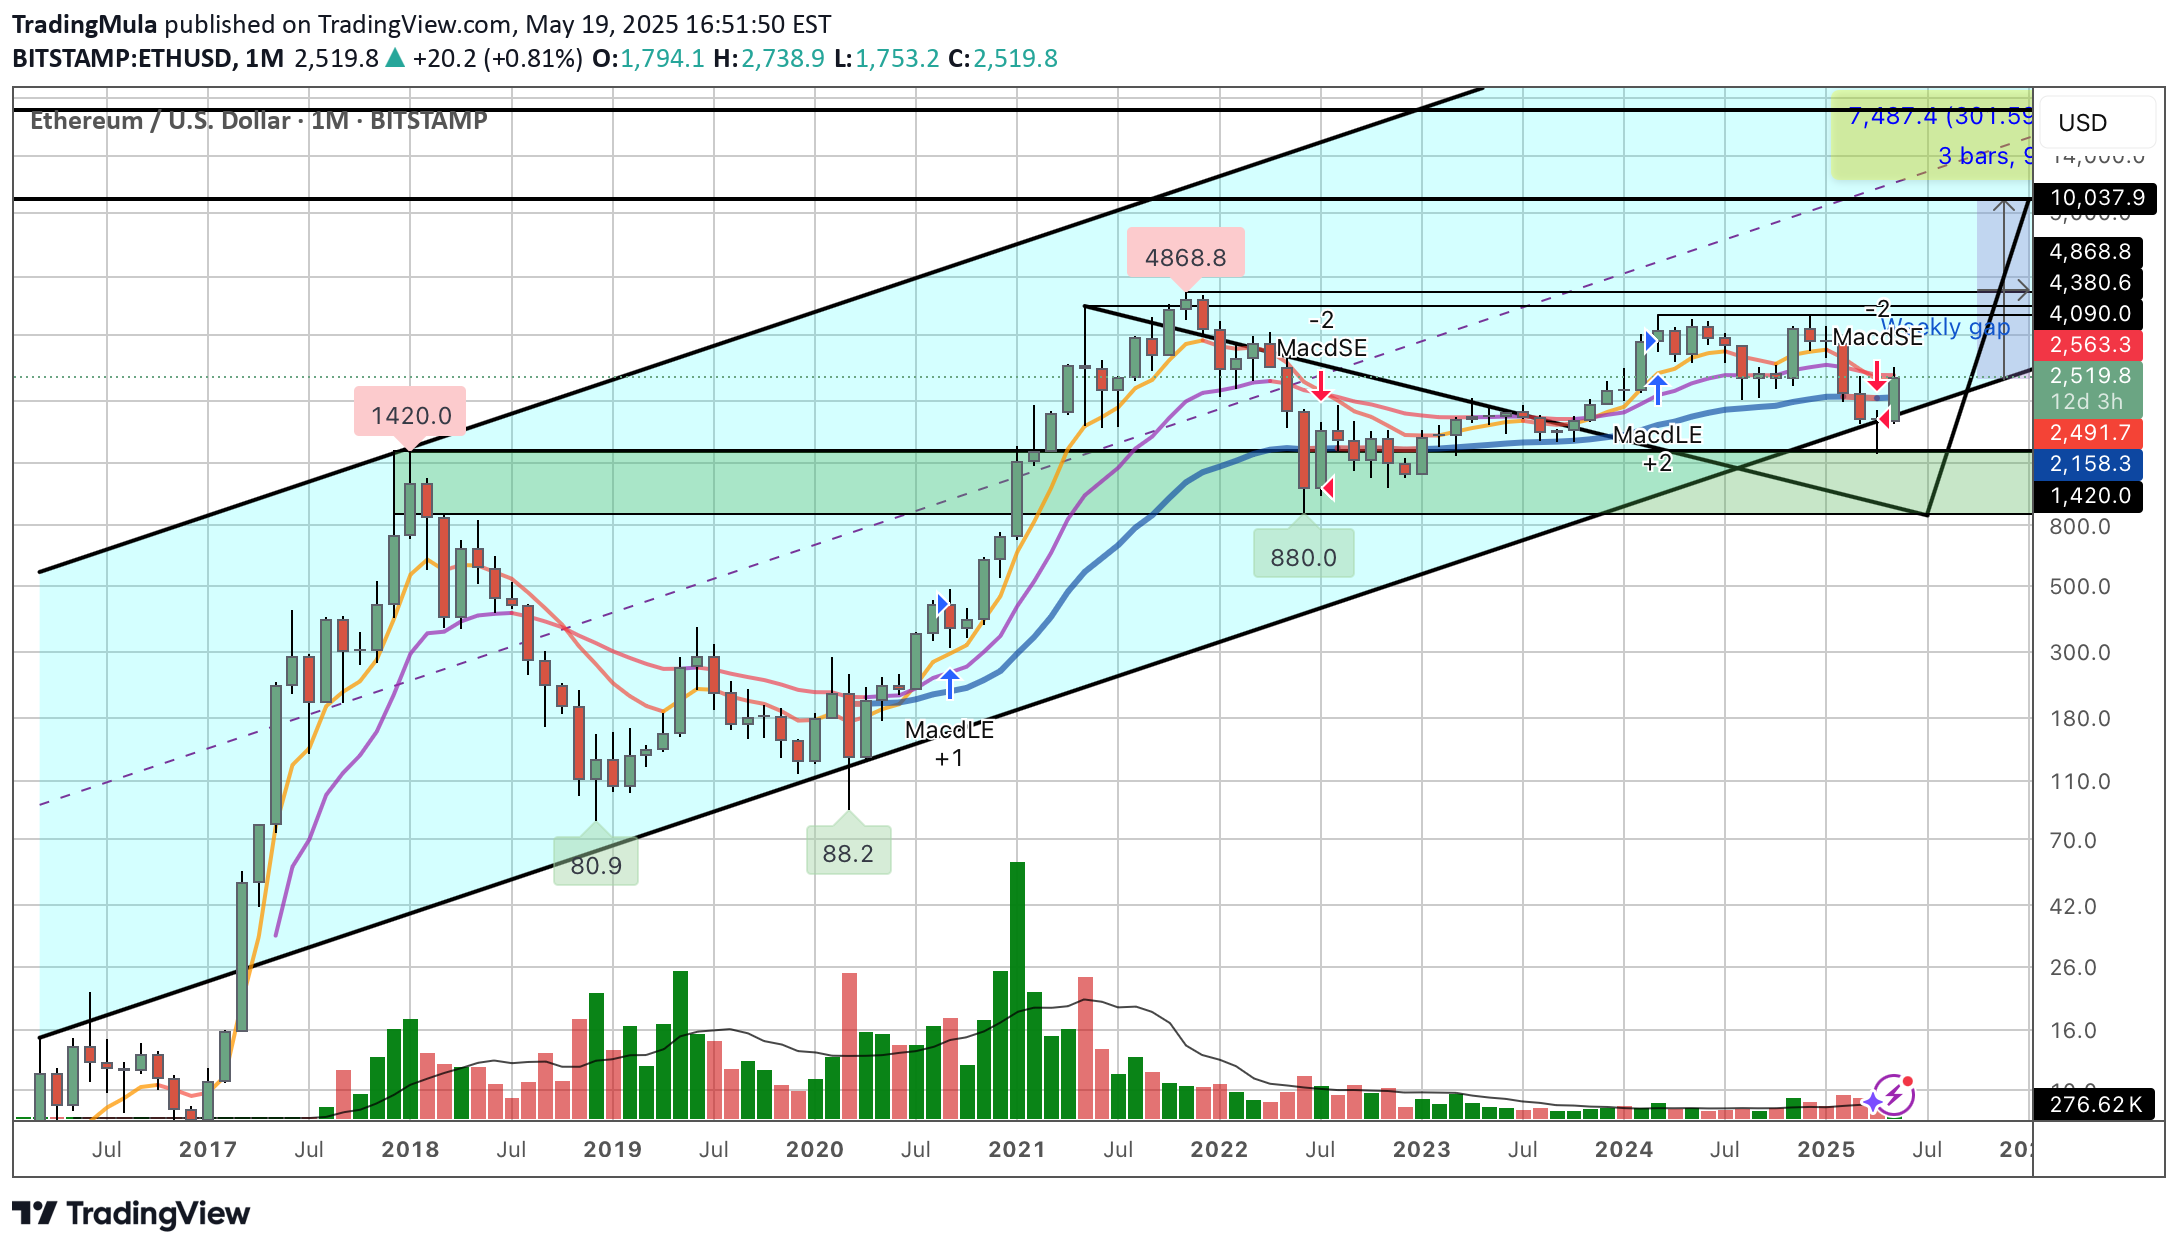
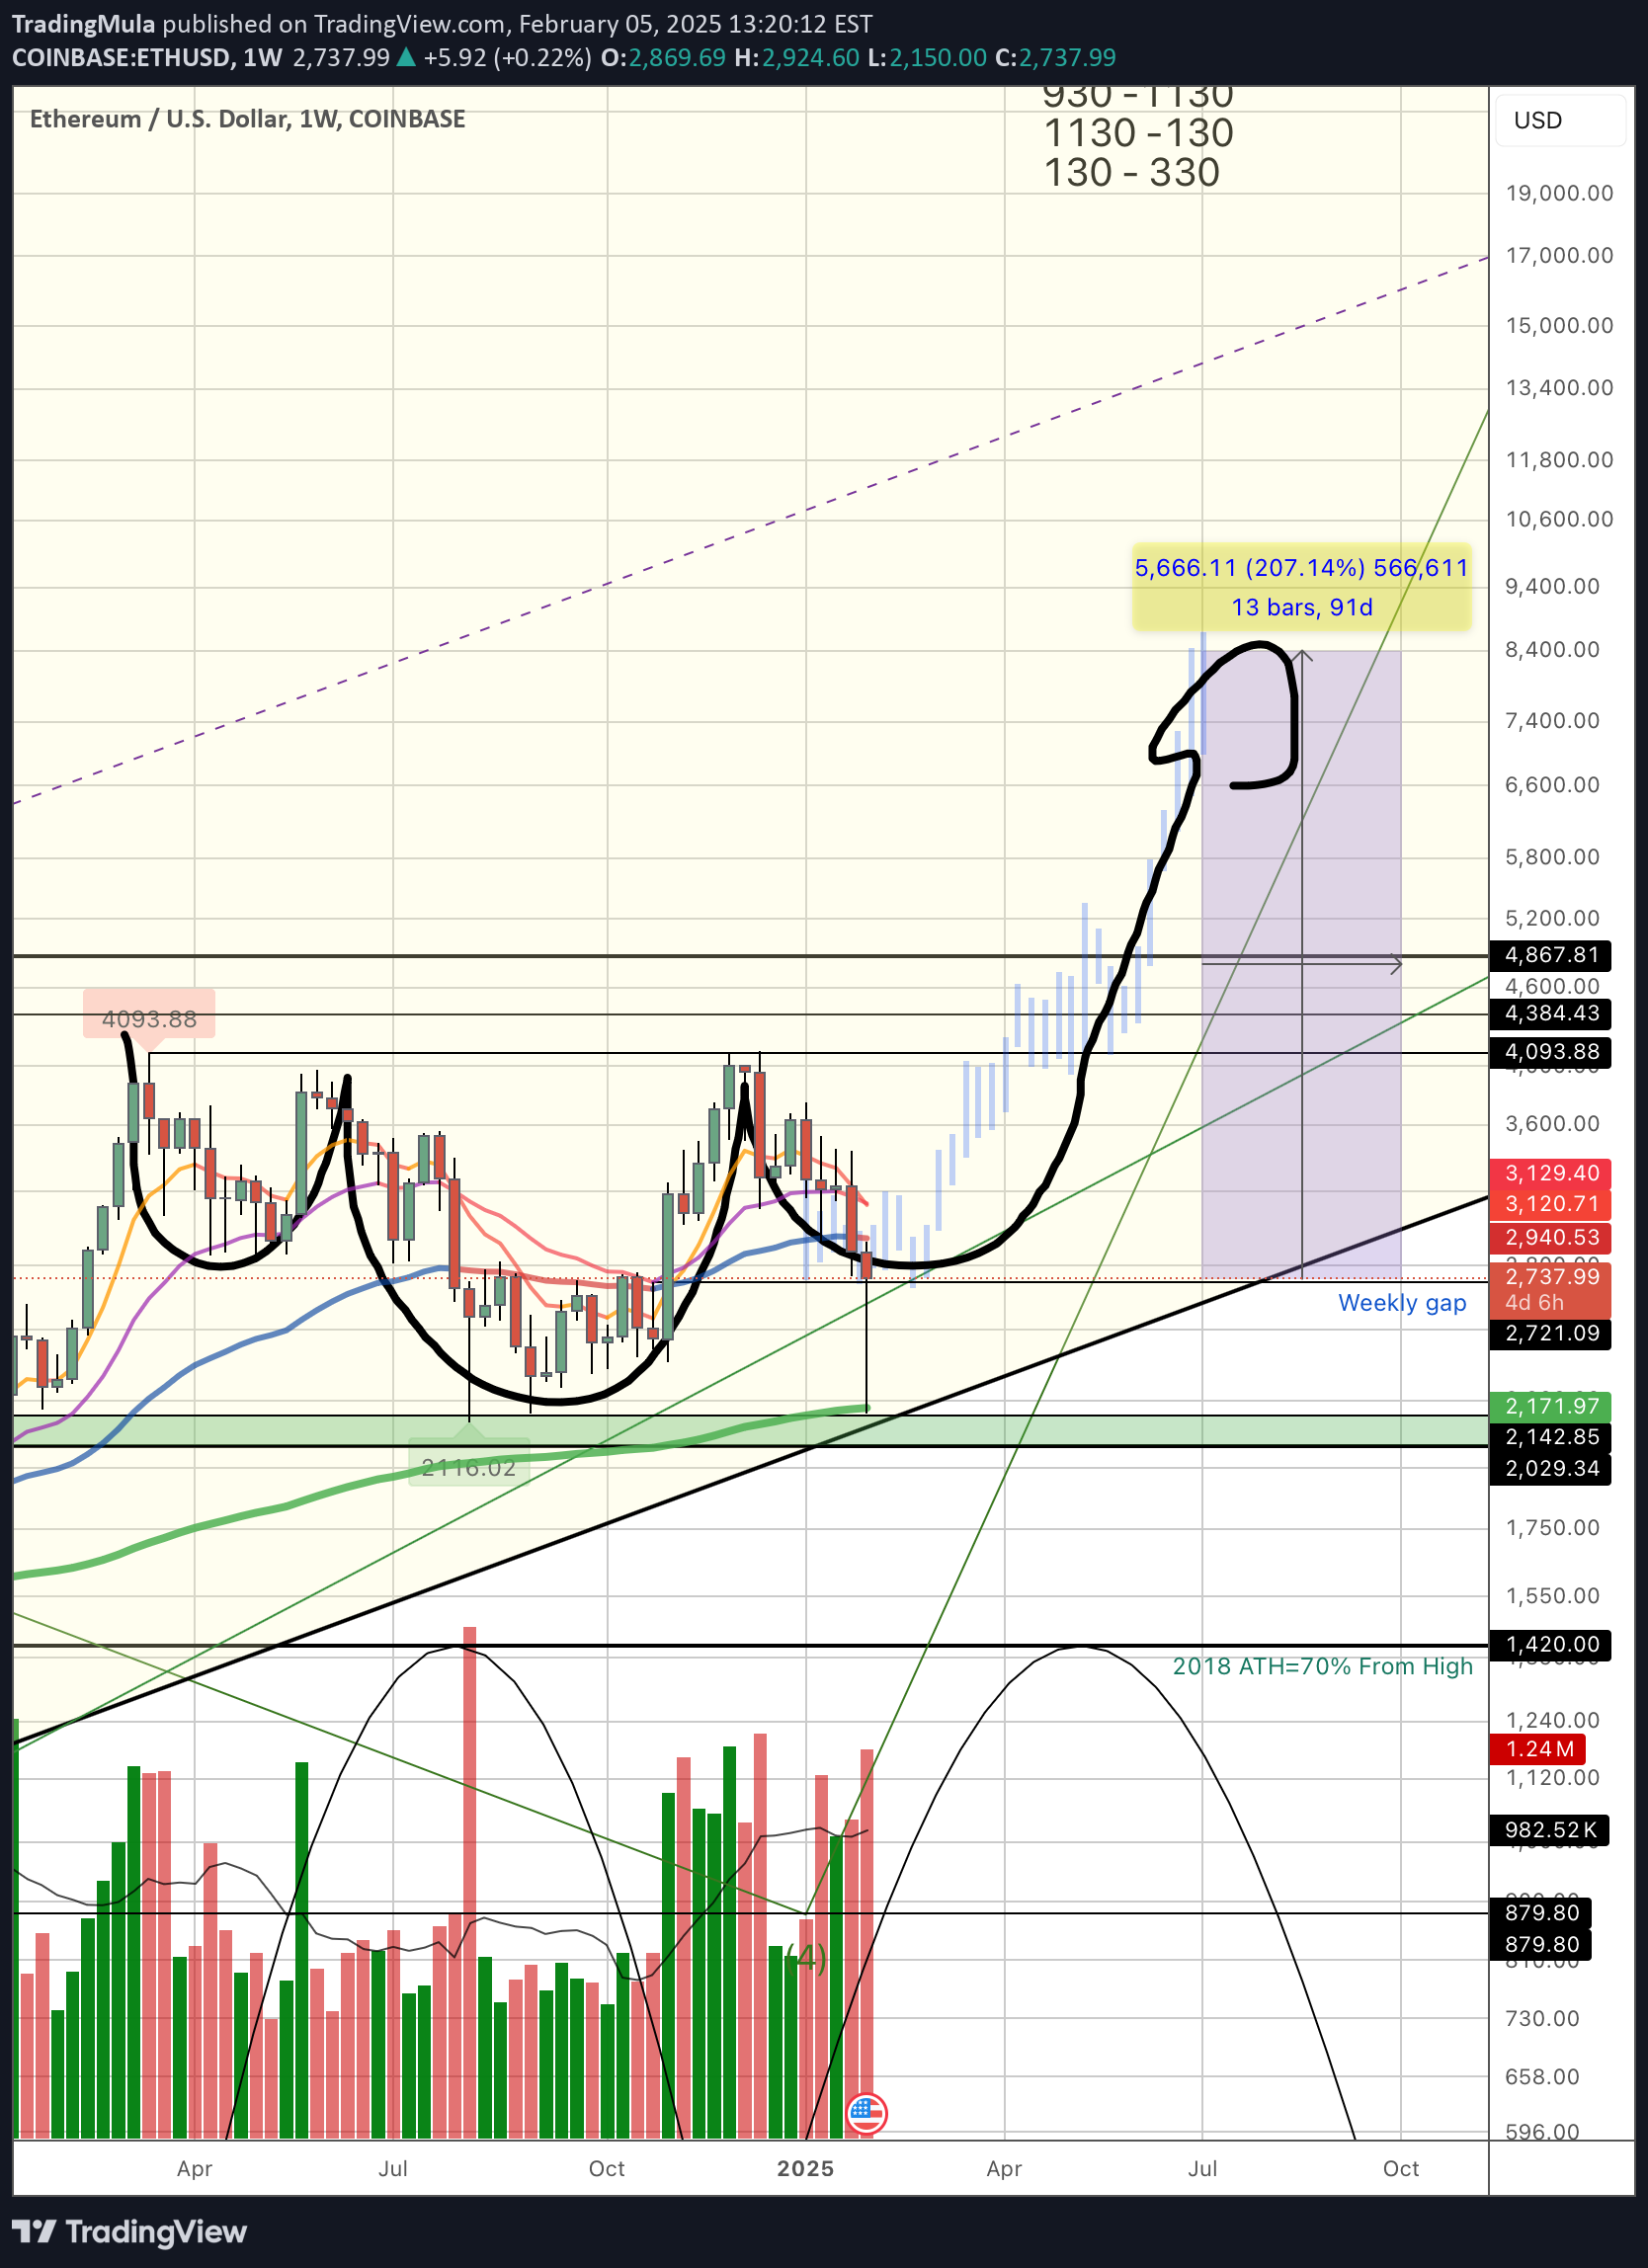
Ethereum's protracted consolidation between $2,000 and $4,000 over the past four years appears to be reaching a critical juncture. This extended period of sideways movement has built significant potential energy, suggesting that the market is coiling for a substantial breakout. Technical indicators are hinting at an imminent end to this consolidation phase, with increasing bullish momentum. Should Ethereum decisively break through key resistance levels, a rapid ascent towards the $10,000 mark by the end of the year becomes a distinct possibility. The duration of this consolidation underscores the magnitude of the anticipated move, making Ethereum a key asset to watch for substantial gains. Anticipation is building for a potential surge towards the $10,000 mark by the end of the year. Several factors underpin this bullish outlook, including increasing institutional interest, the ongoing development and adoption of Ethereum's Layer-2 scaling solutions, and the continued growth of the decentralized finance (DeFi) ecosystem. The upcoming Fusaka upgrade, expected in late 2025, which aims to significantly reduce Layer-2 costs through Peer Data Availability Sampling (PeerDAS), is also contributing to optimistic price predictions. If Ethereum can maintain its current momentum and break through key resistance levels, the $10,000 target remains a distinct possibility.ETH moving toward $4K resistanceWatch out for it, here she comes
TradingMula
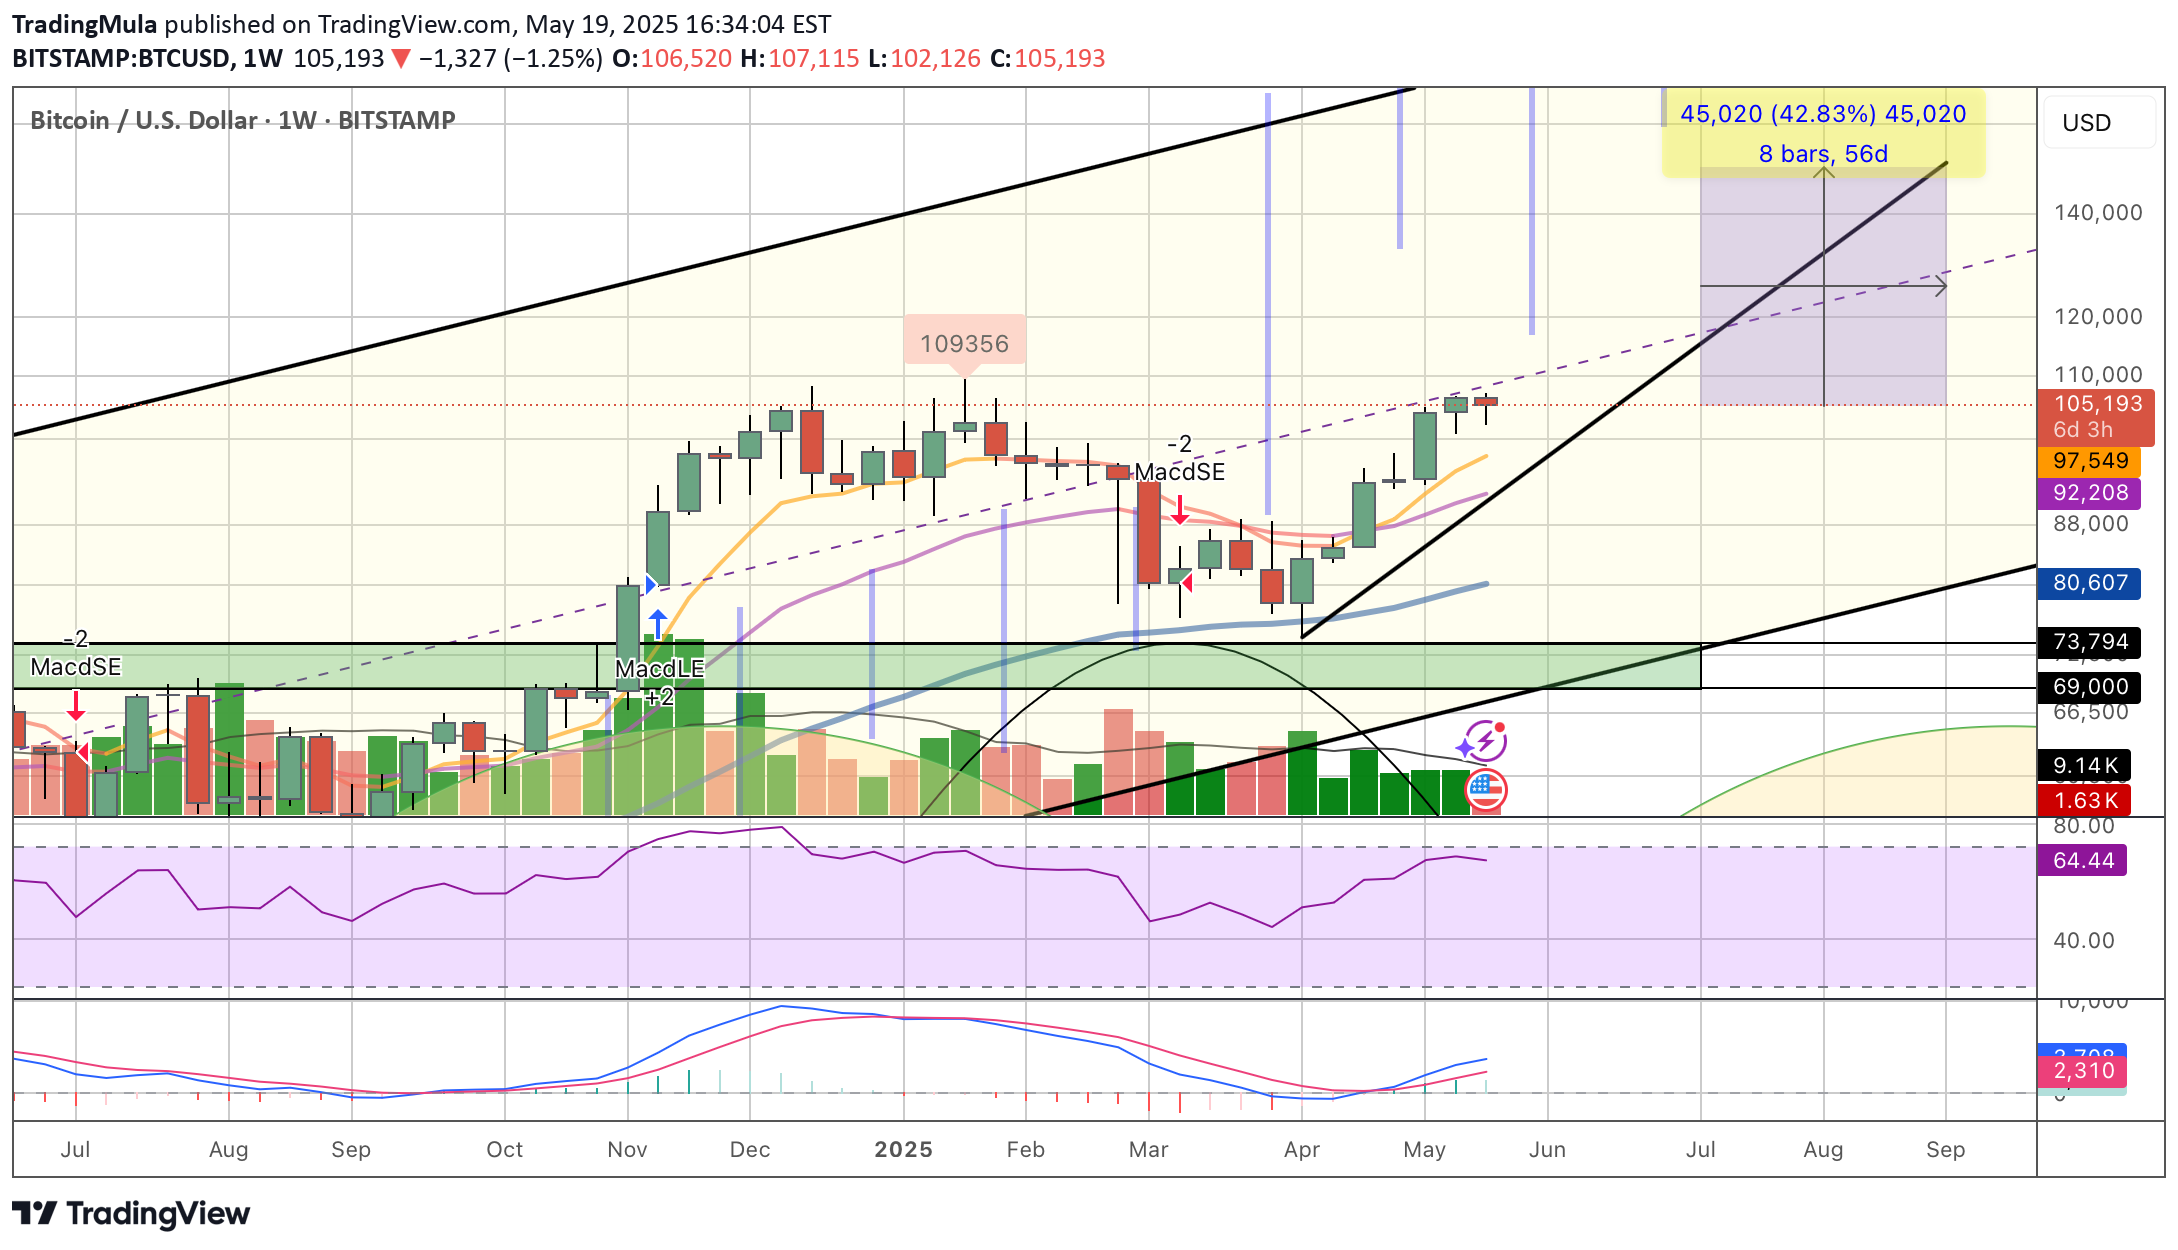
Bitcoin currently shows characteristics of bullish consolidation. Following a notable upward move after the election , the price action has entered a phase of sideways trading within a defined range since inauguration. This period allows the market to digest recent gains and for buyers to accumulate further positions before the next anticipated leg up. Technical indicators, while showing a temporary pause in upward momentum, generally remain supportive of a bullish continuation, with key support levels S1-75k, S2-100k holding firm. The consolidation phase, marked by decreasing volatility, often precedes a strong directional move, suggesting that Bitcoin is coiling for another potential surge.New all time high suggests we are now on the way to $150K
TradingMula
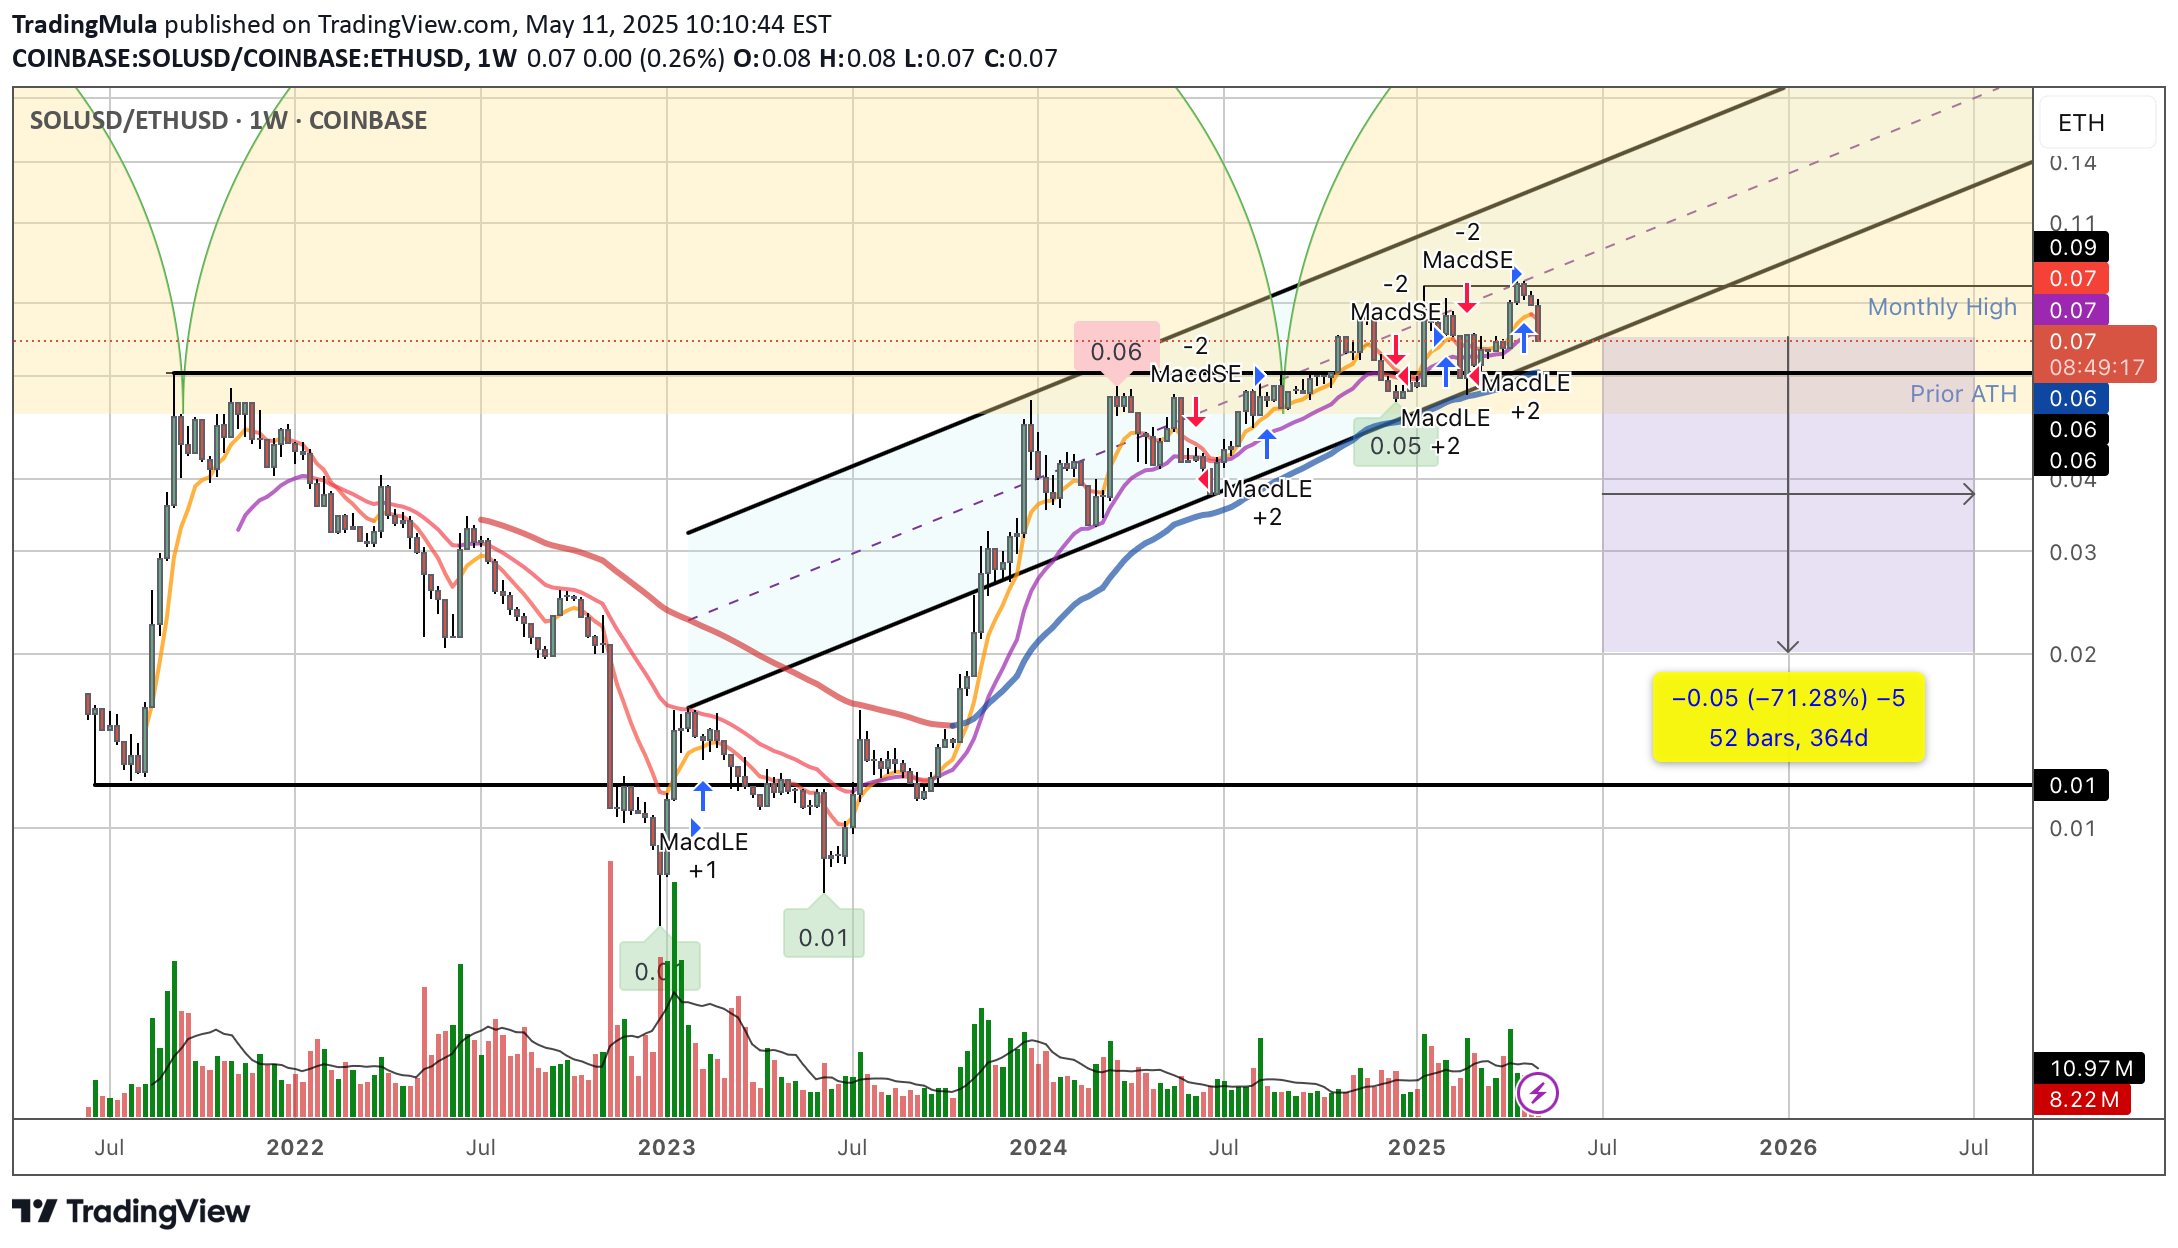
$SOL/ ETH ratio may soon decline as Ethereum shows relative strength. ETH's new upgrade on scaling solutions and DeFi dominance could outpace Solana's momentum. Watch for ETH outperformance! #Crypto #Ethereum #Solana Chart pattern is now showing a classic Elliot wave bearish ending diagonal pattern which will be confirmed when ratio breaks back below the prior all time high of 2022Solana /ether pair has broken down and is confirming that relative strength can be continued in Ethereum suggesting the tide is flipping from solana to ethereum
TradingMula
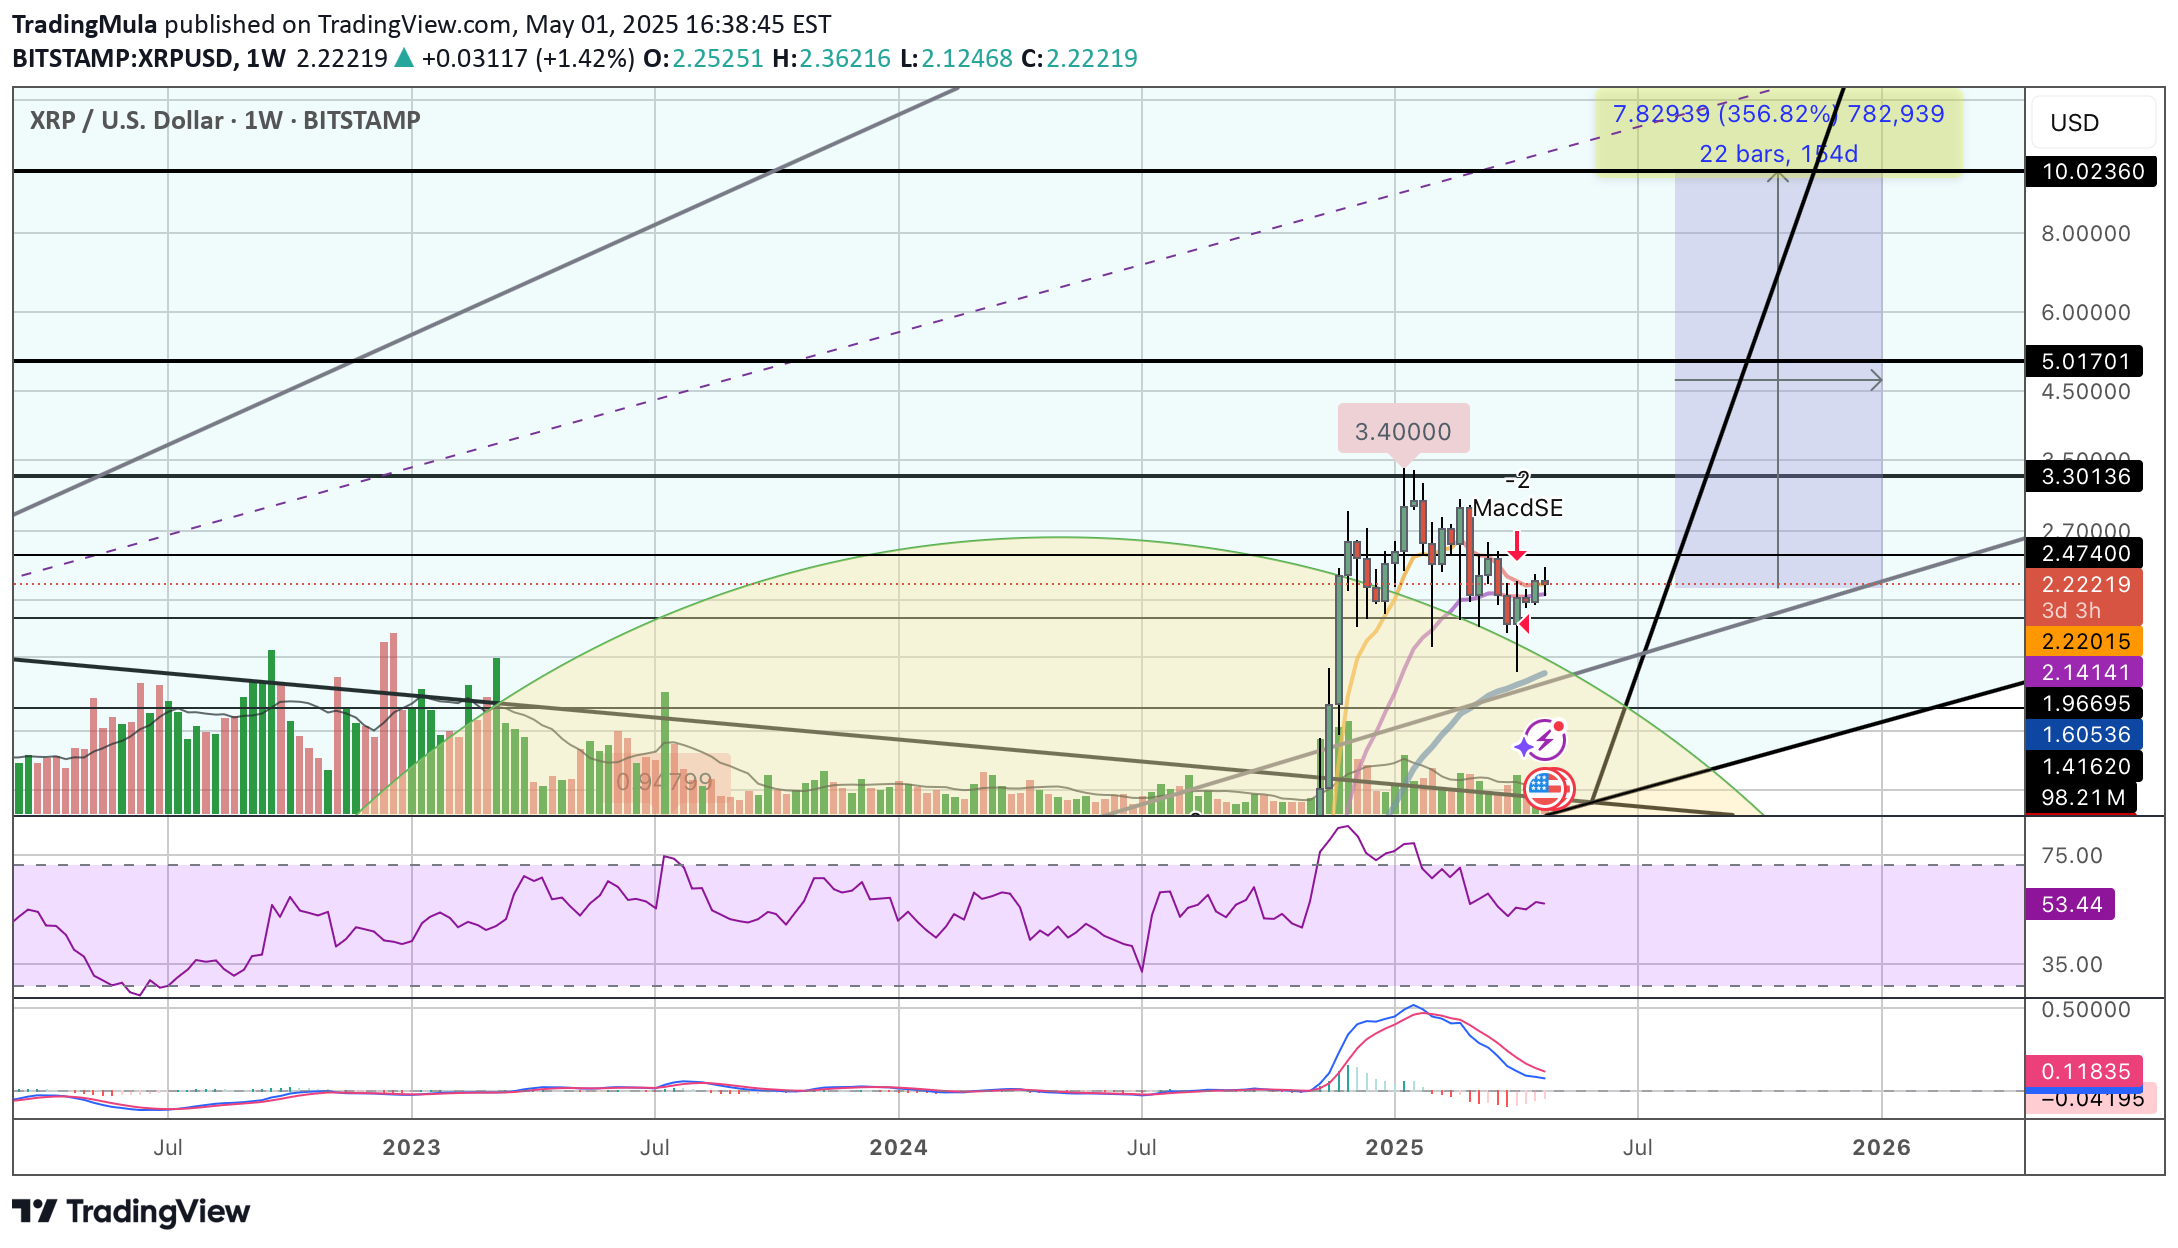
XRP is currently showing a weekly bull flag pattern, a technical consolidation phase that often precedes a significant upward price movement. This formation suggests strong underlying bullish momentum, and a breakout from this pattern could propel XRP to new yearly highs. Earlier in the year, in March 2025, the SEC dropped its appeal in the Ripple Labs lawsuit. Later in the year, in June 2025, decisions regarding an XRP ETF to be announcedPattern still valid. Consolidation seems to have ended, now showing potential to resume uptrendBreakout confirmed with $5 now looking possible$5 looks simple now. May I say $10 by end of year ?
TradingMula
Although the sentiment around Ethereum seems to be leaning bearish at the moment, a closer look at the technicals reveals an interesting pattern. There's a potential inverse head and shoulders forming and still in tact as mentioned in prior charts. This traditionally signals that a bullish reversal could be on the horizon. Keep an eye on price action in the coming days; we might see Ethereum start to trend upwards soonAccumulating time
TradingMula
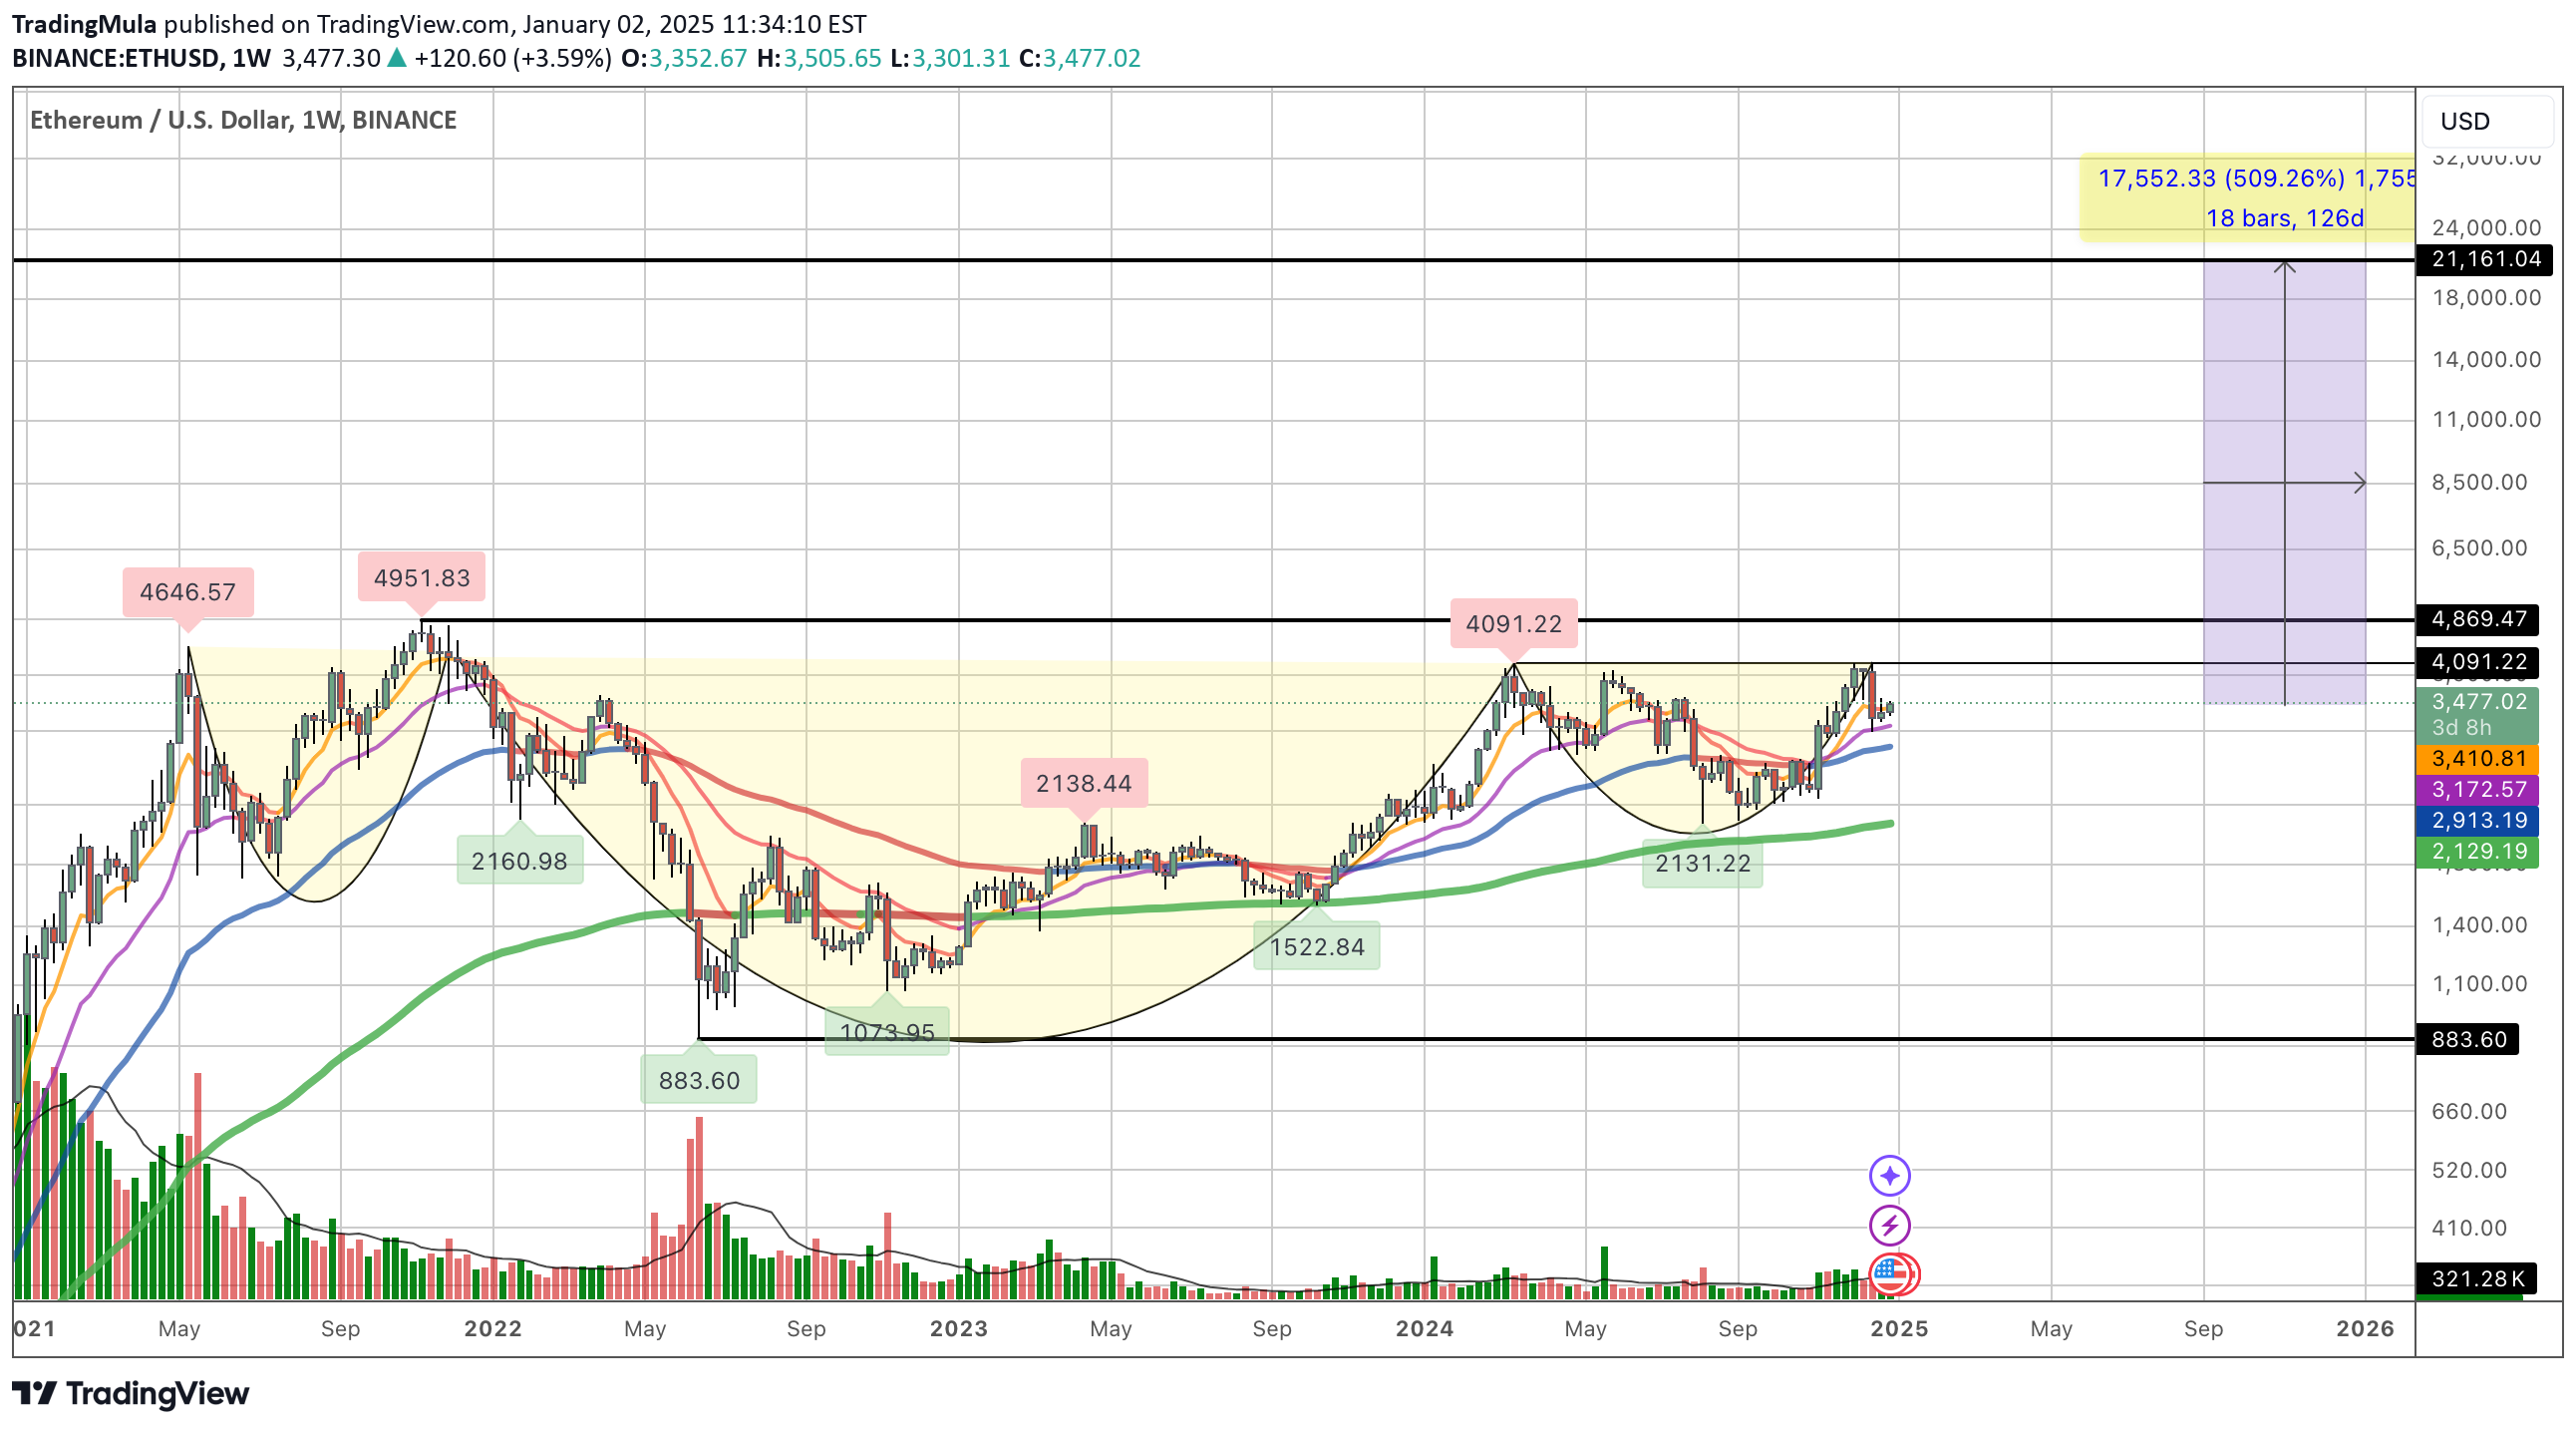
With a market cap of over $400 billion, Ethereum is poised to revolutionize the world of decentralized finance (DeFi), Real World Assets (RWA), and non-fungible tokens (NFTs). As the largest altcoin by market capitalization, Ethereum's potential for growth is immense. Technical Analysis: Bullish Inverse Head and Shoulders Pattern The Ethereum (ETH) chart is flashing a bullish signal, and it's time to take notice! A clear inverse head and shoulders pattern has formed on the daily chart, indicating a potential reversal of the downtrend. Key Points: Neckline Resistance level- $4500-5,000 Target: A breakout above the neckline could trigger a rally towards $20,000, with a potential upside of 500% Conclusion: The inverse head and shoulders pattern on Ethereum's chart is a compelling bullish signal. With a potential breakout above the neckline, Ethereum could be poised for a significant rally
TradingMula
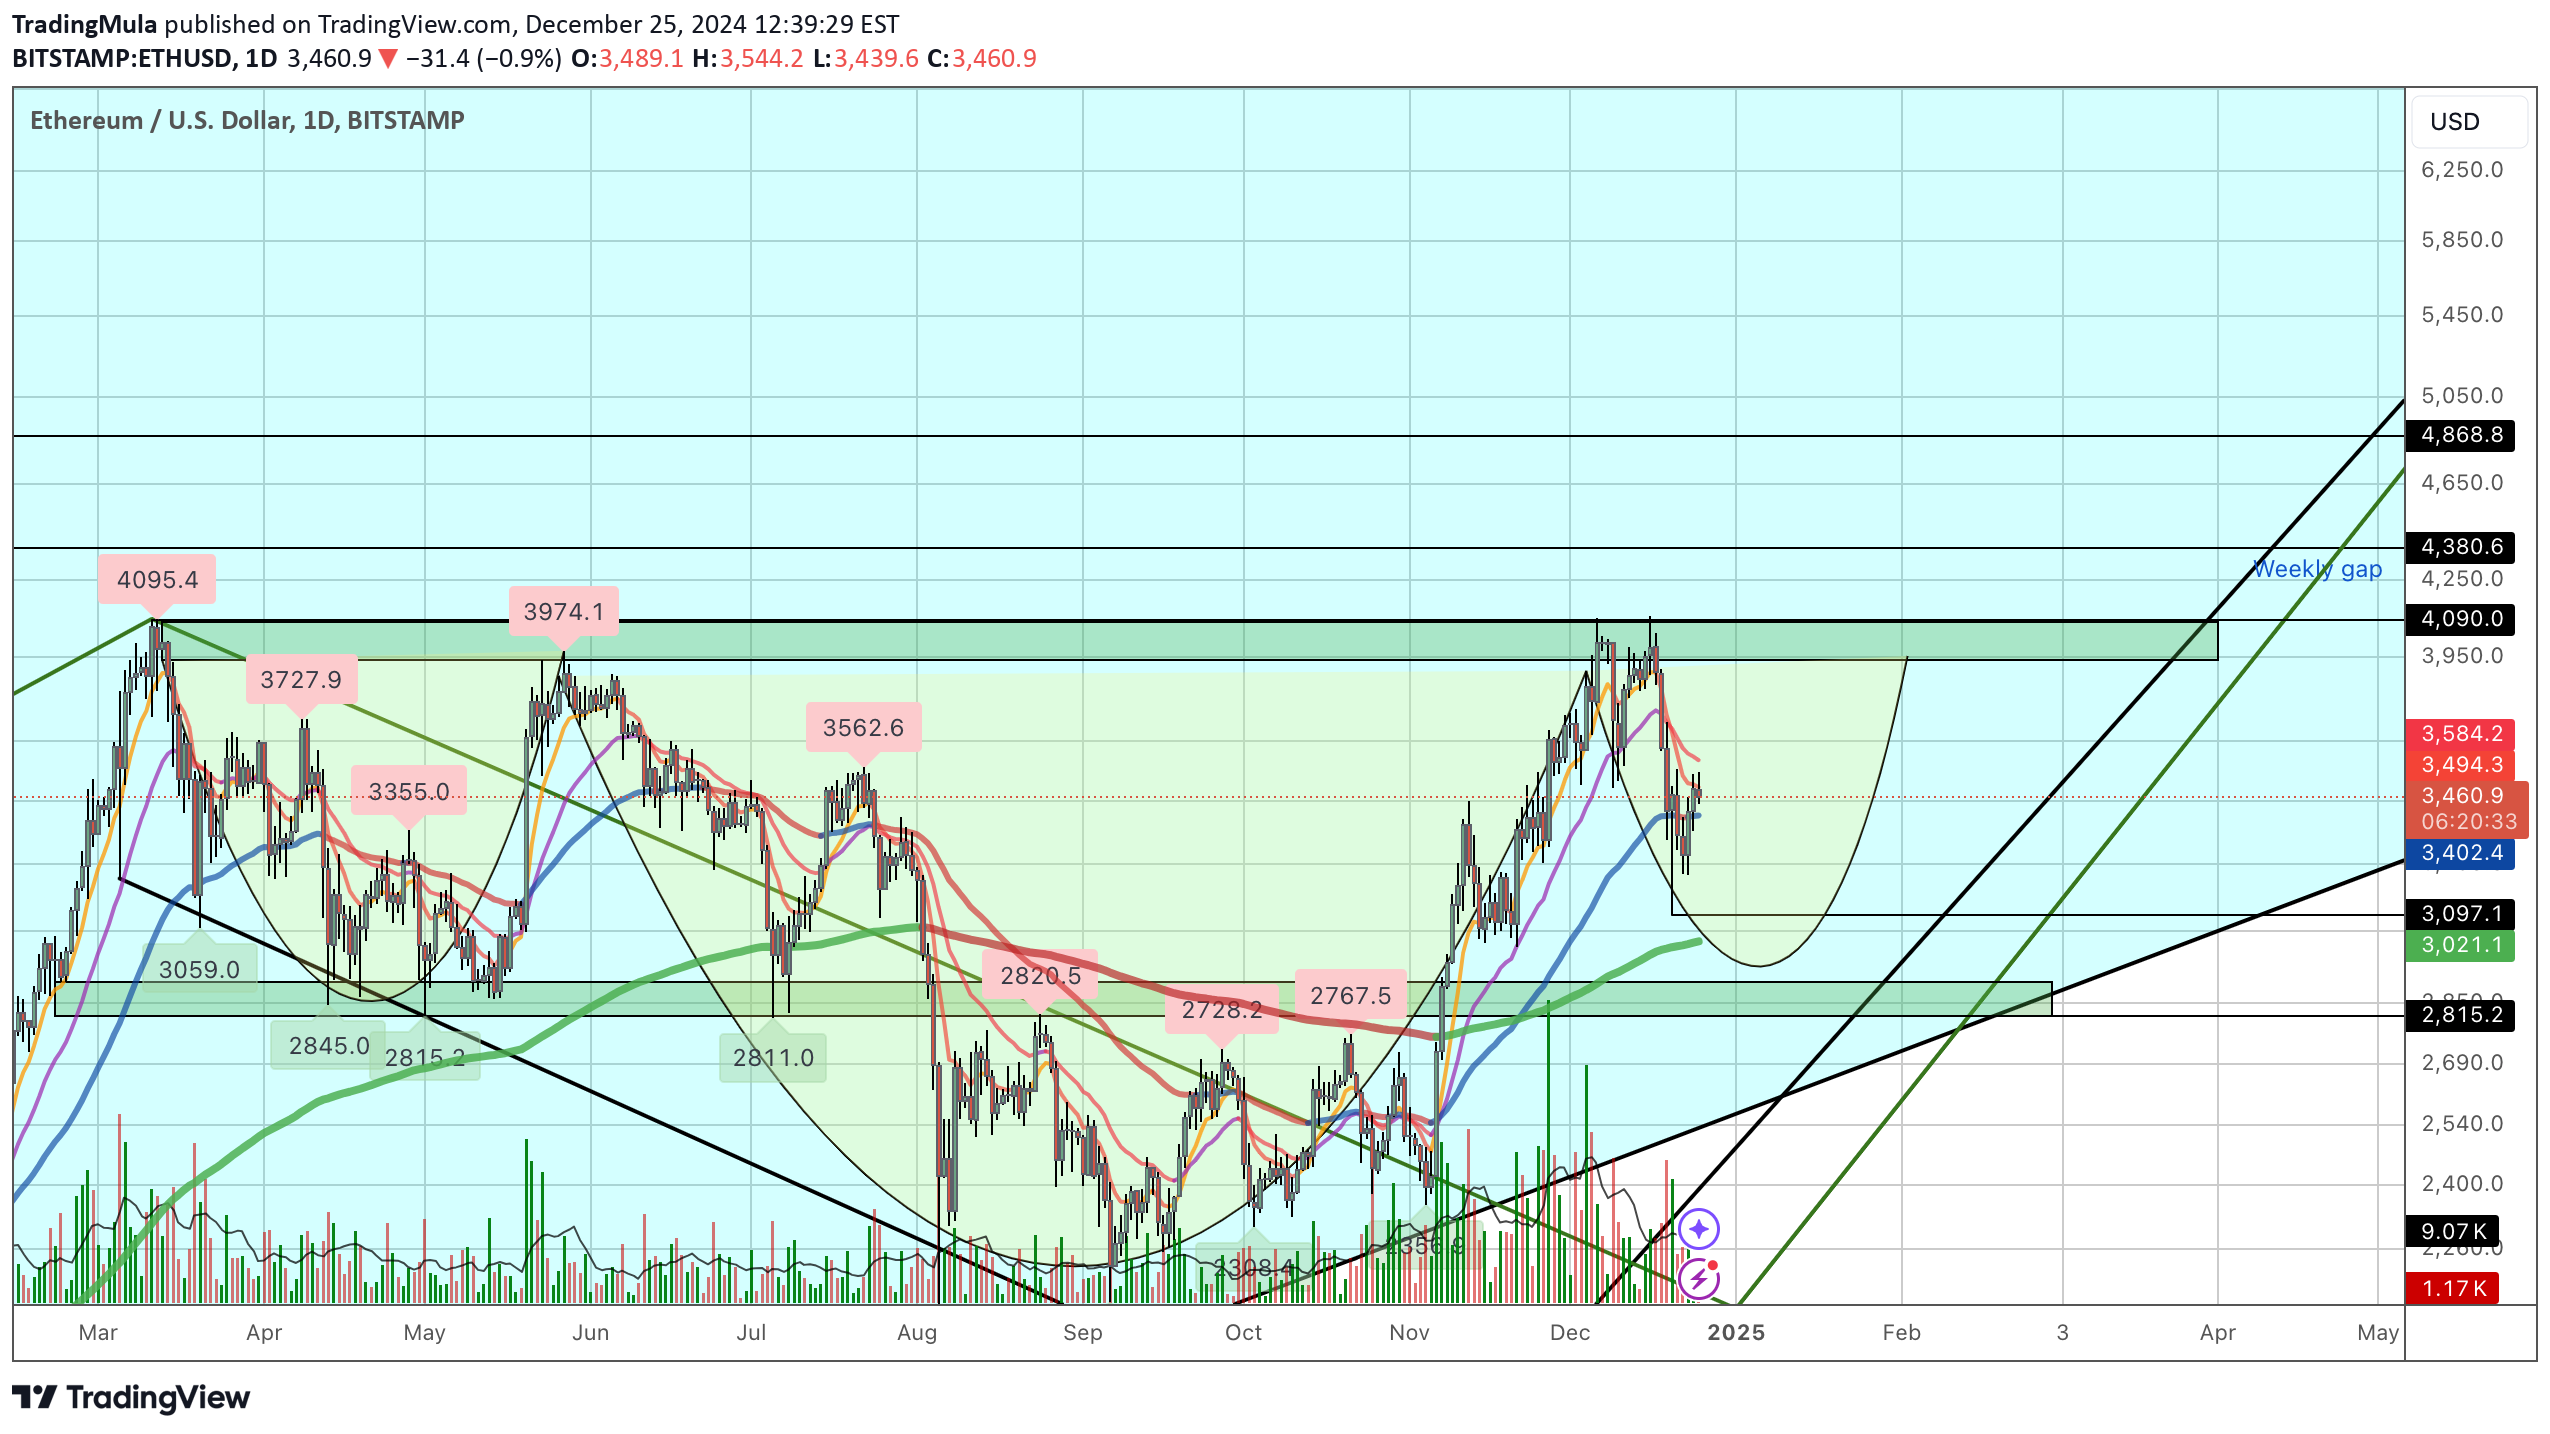
The technical analysis of Ethereum (ETH) is displaying a classic bullish inverse head and shoulders pattern. This bullish formation suggests a strong upward breakout is imminent, potentially signaling a significant price surge for ETH. Ethereum, the world's leading blockchain platform for decentralized applications (dApps), is revolutionizing industries across the globe. From DeFi to NFTs and beyond, Ethereum provides the foundation for a new era of innovation and decentralized technologies.Accumukation seen between 3250-3500 sets up possible move to 3750-4000 short term Long term a neckline break of 4K will allow new highs towards $6kNow looking ready to move towards the neckline at 4K
TradingMula
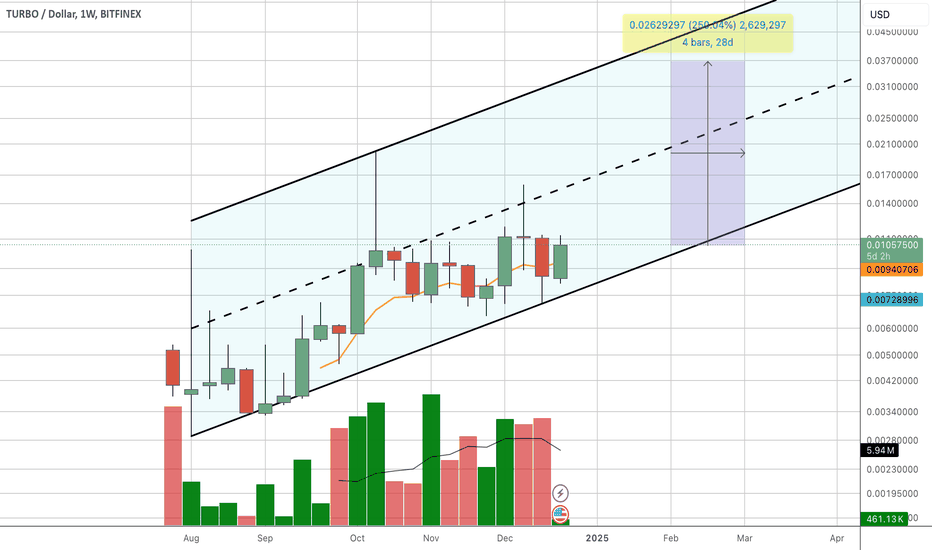
The technical analysis of Turbo's native token is signaling a bullish breakout. A classic bull flag pattern has formed on the charts, suggesting a continuation of the strong upward momentum This first ever memecoin created by AI. Turbo Token began as a bold experiment in cryptocurrency creation. Inspired by the power of artificial intelligence, the project's founder turned to GPT-4 with a simple challenge: create the next great meme coin.
Disclaimer
Any content and materials included in Sahmeto's website and official communication channels are a compilation of personal opinions and analyses and are not binding. They do not constitute any recommendation for buying, selling, entering or exiting the stock market and cryptocurrency market. Also, all news and analyses included in the website and channels are merely republished information from official and unofficial domestic and foreign sources, and it is obvious that users of the said content are responsible for following up and ensuring the authenticity and accuracy of the materials. Therefore, while disclaiming responsibility, it is declared that the responsibility for any decision-making, action, and potential profit and loss in the capital market and cryptocurrency market lies with the trader.