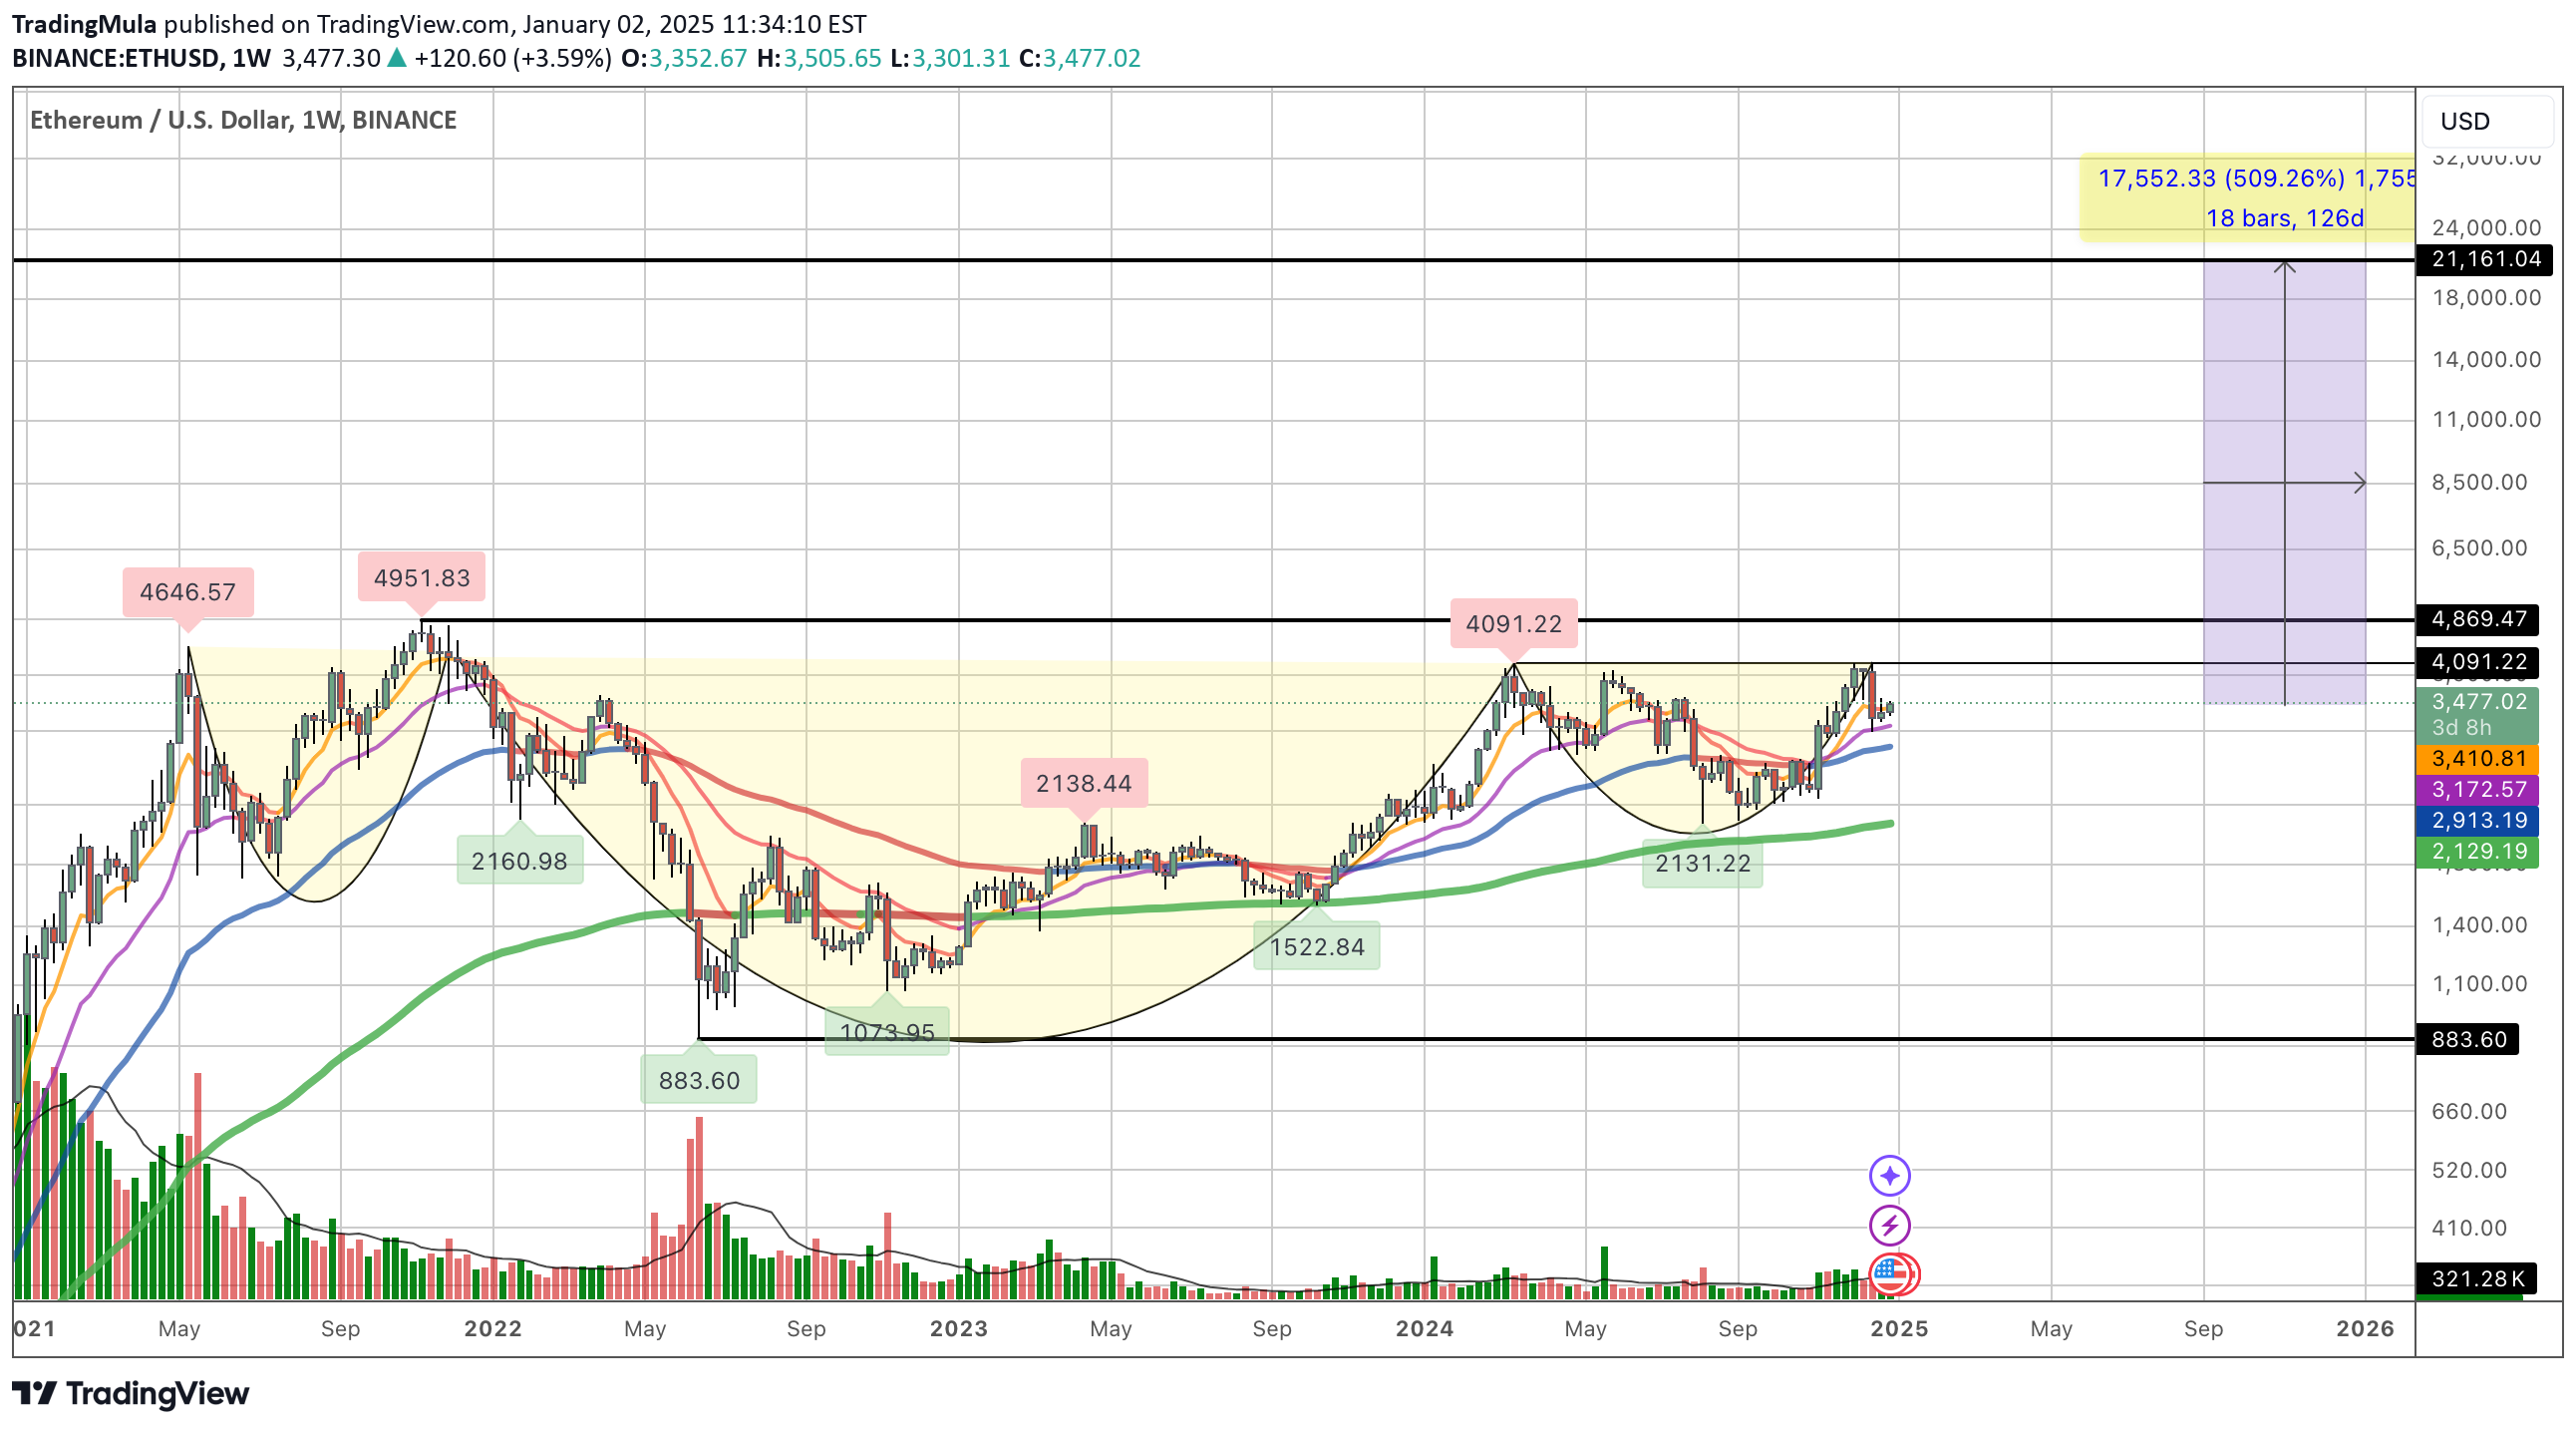
Technical analysis by TradingMula about Symbol ETH on 1/2/2025

TradingMula

With a market cap of over $400 billion, Ethereum is poised to revolutionize the world of decentralized finance (DeFi), Real World Assets (RWA), and non-fungible tokens (NFTs). As the largest altcoin by market capitalization, Ethereum's potential for growth is immense. Technical Analysis: Bullish Inverse Head and Shoulders Pattern The Ethereum (ETH) chart is flashing a bullish signal, and it's time to take notice! A clear inverse head and shoulders pattern has formed on the daily chart, indicating a potential reversal of the downtrend. Key Points: Neckline Resistance level- $4500-5,000 Target: A breakout above the neckline could trigger a rally towards $20,000, with a potential upside of 500% Conclusion: The inverse head and shoulders pattern on Ethereum's chart is a compelling bullish signal. With a potential breakout above the neckline, Ethereum could be poised for a significant rally