
Tdawly_Official
@t_Tdawly_Official

What symbols does the trader recommend buying?
Purchase History
پیام های تریدر
Filter
Tdawly_Official
تحلیل طلا: نبرد در مقاومت کلیدی و سناریوهای صعودی پیش رو
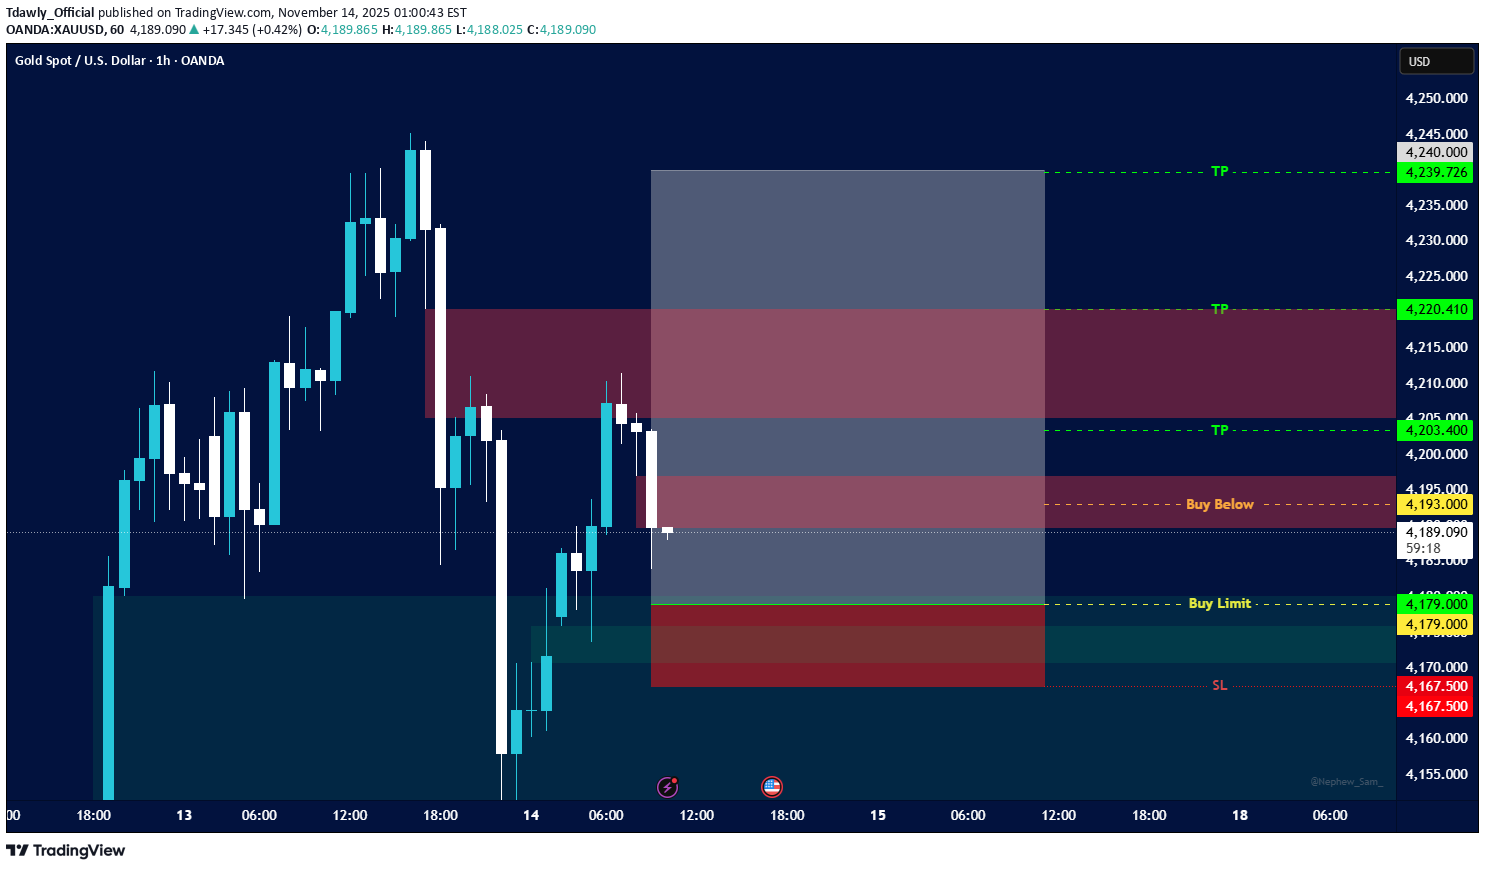
Key Changes from the Previous Chart Entry Triggered/Price Reaction: The price dropped into the support zone of the previous analysis (around 4,179.000) and has since bounced strongly. Current Status: The price is now trading significantly higher, having cleared the initial Take Profit 1 (TP1) target of 4,203.400 and is currently testing the major resistance area of the previous day's high/Take Profit 2 (TP2). New Structure: The price has now formed a clear bullish breakout from the previous consolidation area, creating a new, higher demand zone. Trade Interpretation and Next Steps The original "Buy Limit" trade (Entry 4,179.000, TP2 4,220.400) would have resulted in a significant unrealized gain. If a long position was entered at 4,179.000: The current position is in profit and should be monitored for a break of the 4,245.00 area. The stop-loss should be moved to secure profit (e.g., to the previous TP2 level of 4,220.400 or the original entry). Current Action (Waiting for New Setup): The price is consolidating right below the recent high. New Buy Scenario: Look for a sustained, strong candle close above 4,245.00 to signal a breakout continuation towards the next major resistance (mentioned in news as 4,252 or 4,300). Sell/Correction Scenario: If the price rejects the high (4,245.00) and breaks back below 4,220.400 (previous TP2/current support), it may lead to a deeper retracement toward the 4,203.400 level. The overall sentiment is bullish, but the immediate price action suggests a battle at the $4,240 - $4,245 resistance zone before the next significant move.
Tdawly_Official
Gold Spot / U.S. Dollar Analysis (15-Minute Chart)
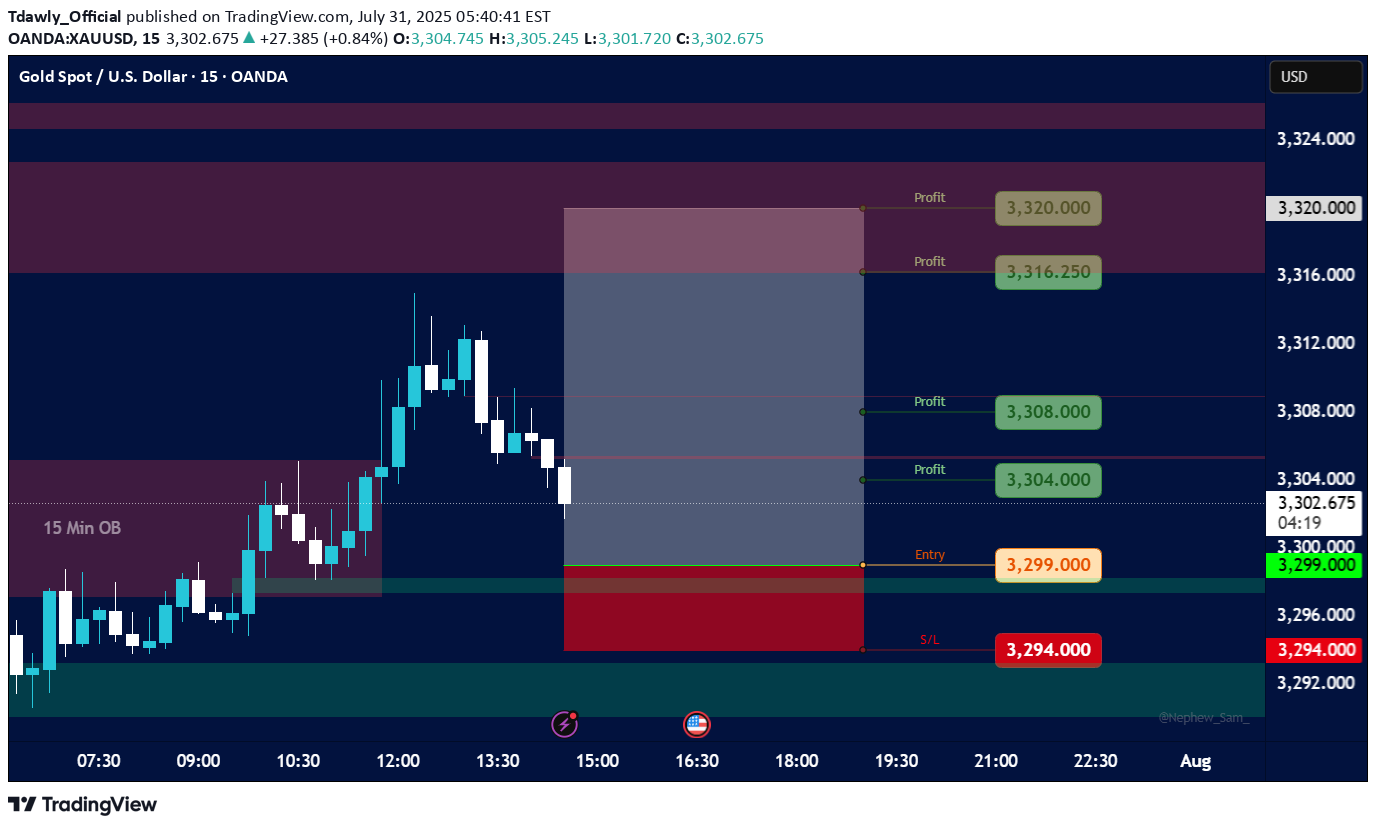
Key Levels Support Levels: Immediate: 3,294.000 (S/L level) Next: 3,280.000 Resistance Levels: Immediate: 3,304.000 (Entry level) Next: 3,308.000, 3,316.250, 3,320.000 Profit Targets: Tiered levels up to 3,328.000 (highest target). Price Action & Trends Current Trend: The price is bullish (+0.84% today) but hovering near the entry level (3,299.000) and testing 3,302.700. The presence of multiple profit targets above suggests a bullish bias in the trade setup. Critical Observations: Price recently dipped to 3,294.000 (S/L) but rebounded, indicating buying interest at support. The 3,304.000 level (entry) now acts as resistance. A breakout above could target 3,308.000+. Volume & Momentum: Not visible in the screenshot, but the upward movement suggests moderate bullish momentum. Trade Setup Analysis Entry: 3,299.000 Stop-Loss: 3,294.000 (5 USD below entry) Profit Targets: 3,304.000 (Breakeven+) 3,308.000 → 3,328.000 (Scalping opportunities). Risk-Reward Ratio: If targeting 3,328.000, the RR is ~5:1 (29 USD profit vs. 5 USD risk). Actionable Insights Bullish Scenario: Hold if price sustains above 3,304.000 (entry resistance). Next target: 3,308.000. Bearish Caution: If price falls below 3,294.000 (S/L), exit to limit losses. Watch for rejection at 3,304.000 (potential reversal). Market Context: Gold is sensitive to USD strength and geopolitical events. Monitor broader trends for confirmation.
Tdawly_Official
15-minute timeframe for XAU/USD
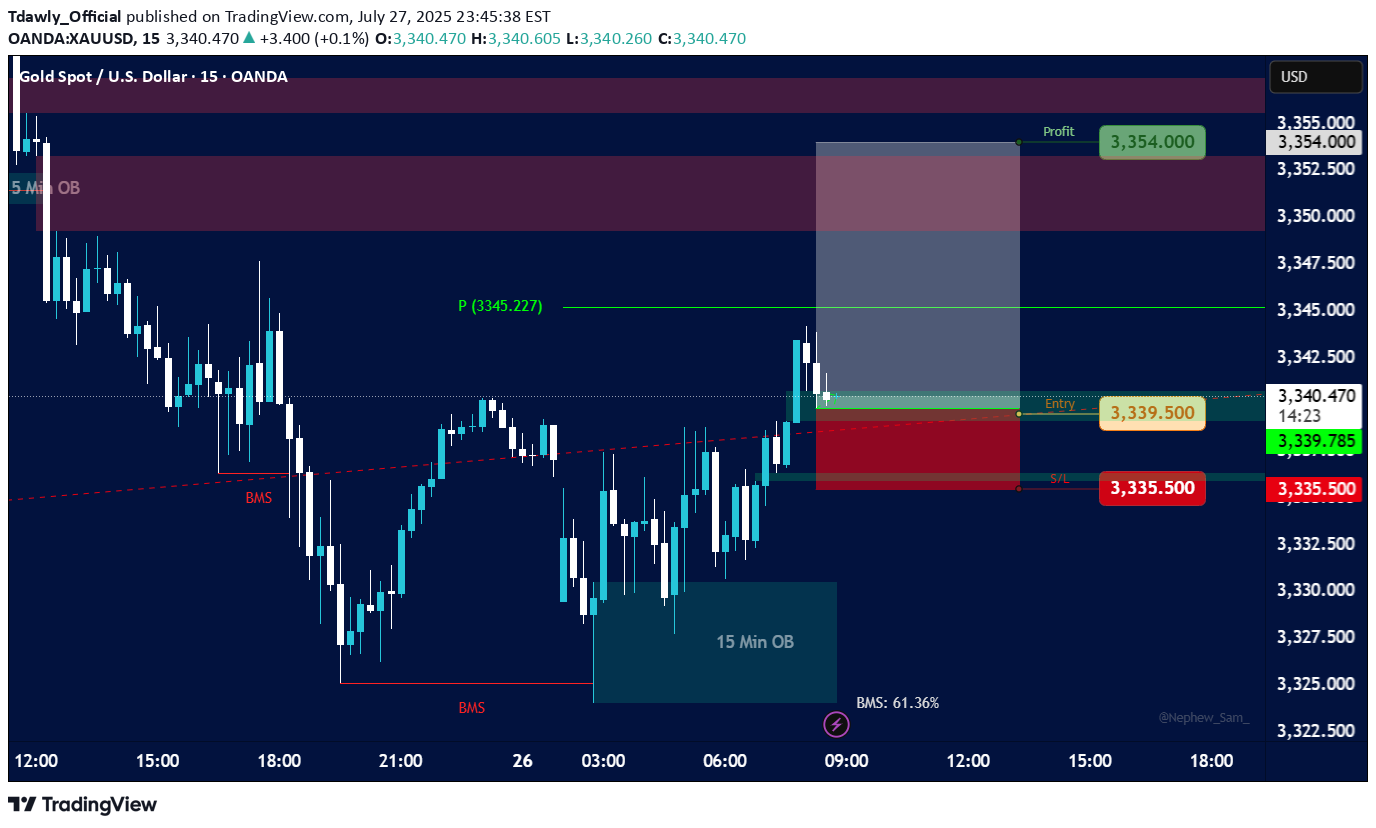
Key Elements and Observations: Price Action: The price initially shows a downtrend, breaking below a previous low, indicated by "BMS" (likely "Break in Market Structure" or "Break of Market Structure"). Following the break, the price consolidates and then shows a strong upward movement, breaking above a resistance level, again marked by "BMS." This suggests a potential shift in momentum from bearish to bullish. Order Blocks (OB): 5 Min OB (Blue Box, Top Left): There's a "5 Min OB" marked at a higher price level earlier in the chart. This represents a bearish order block, where significant selling pressure was previously observed. 15 Min OB (Teal Box, Bottom Right): A "15 Min OB" is identified at a lower price level (around 3326.00 - 3330.00). This is likely a bullish order block, indicating an area where institutions or large players placed buy orders, leading to a bounce in price. Break in Market Structure (BMS): Two "BMS" labels are visible: The first BMS (red dashed line below 3330.00) indicates a break of a support level during the downtrend. The second BMS (red dashed line above 3330.00) indicates a break of a resistance level during the subsequent uptrend, confirming a potential shift in market bias to bullish. Entry, Stop Loss, and Take Profit (Trade Setup): Entry (Green Line): The suggested entry point for a long (buy) position is at approximately 3339.50. This entry aligns with a retest of a previous resistance level that has now turned into support, or potentially the lower boundary of a small bullish order block or fair value gap. Stop Loss (Red Line/Red Box): The stop loss is set at 3335.50. This is placed below a recent low or significant support level, specifically within a red-shaded area that likely represents a "Supply/Demand" zone or an area where the trade would be invalidated. Take Profit (Green Line/Green Box): The take profit target is 3354.00, resulting in a "Profit" of 3354.00. This target is placed at a significant resistance level or an area where price might reverse. The white shaded box above the entry, extending to the take profit, highlights the potential profit zone. Risk-Reward Ratio: While not explicitly calculated, the visual representation suggests a favorable risk-reward, with the potential profit (green box) appearing larger than the potential loss (red box). Pivot Point (P): A "P (3345.227)" is marked on the chart, likely indicating a pivot point, which can act as a dynamic support or resistance level. The current price is trading above this pivot point, further supporting a bullish bias. "BMS: 61.36%" (Bottom Right): This percentage likely refers to a "Break in Market Structure" metric or a specific trading indicator that quantifies the strength or probability of the market structure shift. 61.36% suggests a reasonably strong confirmation. Implied Trading Strategy: The chart depicts a bullish reversal strategy, likely based on "Smart Money Concepts" or "ICT" (Inner Circle Trader) principles. The strategy involves: Identifying a shift in market structure: Price breaking highs after breaking lows, signaling a change from bearish to bullish. Utilizing Order Blocks: Using the 15 Min OB as a foundational support level and potentially looking for entry confirmations around it. Waiting for a Retest/Pullback: The entry around 3339.50 suggests waiting for a pullback after the initial bullish impulse. This could be a retest of a broken resistance level, a fair value gap (FVG), or a small bullish order block within the larger 15 Min OB. Placing Stop Loss Strategically: Below a significant low or invalidation point. Targeting Previous Highs/Resistance: Setting the take profit at a logical resistance level where previous selling pressure was observed.enter again same current price : 3336 with stop lose 3334.50try to close at entry
Tdawly_Official
Gold Spot / U.S. Dollar (XAU/USD) with a 1-hour timeframe
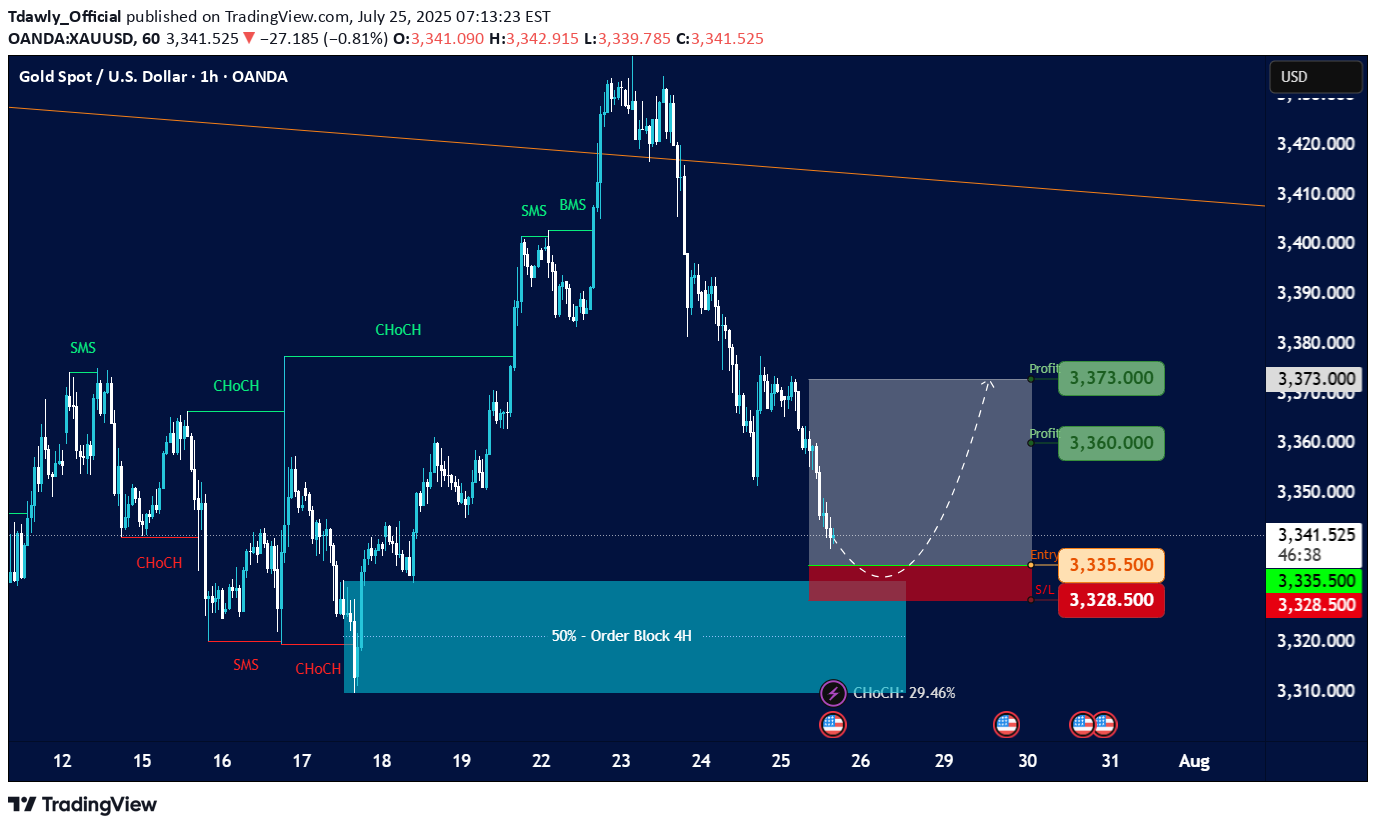
Overall Trend and Market Structure: The chart displays a mix of bullish and bearish movements, but recent price action (from around July 23rd onwards) shows a significant downturn after a peak. There are "SMS" (Structural Market Shift) and "ChoCH" (Change of Character) labels, indicating shifts in market structure. Initially, there were bullish shifts, but the recent price action suggests a potential bearish shift or at least a significant retracement. A large "50% - Order Block 4H" is highlighted in blue, which acted as support and led to a strong upward move previously. Current Price Action and Setup: The current price is around 3,340.670. There's a proposed short-term trading setup, indicated by: Entry: 3,335.500 (red dashed line) Stop Loss (SL): 3,328.500 (red shaded area) Profit Targets (TP): 3,360.000 (green shaded area, "Profit 3,360.000") 3,373.000 (green shaded area, "Profit 3,373.000") The setup is highlighted with a gray shaded area, indicating the potential path of price for this trade. It appears to be a long (buy) setup, anticipating a bounce from the current levels. The "CHOCM: 29.46%" at the bottom suggests some kind of indicator or calculation related to market character. Key Observations and Considerations: Previous Bullish Momentum: The price rallied strongly after touching the "50% - Order Block 4H" around July 17-18, reaching a high near 3,430. Recent Bearish Retracement: Since July 23rd, the price has pulled back significantly from its peak, almost revisiting the higher levels of the previous order block. Potential Support: The proposed entry point for the long trade (3,335.500) is within a zone that previously acted as support or a level from which price bounced. It's also near the top of the "50% - Order Block 4H" area, suggesting this could be a retest or a bounce from a key support zone. Risk-Reward: The setup shows a relatively tight stop loss compared to the potential profit targets, which is generally favorable for risk management.price will touch the entry soon - High risky trade
Tdawly_Official
Fetch.AI (FET) against TetherUS (USDT)
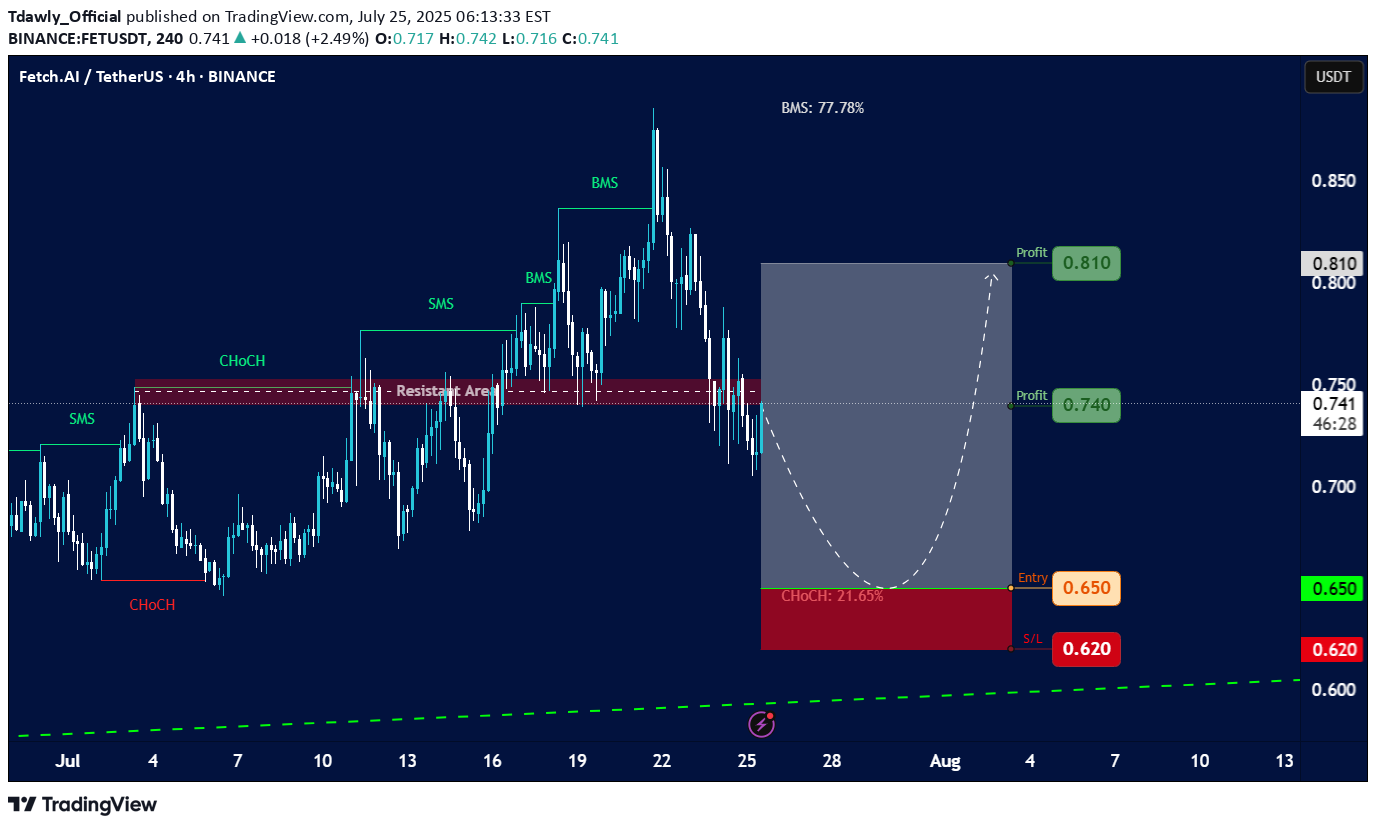
Chart Overview: Asset: Fetch.AI (FET) against TetherUS (USDT). Timeframe: 4-hour (4h) candles. Current Price (approximate based on chart): Around 0.741 USDT. Date and Time on Chart: July 25, 2025, 15:11 UTC+4 (This matches the current provided time context, so the chart is very recent). Overall Trend: The chart shows a recent upward movement followed by a retracement. There are clear indications of "SMS" (Structural Market Shift) and "BMS" (Break in Market Structure) bullish movements, indicating an uptrend was in play. Key Technical Observations and Labels: "ChoCH" (Change of Character): Initial Bullish ChoCH (early July): An initial "ChoCH" is marked early July, signaling a potential shift from bearish to bullish sentiment. "SMS" (Structural Market Shift) & "BMS" (Break in Market Structure): Several "SMS" and "BMS" points are identified, suggesting consecutive higher highs and higher lows, confirming an uptrend. The "BMS: 77.78%" label might refer to the percentage gain from a previous low to a recent high, or a percentage of the total movement. "Resistant Area": A significant horizontal red dashed line labeled "Resistant Area" is present around the 0.74-0.76 USDT level. This area previously acted as resistance, and the price is currently retesting or struggling with it. Current Price Action: The price has recently come down significantly from a peak around 0.88 USDT, retesting the "Resistant Area." It appears to have broken below some immediate support levels. Proposed Trade Setup (Green Box & Red Box): Entry (Green Line): 0.650 USDT. This is positioned below the current price, suggesting a "buy the dip" strategy. Stop Loss (Red Line): 0.620 USDT. This is a tight stop loss, indicating a risk management level if the price drops further. Profit Targets (Green Boxes): Profit 1: 0.740 USDT (already very close to the current price, potentially hit or missed depending on execution). Profit 2: 0.810 USDT. "ChoCH: 21.65%" (near entry zone): This likely indicates the percentage retracement from the peak to the proposed entry zone, suggesting it's a significant pullback. Projected Path (Dashed White Line): The curved dashed line shows an anticipated price movement: a dip down to the 0.650 entry zone, followed by a bounce back up towards the profit targets. Analysis of the Proposed Trade: Risk-Reward: Risk: From 0.650 (Entry) to 0.620 (S/L) = 0.030 USDT risk. Reward 1: From 0.650 (Entry) to 0.740 (Profit 1) = 0.090 USDT reward. (Ratio: 3:1) Reward 2: From 0.650 (Entry) to 0.810 (Profit 2) = 0.160 USDT reward. (Ratio: approx. 5.3:1) The risk-reward ratio appears favorable for this proposed trade. Logic: The setup seems to be based on the idea of a significant retracement (pullback) to a key support level (the proposed 0.650 entry, potentially an order block or demand zone not explicitly marked but implied by the "ChoCH: 21.65%" label in that area) after a strong bullish run. The "Resistant Area" at 0.74-0.76 becomes the first target as the price would need to break back above it. Considerations and Potential Risks: Validity of Support: The effectiveness of the 0.650 level as strong support is crucial. If it breaks, the price could fall further. Market Structure Shift (again): While the uptrend had strong "BMS" signals, the current deeper retracement could lead to a bearish "ChoCH" on a higher timeframe if the 0.650 support fails. Liquidity: Ensure sufficient liquidity at the proposed entry and exit points, especially with a tighter stop loss. Overall Market Conditions: The performance of Bitcoin (BTC) and the broader crypto market will significantly influence FET's price action. Volume: The chart doesn't show volume indicators, which would provide additional insight into the strength of price movements.
Tdawly_Official
Bitcoin/TetherUS (BTC/USDT) on a 4-hour timeframe
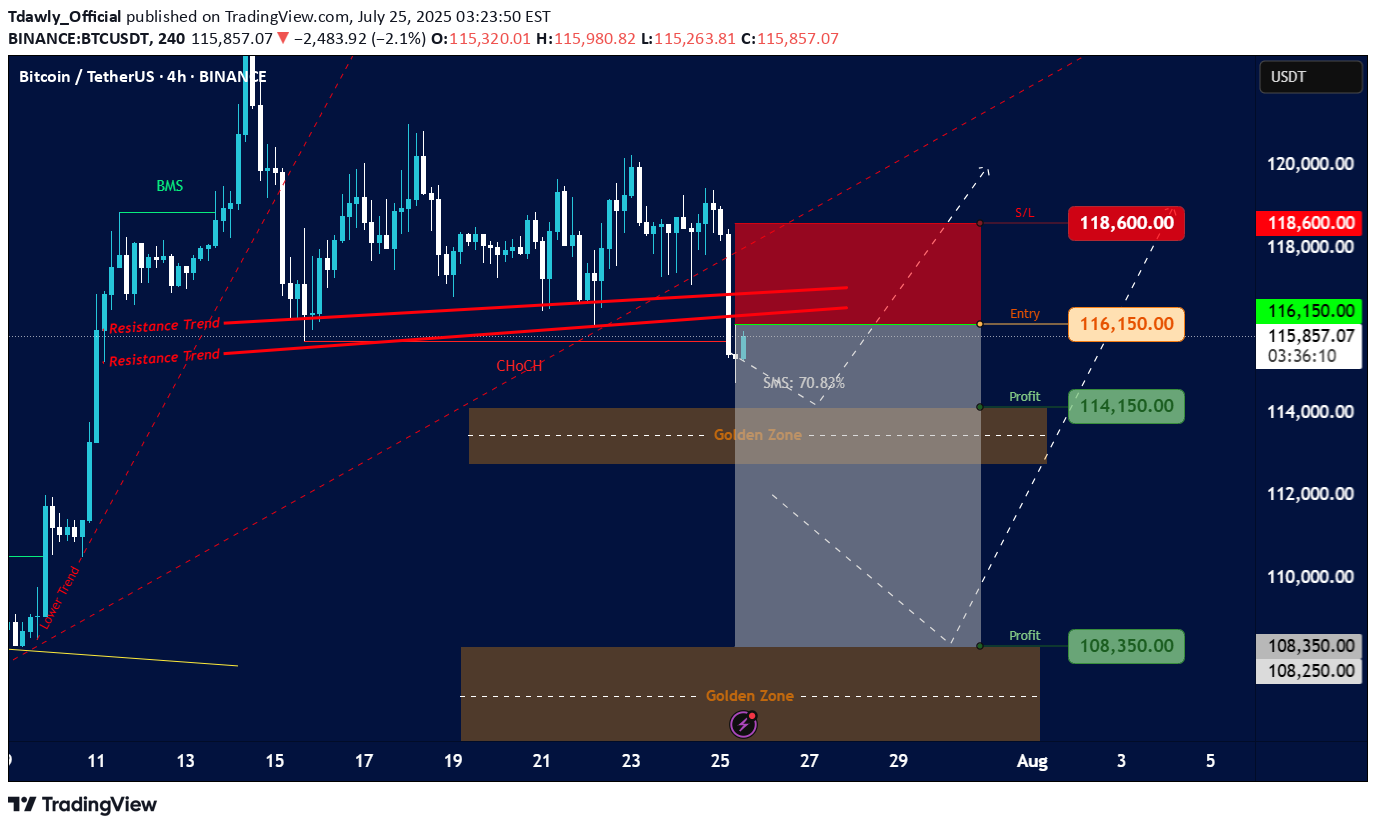
Overall Trend & Price Action: Prior Uptrend: The chart shows a clear uptrend leading up to around July 15th, marked by an "Order Trend" line (dashed green). Break of Market Structure (BMS): A "BMS" (Break of Market Structure) label is visible, suggesting a significant shift in market dynamics, likely indicating the end of the previous uptrend or a strong pullback. Consolidation/Distribution: After the initial uptrend, the price appears to have entered a period of consolidation or potential distribution between approximately $115,000 and $120,000. Resistance Trends: Several "Resistance Trend" lines (red) are drawn, indicating areas where the price has faced selling pressure. A recent breakdown below these resistance lines is evident. Change of Character (ChoCH): A "ChoCH" label is present, which often signifies a change in the prevailing market sentiment or trend, confirming the shift away from the strong bullish momentum. Current Price & Trading Setup: Current Price: The current price is around $115,849.44. Proposed Entry: The chart suggests an "Entry" point at $116,150.00. This is positioned just above the current price and within a potential retest zone of the broken resistance. Stop Loss (S/L): The "S/L" is set at $118,600.00, indicating a risk management level if the trade goes against the intended direction. Profit Targets (Profit): First Profit Target: $114,150.00, located just above the first "Golden Zone." Second Profit Target: $108,350.00, situated within the second "Golden Zone." Golden Zones: Two "Golden Zones" (brown shaded areas) are identified, which are typically areas of significant support/demand or Fibonacci retracement levels where price is expected to react. The current setup seems to target these zones for profit-taking. SMS: 70.83%: This "SMS" value (likely referring to "Smart Money Score" or a similar metric) of 70.83% suggests a strong bearish bias or conviction in the current setup. Interpretation & Potential Strategy: The analysis suggests a bearish trading setup for BTC/USDT. The presence of BMS, ChoCH, and the breakdown below resistance trends indicate a potential shift from bullish to bearish sentiment or a significant correction. The proposed short entry at $116,150.00 aims to capitalize on further downward movement. The profit targets align with identified "Golden Zones," suggesting that these are anticipated areas of support where the bearish momentum might temporarily stall or reverse. The significant "SMS" value reinforces the bearish outlook. Risks & Considerations: Reversal from Golden Zones: While profit targets are set at Golden Zones, these are also potential areas for price reversals if strong buying interest emerges. False Breakout/Breakdown: The market can always surprise, and a re-entry above the stop-loss level would invalidate the current bearish setup. Market Volatility: Cryptocurrency markets are highly volatile, and rapid price movements can occur. News Events: Unforeseen news or macroeconomic events could significantly impact price action.
Tdawly_Official
Gold Spot / U.S. Dollar - 1h on TradingView, dated July 25, 202
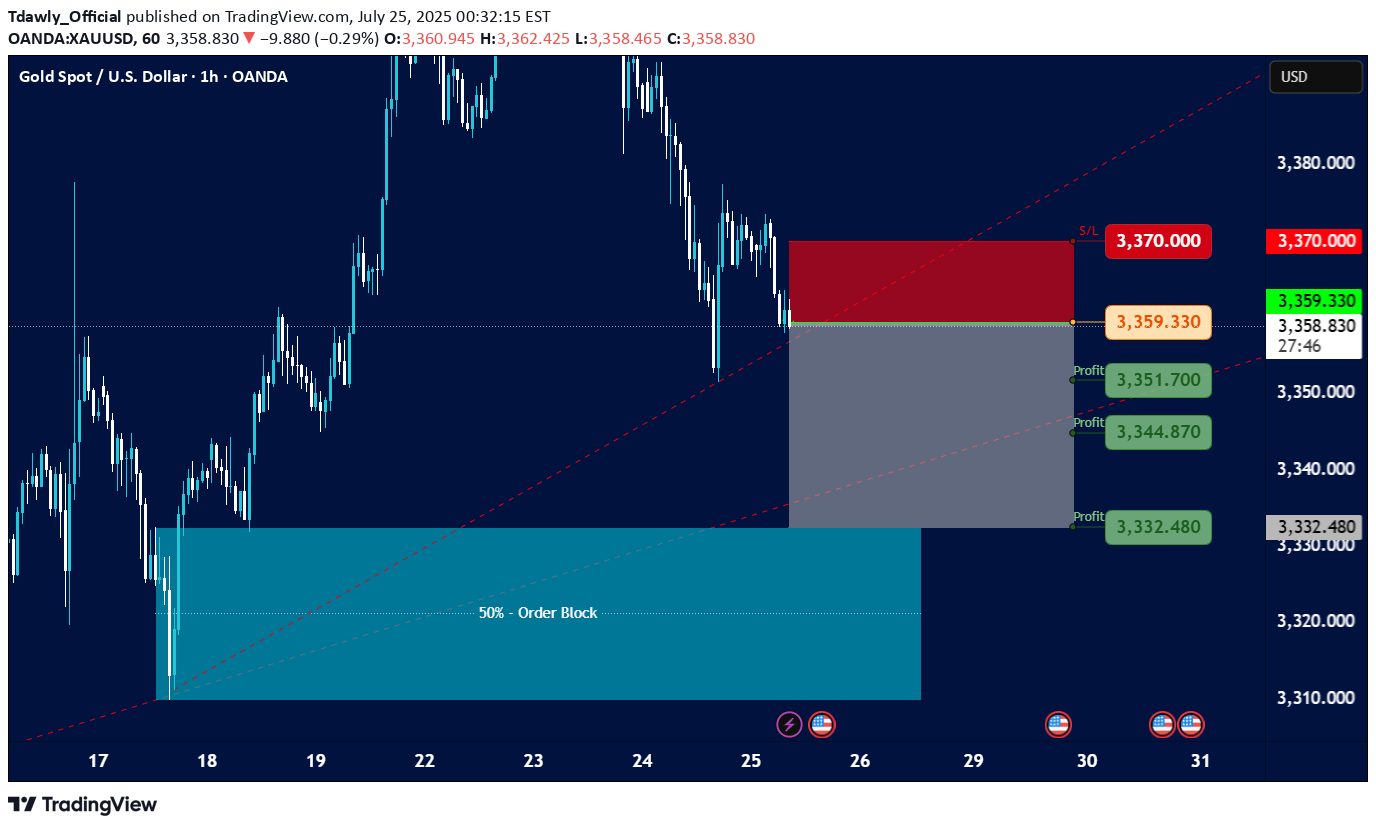
Current Price and Trend: The current price is shown as 3,359.330, and the last traded price is 3,359.005. The chart indicates a downtrend in recent sessions, with the price having fallen significantly from higher levels around 3,380.000 to 3,390.000 down to the current levels. There's a dashed red line (possibly a trendline or resistance) indicating a downward slope. Key Zones and Levels Identified: Resistance/Stop Loss Zone (Red Rectangle): This zone is marked from approximately 3,365.000 up to 3,370.000. A "S/L" (Stop Loss) level is explicitly marked at 3,370.000. This suggests that a short position (selling) is being considered, with a stop loss placed above this resistance. Entry Point (Grey Line): An entry point for a trade is indicated by a grey horizontal line at 3,359.330. This is very close to the current price, suggesting a potential entry for a short trade. Profit Target Zones (Grey Rectangle with Green Labels): Three "Profit" levels are identified below the entry point: 3,351.700 3,344.870 3,332.480 These levels suggest potential targets for taking profit on a short position. The grey shaded rectangle represents the area where these profit targets lie, extending downwards from the entry point. 50% - Order Block (Teal Rectangle): At the bottom left of the chart, there's a large teal-colored rectangle labeled "50% - Order Block." This typically represents an area where significant institutional buying interest (or an accumulation of orders) is expected, potentially acting as strong support. The price has previously bounced off this area. Possible Trading Strategy Implied: The setup suggests a potential short-selling strategy for Gold Spot / USD, likely based on a continuation of the downtrend or a retest of previous resistance levels. Entry: Around 3,359.330 (current price level). Stop Loss: At or above 3,370.000, to limit potential losses if the price moves against the short position. Take Profit: Phased profit-taking at 3,351.700, 3,344.870, and 3,332.480. Target Support: The ultimate target appears to be within the "50% - Order Block" zone, suggesting the expectation of the price reaching or testing this strong support area. Considerations and Further Analysis Needed: Confirmation: The chart doesn't show any specific indicators (e.g., RSI, MACD) that might confirm the downtrend or potential entry. Volume: Volume analysis would be beneficial to assess the strength of price movements. News/Fundamentals: Any upcoming economic data or geopolitical events could significantly impact gold prices. Risk-Reward Ratio: A calculation of the risk-reward for each profit target would be useful to determine the attractiveness of the trade. Market Structure: A deeper analysis of the market structure (higher highs/lows, lower highs/lows) could provide more context.Tp1 is doneTp2 is doneyou can get the final target at 3335.50Follow this trade as long
Tdawly_Official
Gold
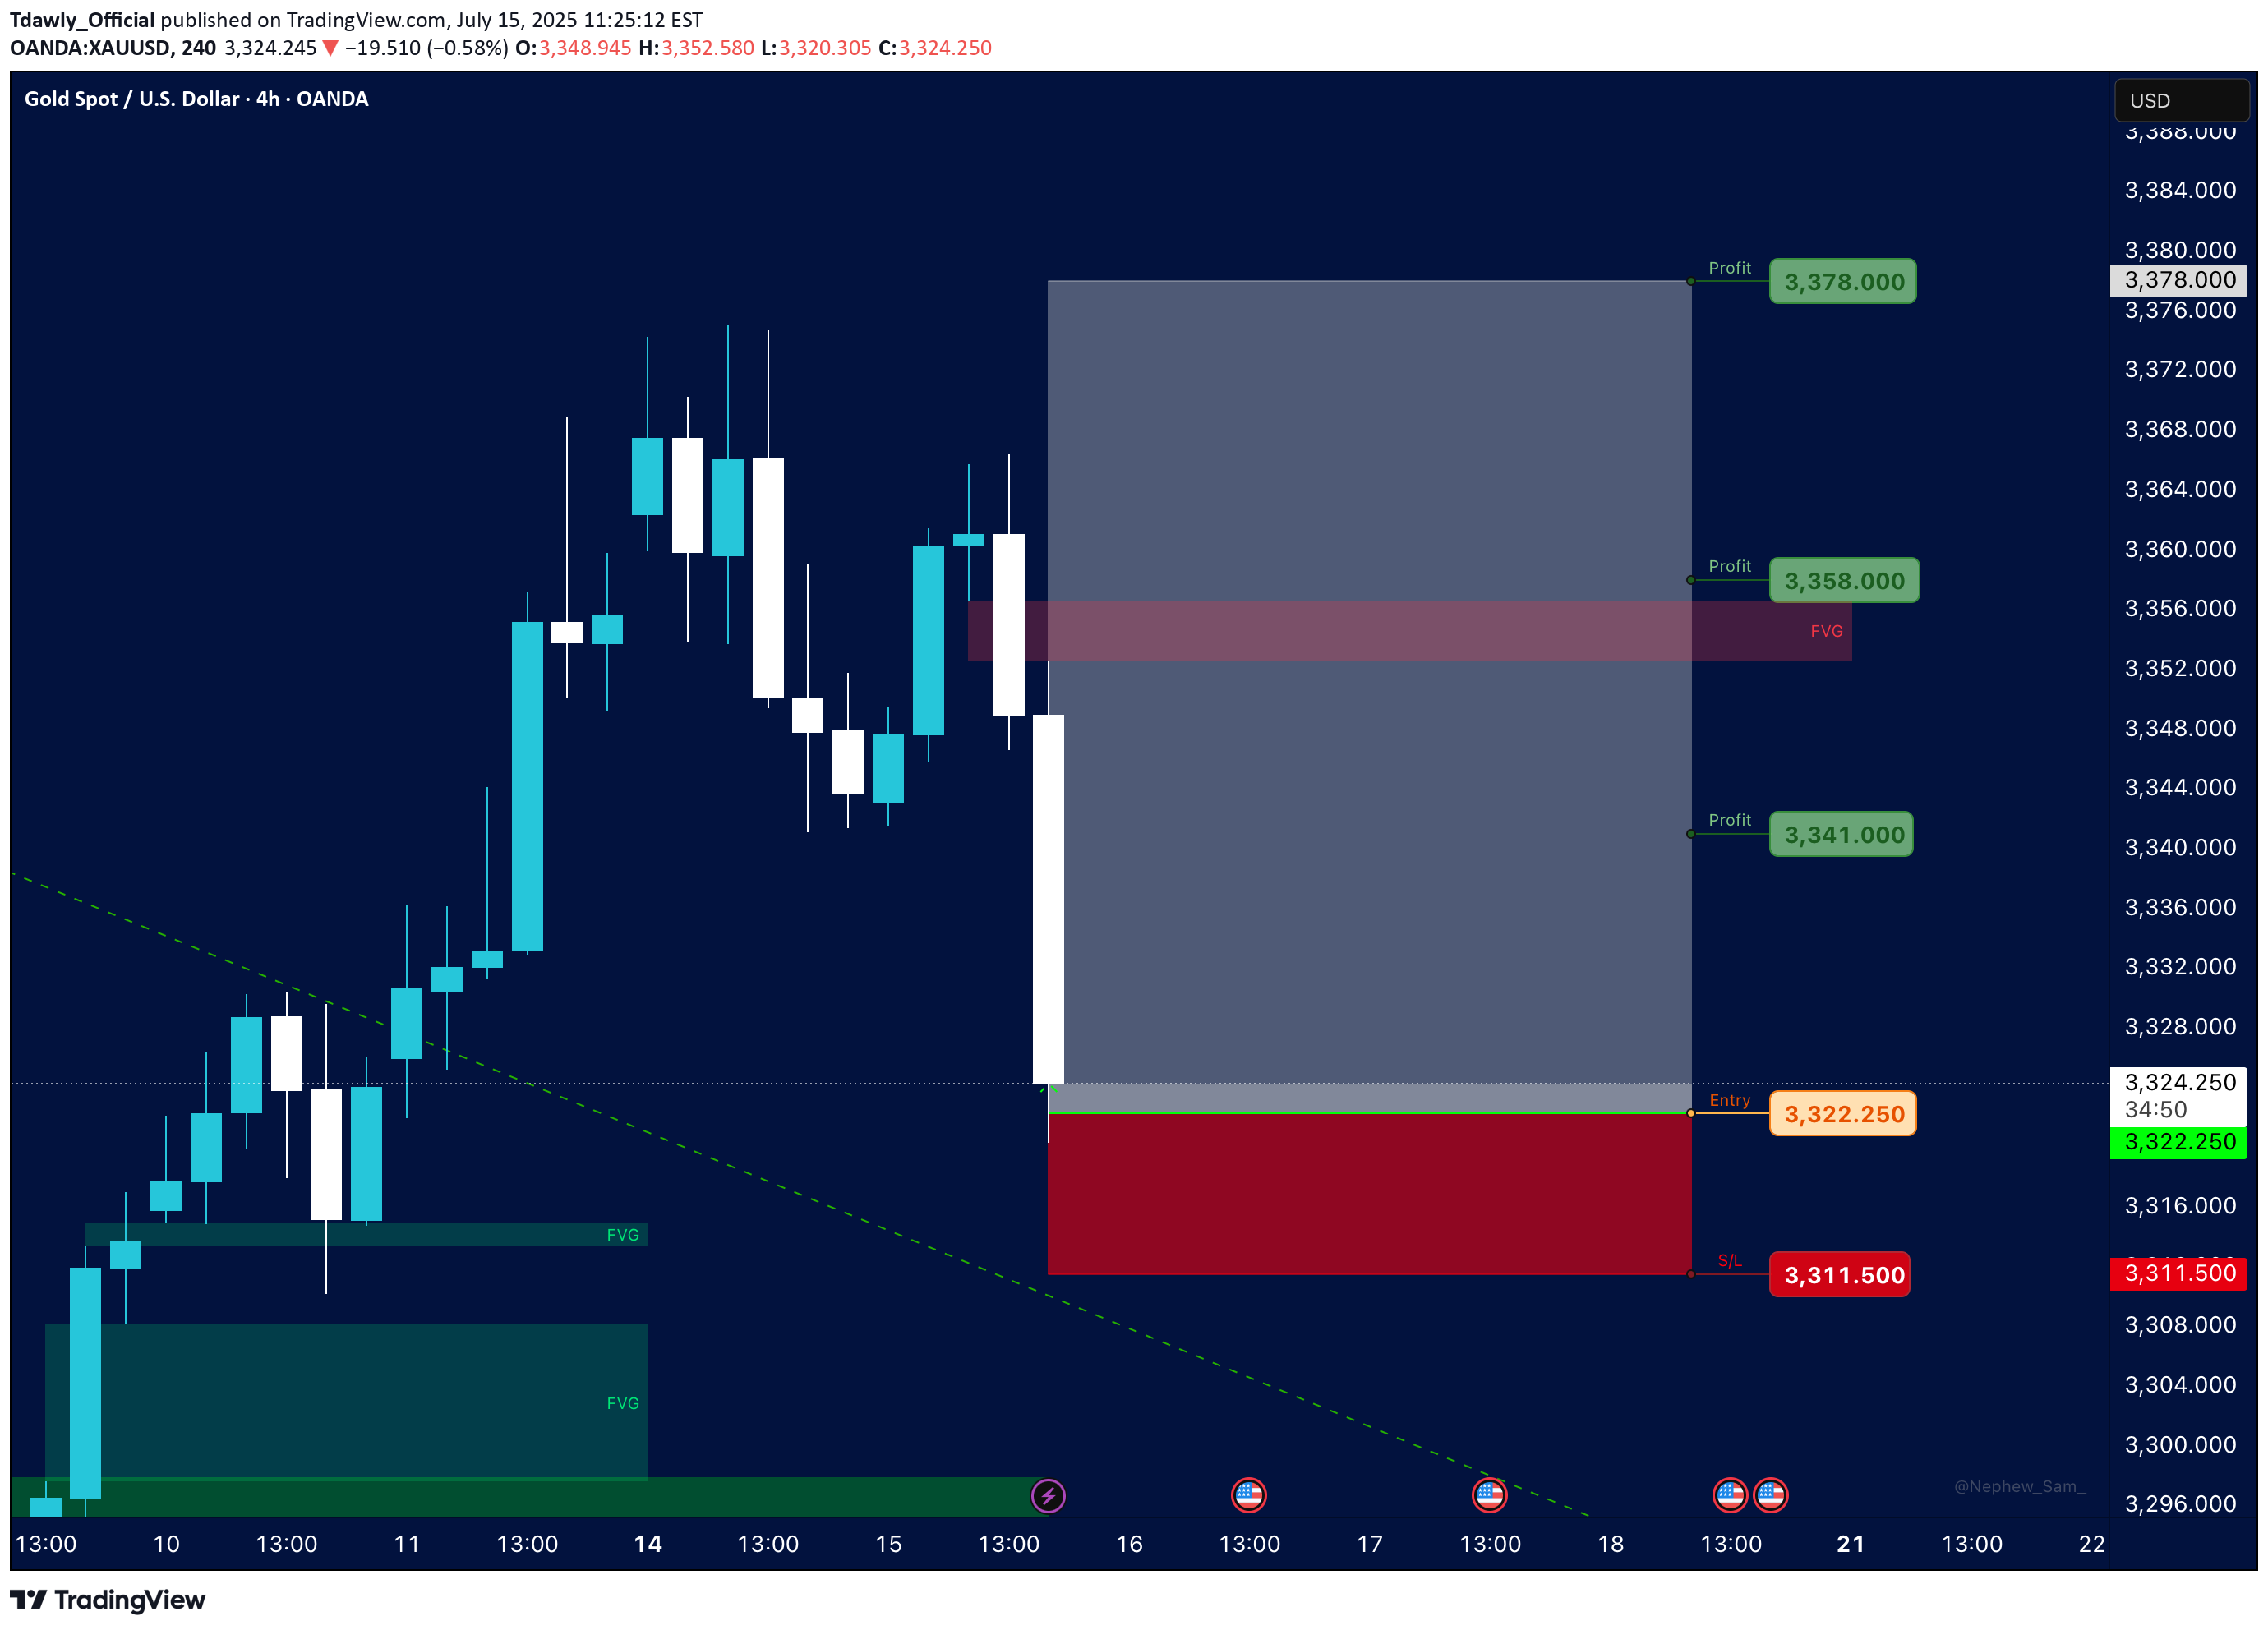
⸻ 1. Trade Setup Summary ✅ Trade Type: Long (Buy) ✅ Entry: 3,322.250 ✅ Stop Loss (SL): 3,311.500 ✅ Take Profits (TP): •TP1: 3,341.000 •TP2: 3,358.000 •TP3: 3,378.000 ⸻ 2. Chart Context Analysis 🔷 Structure: •The market had a strong bullish push before a correction phase. •Current candle is aggressively bullish from the zone near your entry, suggesting buyers are reclaiming control. 🔷 Fair Value Gaps (FVG): •There is an FVG area marked just above TP2 (around 3,358.000) indicating a price imbalance likely to be filled. •Previous unfilled FVGs below acted as strong demand zones, supporting bullish continuation. 🔷 Trendline Observation: •A dotted descending trendline was broken and price consolidated above it, suggesting a shift in market structure from bearish to bullish on lower timeframes. ⸻ 3. Risk Management •SL Placement: Below recent structural lows at 3,311.500, providing safety against liquidity sweeps while avoiding premature stop-outs. •RR Ratio: Approximately 1:2 to 1:5 if all TPs are hit, making the setup favorable. ⸻ 4. Overall Probability and Caution ✔️ Strengths: •Confluence with FVG targeting. •Strong bullish engulfing candle. •Multi-TP strategy for secured partial profits. ⚠️ Risks: •Potential rejection near TP2 due to previous supply reaction. •High volatility can cause stop-out if market seeks liquidity deeper before continuation. ⸻ 5. Conclusion This setup aligns with smart money concept-based trades focusing on: •Market structure shift •FVG imbalance fills •Clear SL protection with sequential TP levels If you want, I can: •Break this down into a daily plan for tomorrow’s session. •Integrate it with your NAS100, US30, and Forex analysis for the week. •Prepare similar structured breakdowns for your upcoming charts in your strategy refinement routine tonight.TP1 is doneall targets are done
Tdawly_Official
Bitcoin
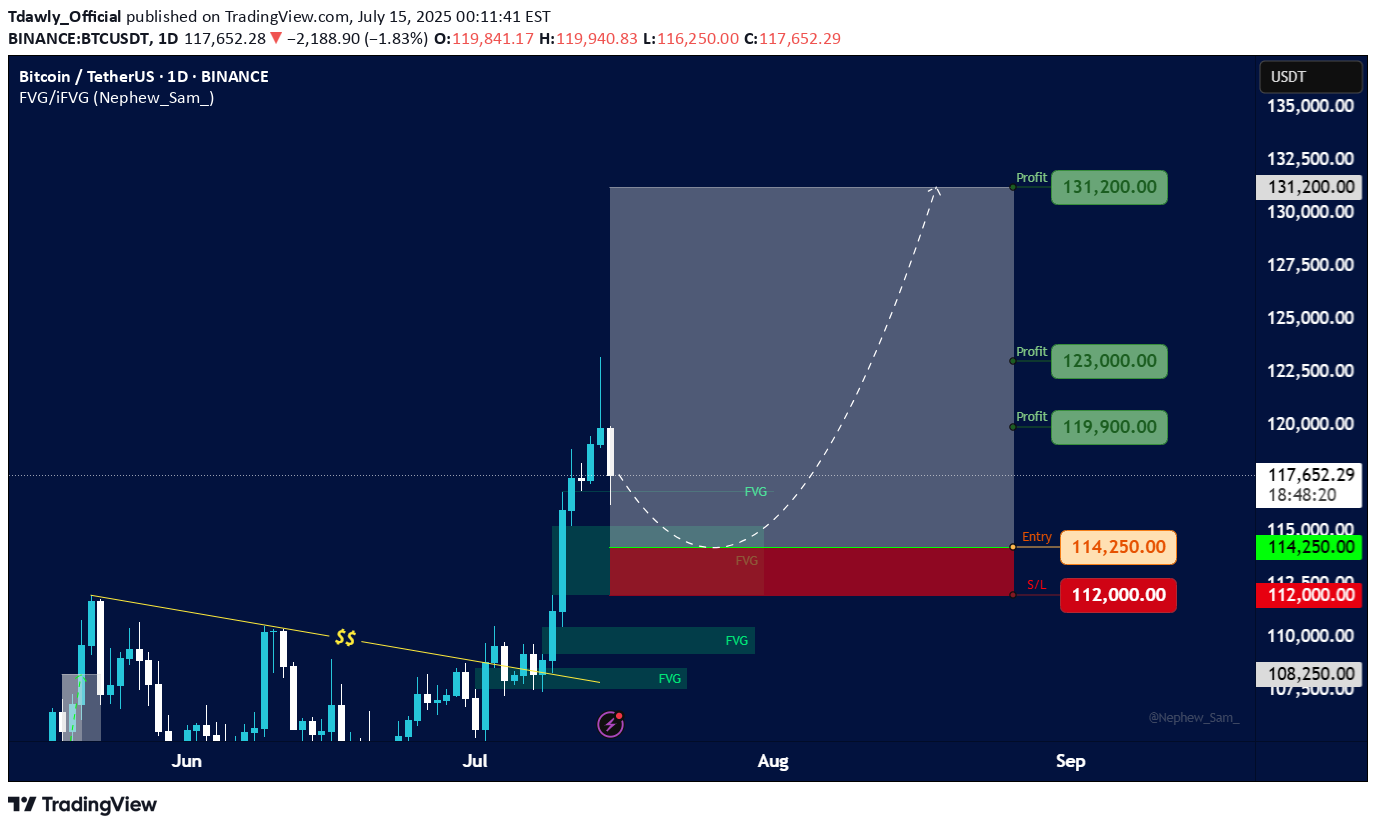
Bitcoin/TetherUS (BTC/USDT) Trading Analysis - Jul 15, 2025 Key Observations: Price Movement: Current Price: $117,692.46 24h Change: -2,148.72 (-1.79%) Range: Low of $116,250.00 to High of $119,940.83 The price is currently near the lower end of the day's range, indicating bearish pressure. Support and Resistance: Support Levels: Strong Support: $112,000.00 (marked as S/L) Intermediate Support: $113,500.00 and $110,000.00 Resistance Levels: Immediate Resistance: $119,900.00 Higher Resistance: $120,000.00 and $122,500.00 Profit Levels: The "Profit" section lists potential take-profit targets, with the highest at $135,000.00. The price has recently dipped below the $120,000.00 psychological level, suggesting weakening bullish momentum. Trend Context: The chart spans from June to September, but the current price action (July) shows consolidation after a potential pullback from higher levels. The presence of multiple support levels ($112K–$116K) suggests a critical zone for buyers to defend. Actionable Insights: Bearish Short-Term: The price is below key levels ($119,900–$120,000) and has broken below $118,250.00. A retest of support at $112,000.00 is plausible. Bullish Reversal Signal: If BTC holds above $112,000.00 and reclaims $120,000.00, it could target $122,500.00 or higher. Risk Management: A break below $112,000.00 (S/L) may trigger further downside toward $110,000.00 or lower. Conclusion: The market is currently in a corrective phase. Traders should monitor the $112,000.00 support for potential reversals or breakdowns. A close above $120,000.00 would shift bias to bullish.here we go
Tdawly_Official
Gold Spot / U.S. Dollar - 1h Analysis (OANDA)
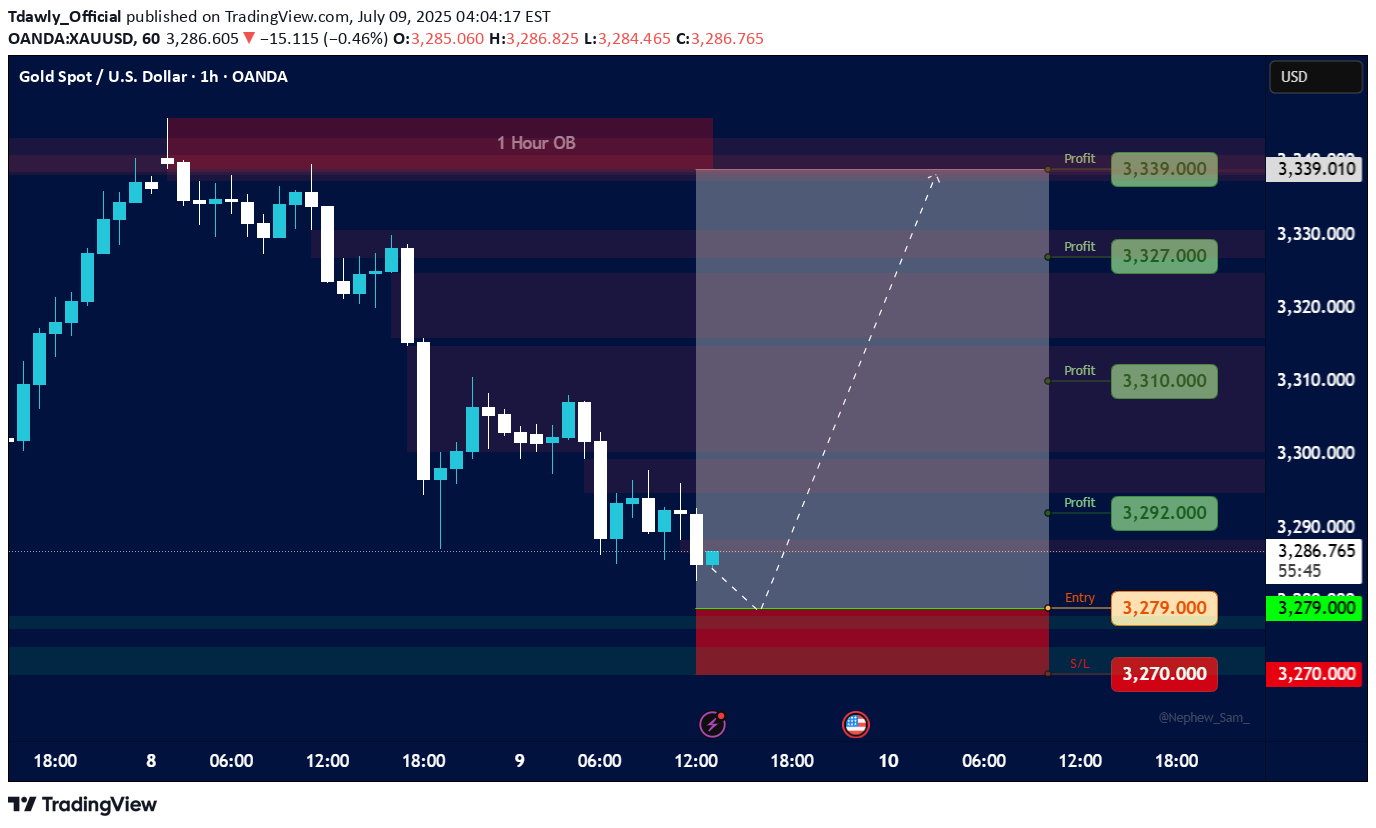
Price Overview Current Price: 3,286,190 24h Change: +15,525 (+0.47%) Recent High/Low: High: 18,286,420 Low: 12,284,465 Order Block (OB) Analysis Profit Targets: Multiple profit levels are identified, with the highest at 3,339,000 and the lowest at 3,279,000. The price is currently between the 3,286,190 (current) and 3,279,000 (next profit level), suggesting a potential pullback or consolidation. Entry & Stop-Loss: Entry: 3,270,000 Stop-Loss (S/L): 3,270,000 (same as entry, indicating a break-even or tight risk strategy). Key Levels (USD) Resistance: 3,350,000 (major) 3,339,000 (immediate) Support: 3,286,190 (current level) 3,279,000 (next profit target) 3,270,000 (critical support & entry) Market Sentiment Bullish Bias: Price is above the entry point (3,270,000) and showing a 0.47% gain. Caution: Profit-taking may occur near 3,330,000–3,339,000. A break below 3,270,000 could invalidate the bullish setup. Actionable Insights If Long: Hold for targets up to 3,339,000, but monitor for rejection at resistance. If Neutral: Wait for a break above 3,330,000 (confirmation) or below 3,270,000 (reversal signal). Risk Management: Tight stop-loss at 3,270,000 protects against downside.
Disclaimer
Any content and materials included in Sahmeto's website and official communication channels are a compilation of personal opinions and analyses and are not binding. They do not constitute any recommendation for buying, selling, entering or exiting the stock market and cryptocurrency market. Also, all news and analyses included in the website and channels are merely republished information from official and unofficial domestic and foreign sources, and it is obvious that users of the said content are responsible for following up and ensuring the authenticity and accuracy of the materials. Therefore, while disclaiming responsibility, it is declared that the responsibility for any decision-making, action, and potential profit and loss in the capital market and cryptocurrency market lies with the trader.