Technical analysis by Tdawly_Official about Symbol PAXG: Sell recommendation (7/25/2025)

Tdawly_Official
Gold Spot / U.S. Dollar - 1h on TradingView, dated July 25, 202
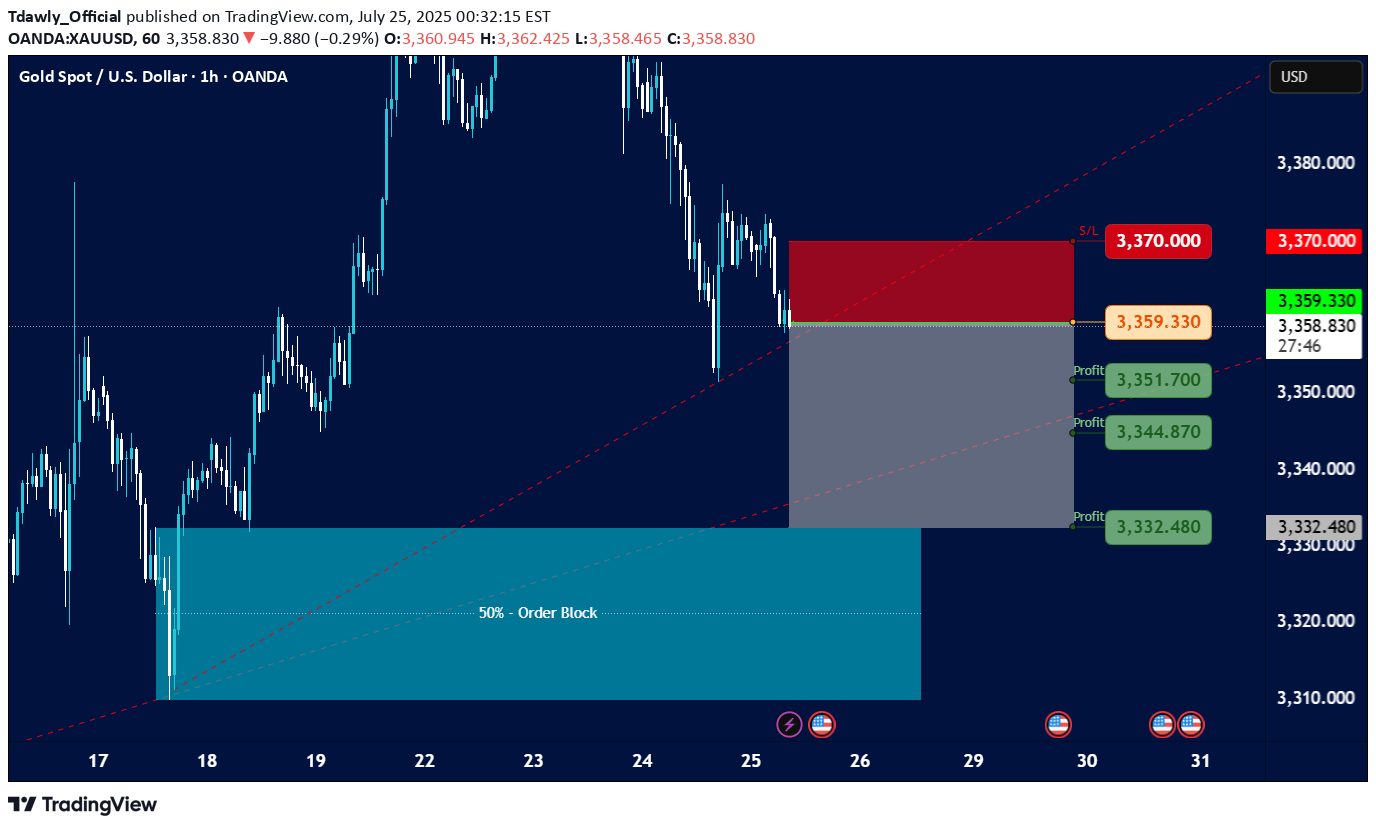
Current Price and Trend: The current price is shown as 3,359.330, and the last traded price is 3,359.005. The chart indicates a downtrend in recent sessions, with the price having fallen significantly from higher levels around 3,380.000 to 3,390.000 down to the current levels. There's a dashed red line (possibly a trendline or resistance) indicating a downward slope. Key Zones and Levels Identified: Resistance/Stop Loss Zone (Red Rectangle): This zone is marked from approximately 3,365.000 up to 3,370.000. A "S/L" (Stop Loss) level is explicitly marked at 3,370.000. This suggests that a short position (selling) is being considered, with a stop loss placed above this resistance. Entry Point (Grey Line): An entry point for a trade is indicated by a grey horizontal line at 3,359.330. This is very close to the current price, suggesting a potential entry for a short trade. Profit Target Zones (Grey Rectangle with Green Labels): Three "Profit" levels are identified below the entry point: 3,351.700 3,344.870 3,332.480 These levels suggest potential targets for taking profit on a short position. The grey shaded rectangle represents the area where these profit targets lie, extending downwards from the entry point. 50% - Order Block (Teal Rectangle): At the bottom left of the chart, there's a large teal-colored rectangle labeled "50% - Order Block." This typically represents an area where significant institutional buying interest (or an accumulation of orders) is expected, potentially acting as strong support. The price has previously bounced off this area. Possible Trading Strategy Implied: The setup suggests a potential short-selling strategy for Gold Spot / USD, likely based on a continuation of the downtrend or a retest of previous resistance levels. Entry: Around 3,359.330 (current price level). Stop Loss: At or above 3,370.000, to limit potential losses if the price moves against the short position. Take Profit: Phased profit-taking at 3,351.700, 3,344.870, and 3,332.480. Target Support: The ultimate target appears to be within the "50% - Order Block" zone, suggesting the expectation of the price reaching or testing this strong support area. Considerations and Further Analysis Needed: Confirmation: The chart doesn't show any specific indicators (e.g., RSI, MACD) that might confirm the downtrend or potential entry. Volume: Volume analysis would be beneficial to assess the strength of price movements. News/Fundamentals: Any upcoming economic data or geopolitical events could significantly impact gold prices. Risk-Reward Ratio: A calculation of the risk-reward for each profit target would be useful to determine the attractiveness of the trade. Market Structure: A deeper analysis of the market structure (higher highs/lows, lower highs/lows) could provide more context.Tp1 is doneTp2 is doneyou can get the final target at 3335.50Follow this trade as long