Technical analysis by Tdawly_Official about Symbol PAXG: Buy recommendation (7/28/2025)

Tdawly_Official
15-minute timeframe for XAU/USD
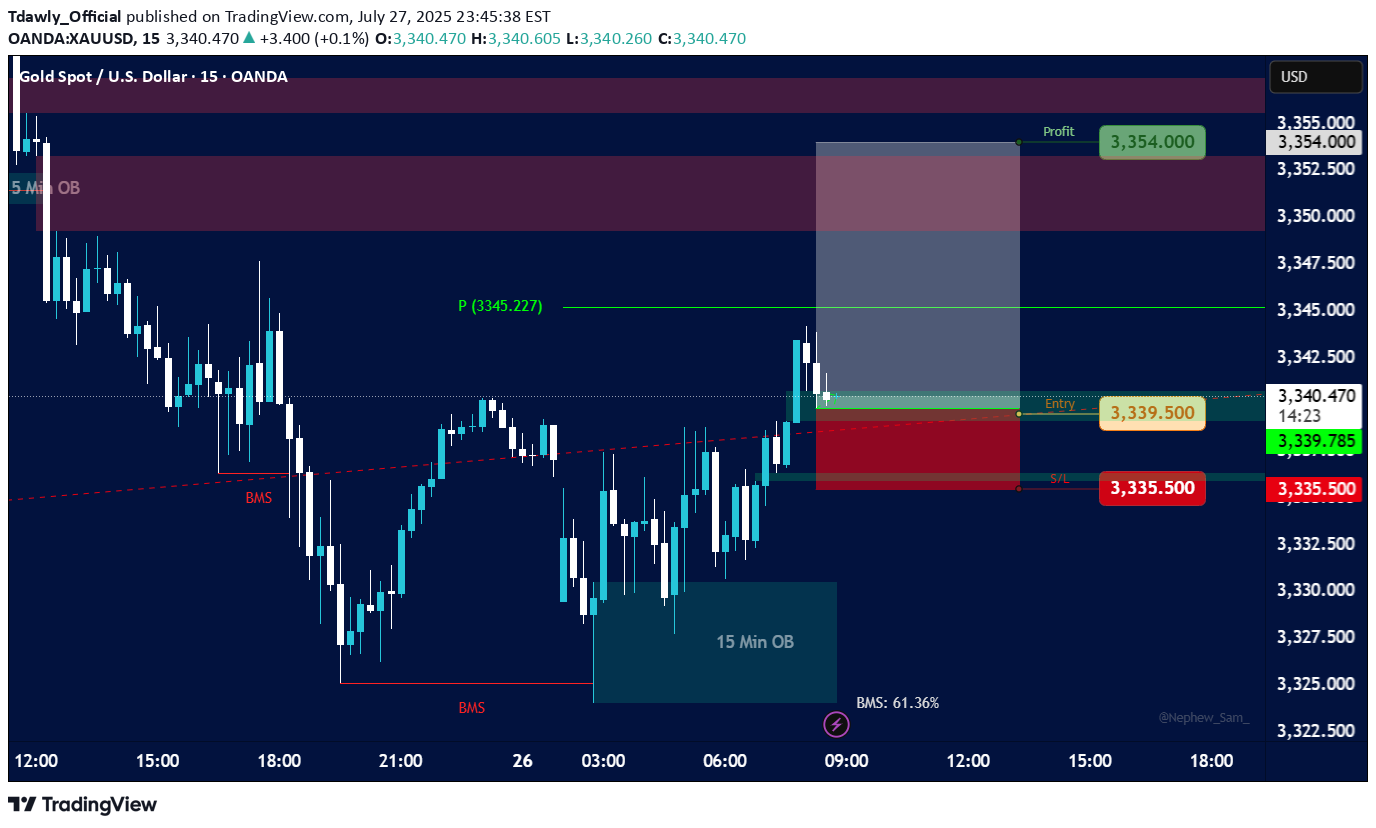
Key Elements and Observations: Price Action: The price initially shows a downtrend, breaking below a previous low, indicated by "BMS" (likely "Break in Market Structure" or "Break of Market Structure"). Following the break, the price consolidates and then shows a strong upward movement, breaking above a resistance level, again marked by "BMS." This suggests a potential shift in momentum from bearish to bullish. Order Blocks (OB): 5 Min OB (Blue Box, Top Left): There's a "5 Min OB" marked at a higher price level earlier in the chart. This represents a bearish order block, where significant selling pressure was previously observed. 15 Min OB (Teal Box, Bottom Right): A "15 Min OB" is identified at a lower price level (around 3326.00 - 3330.00). This is likely a bullish order block, indicating an area where institutions or large players placed buy orders, leading to a bounce in price. Break in Market Structure (BMS): Two "BMS" labels are visible: The first BMS (red dashed line below 3330.00) indicates a break of a support level during the downtrend. The second BMS (red dashed line above 3330.00) indicates a break of a resistance level during the subsequent uptrend, confirming a potential shift in market bias to bullish. Entry, Stop Loss, and Take Profit (Trade Setup): Entry (Green Line): The suggested entry point for a long (buy) position is at approximately 3339.50. This entry aligns with a retest of a previous resistance level that has now turned into support, or potentially the lower boundary of a small bullish order block or fair value gap. Stop Loss (Red Line/Red Box): The stop loss is set at 3335.50. This is placed below a recent low or significant support level, specifically within a red-shaded area that likely represents a "Supply/Demand" zone or an area where the trade would be invalidated. Take Profit (Green Line/Green Box): The take profit target is 3354.00, resulting in a "Profit" of 3354.00. This target is placed at a significant resistance level or an area where price might reverse. The white shaded box above the entry, extending to the take profit, highlights the potential profit zone. Risk-Reward Ratio: While not explicitly calculated, the visual representation suggests a favorable risk-reward, with the potential profit (green box) appearing larger than the potential loss (red box). Pivot Point (P): A "P (3345.227)" is marked on the chart, likely indicating a pivot point, which can act as a dynamic support or resistance level. The current price is trading above this pivot point, further supporting a bullish bias. "BMS: 61.36%" (Bottom Right): This percentage likely refers to a "Break in Market Structure" metric or a specific trading indicator that quantifies the strength or probability of the market structure shift. 61.36% suggests a reasonably strong confirmation. Implied Trading Strategy: The chart depicts a bullish reversal strategy, likely based on "Smart Money Concepts" or "ICT" (Inner Circle Trader) principles. The strategy involves: Identifying a shift in market structure: Price breaking highs after breaking lows, signaling a change from bearish to bullish. Utilizing Order Blocks: Using the 15 Min OB as a foundational support level and potentially looking for entry confirmations around it. Waiting for a Retest/Pullback: The entry around 3339.50 suggests waiting for a pullback after the initial bullish impulse. This could be a retest of a broken resistance level, a fair value gap (FVG), or a small bullish order block within the larger 15 Min OB. Placing Stop Loss Strategically: Below a significant low or invalidation point. Targeting Previous Highs/Resistance: Setting the take profit at a logical resistance level where previous selling pressure was observed.enter again same current price : 3336 with stop lose 3334.50try to close at entry